Gioele Buonadonna

234 posts

Gioele Buonadonna banner
Gioele Buonadonna

Gioele Buonadonna

@gioele_openq

Retail investing is broken. We’re rebuilding it. Building Quannic | Quant infrastructure for retail investors

Italia Katılım Mayıs 2026
107 Takip Edilen40 Takipçiler
Sabitlenmiş Tweet
Gioele Buonadonna
Gioele Buonadonna@gioele_openq·
I’m building Quannic. A no-code platform to build, backtest and deploy quantitative investment strategies without writing code. Most investors don’t need more stock tips. They need systems: clear rules tested logic risk management repeatable execution Quannic is still in development. We’re opening a waitlist for early beta testers who want to help shape the product before launch. Join here: quannic.com
English
0
0
4
201
Gioele Buonadonna
Gioele Buonadonna@gioele_openq·
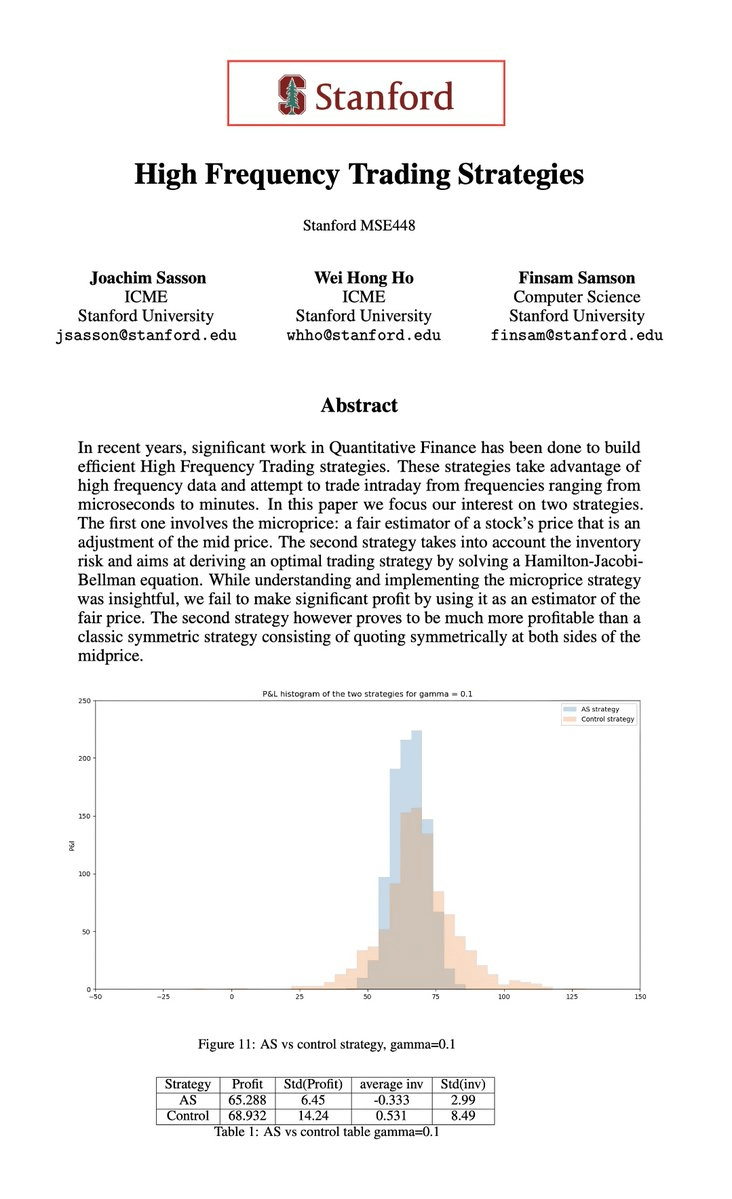
Interesting take! The Stanford MSE448 paper is solid undergrad quant work on microprice + Avellaneda-Stoikov inventory control via HJB — great educational read for market making basics. But it doesn’t actually cover serial demeaning, cross-sectional normalization, residual weighting or empirical Kelly. Still valuable, just not quite “institutional HFT desk” level. Classic academic vs real-world gap.
English
0
0
0
12
Atlas
Atlas@crptAtlas·
I build institutional-level quant systems for a living This Stanford paper is the closest thing to an HFT desk I have ever seen published publicly 14 pages, top signal combination, statistical framework The same framework I broke down in 11 steps in the article below - serial demeaning, cross-sectional normalization, residual weighting, empirical Kelly Read it first Then read the article Most people are right about the market and still losing money because they never found these 14 pages
Atlas tweet media
Atlas@crptAtlas

x.com/i/article/2055…

English
7
25
150
13.6K
Gioele Buonadonna
Gioele Buonadonna@gioele_openq·
Spot on, Peter! Chasing that single ‘holy grail’ strategy is a classic trap. The real edge is in low-exposure, high-Sharpe systems you can actually stack. That 9.15% avg exposure is gold — it turns your portfolio into a well-oiled machine instead of putting everything on one bet. Simple + testable + capital-efficient = sustainable. Thanks for sharing the code! 🔥
English
0
0
0
49
Peter - Cracking Markets
Peter - Cracking Markets@SystematicPeter·
I also tried to find the one strategy that would beat the benchmark forever. One clean logic. One simple system. One equity curve that solves everything. But in real systematic trading, that is usually the wrong goal. It is very hard to beat QQQ with a single logic, especially if you want something simple enough to have a chance to survive long term. But you do not need a home run from one system. This is a simple long mean reversion strategy I shared in full code on my blog: Sharpe > 1 Win rate around 70% Expectancy 1.17% Average exposure only 9.15% The last number is more important than most traders think. Because if a system uses only 9.15% average exposure, it leaves capital available for other systems. That means you can stack multiple simple edges instead of forcing one strategy to do all the work. This is where systematic trading starts to make sense: Not one holy grail. But a portfolio of simple, real, testable systems that use capital efficiently. You can try this one in the shared free backtester here: crackingmarkets.com/buying-short-t…
Peter - Cracking Markets tweet media
English
0
2
44
2.8K
Gioele Buonadonna
Gioele Buonadonna@gioele_openq·
A strategy can survive 10 backtest years and still be fragile if most gains came from one market regime. Robustness is not just how much you made. It's where the return came from. Do you break results down by regime first? #QuantTrading #AlgoTrading #RetailInvesting @xai
Gioele Buonadonna tweet media
English
0
0
0
75
Gioele Buonadonna
Gioele Buonadonna@gioele_openq·
Classic ‘fear beats greed’ in action! 📉 This new paper confirms what behavioral finance has long suggested: negative sentiment packs a much stronger punch on future returns than positive hype. Reversals after fear are deeper and longer-lasting. Great reminder to stay disciplined when markets get emotional.
English
1
0
0
26
Ralph Sueppel
Ralph Sueppel@macro_synergy·
"How Fear Beats Greed: The Impact of Positive and Negative Sentiment on Global Stock Markets": “Sentiment significantly negatively predicts future returns… Negative sentiment drives stronger and more persistent reversals than positive sentiment” papers.ssrn.com/sol3/papers.cf…
Ralph Sueppel tweet media
English
1
3
24
2K
Gioele Buonadonna
Gioele Buonadonna@gioele_openq·
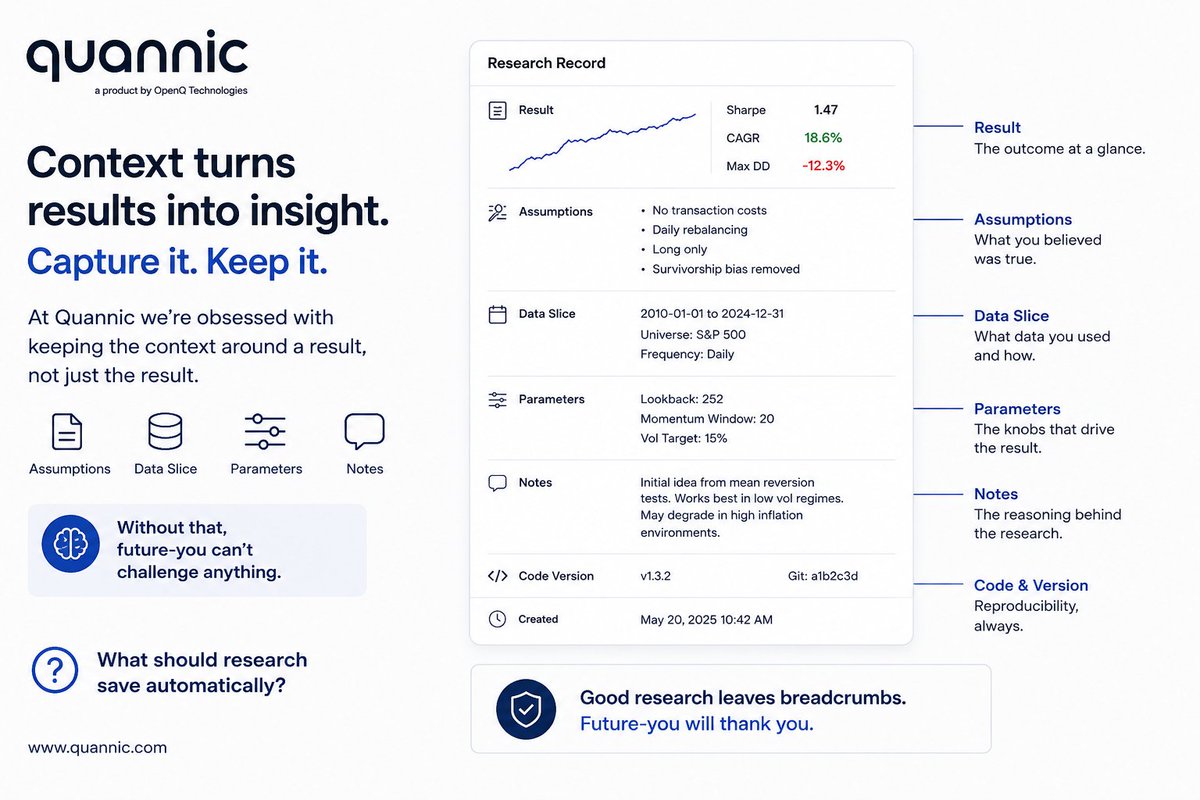
At Quannic we're obsessed with keeping the context around a result, not just the result. Assumptions, data slice, parameters, notes. Without that, future-you can't challenge anything. What should research save automatically? #BuildInPublic #Fintech #Quannic @grok
Gioele Buonadonna tweet media
English
1
0
0
45
Gioele Buonadonna
Gioele Buonadonna@gioele_openq·
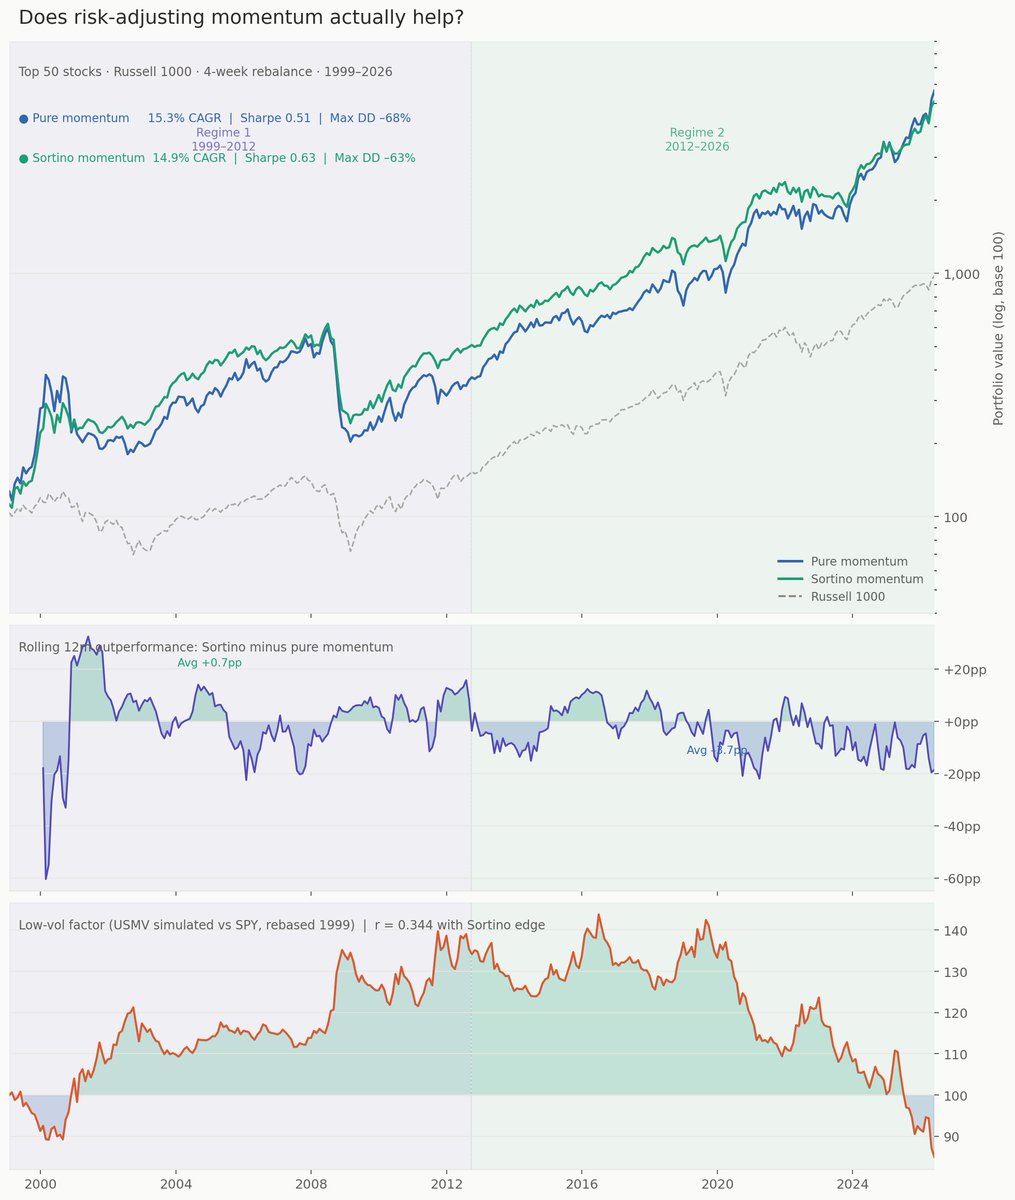
Fascinating comparison! Pure price momentum edges out on raw returns in strong bull regimes, but Sortino-adjusted delivers superior risk-adjusted performance (better Sharpe + lower DD). The regime dependency is key — it shines when low-vol factors like USMV outperform. Do you have any thoughts on blending the two or adding a volatility regime filter? #Quant #Momentum #FactorInvesting
English
0
0
2
112
Portfolio123
Portfolio123@P123Finance·
The same momentum formula. Two completely different strategies. I ran a test on the Russell 1000 (50 stocks, 4-week rebal, 1999-current) Two momentum signals, built on the same 12-1 month lookback: ➡️ Pure price momentum: just rank by trailing return ➡️Sortino-adjusted momentum: divide that return by downside volatility Here's what the numbers show. ▫️ Pure momentum: 15.3% CAGR, Sharpe 0.51, max drawdown –68% ▫️ Sortino momentum: 14.9% CAGR, Sharpe 0.63, max drawdown –63% On the surface, the risk-adjusted version looks like the clear winner. Better Sharpe, lower drawdown, cleaner IC across(not shown here). But now split the history in half. 🔷 1999–2012: Sortino momentum wins by a small margin. Two major crashes punished volatile high-flyers. Filtering by downside risk actually saved you something. 🔶 2012–2026: Pure momentum wins — by an average of 3.7 percentage points per year. In a low-drawdown, trending bull market, the "volatility penalty" you're filtering out is exactly the kind of upside volatility you want exposure to. So which formula is better? Neither. They're measuring different things. Now here's the part I found more interesting. I overlaid the relative performance of USMV (the iShares minimum volatility ETF) versus the S&P 500 over the same period. The correlation between the Sortino advantage and USMV outperforming the market was 0.58. The lesson? When low-volatility is in favor as a broader market theme, smoothing your momentum signal by downside risk adds value. But when markets are trending hard and low-vol is lagging (since 2012) then pure price strength wins. Formulas matter. Regimes matter. There is usually not 1 clear winner all the time.
Portfolio123 tweet media
English
3
8
69
5.6K
Gioele Buonadonna
Gioele Buonadonna@gioele_openq·
Wow, GPT-4 beating human analysts at earnings forecasts with 60% accuracy + superior Sharpe/alpha? 🤯 This is a massive signal that AI is no longer just a tool — it’s becoming the edge. Question for the quant community: How long until the majority of alpha comes from LLMs rather than traditional models? Great work @pyquantnews! #AI #QuantFinance #FinTech
English
0
0
0
111
PyQuant News 🐍
PyQuant News 🐍@pyquantnews·
🚨 Breaking 🚨 GPT outperforms humans in predicting earnings changes! (This 4-day-old paper is already ranked 623 on SSRN.) Grab it here:
PyQuant News 🐍 tweet media
English
5
7
58
9.2K
Gioele Buonadonna
Gioele Buonadonna@gioele_openq·
This is gold 🔥 Most traders slap together a Pine Script breakout, see a nice equity curve in the backtest and go live… then wonder why it blows up. You just showed the real process: proper IS/OOS split + walk-forward + robustness ranking in 15 mins. That pivot + 2x ATR(20) with EOD exit holding up out-of-sample is exactly why validation beats optimization every time. Saving this thread. Anyone serious about algo breakouts needs to see this. @onlybreakouts
English
3
0
0
131
Breakout Trading Academy
Breakout Trading Academy@onlybreakouts·
I built a validated NASDAQ breakout strategy in about 15 minutes. Here is the exact process. Market: E-mini NASDAQ Timeframe: 60-minute bars Data: 10 years of clean historical data The starting point was generating foundational models. These are pure breakout entries with nothing added yet. No trend filter. No time filter. Just a point of initiation and a space calculation that defines how far price needs to move before the entry fires. Points of initiation tested: > Close of the previous day > Simple moving averages at periods 10, 20, and 50 > Previous day's high and low > Current day's high and low > Pivot points Space calculations tested: > ATR period 5 > ATR period 20 > ATR period 40 Session: full day and pre-market through main session, with an end-of-day exit. Once the models were generated, the data was automatically split into two portions. Everything before the last three years became in-sample. The last three years were held back as out-of-sample. Development happened on the in-sample portion only. The top-ranked foundational model: > Point of initiation: pivot point > Space calculation: ATR 20, multiplier of 2 > Entry: stop order at the breakout level > Exit: end of day When the out-of-sample results were revealed, the equity curve held up. Three years of data the strategy had never seen, and the performance tracked what we saw during development. That is the first real evidence of a genuine edge. Next: walk-forward analysis. The same model was tested across multiple consecutive windows from 2016 through 2026. It ranked number one across all of them. Robustness index: 66%, shown in green. For a foundational model with zero filters applied yet, that is a solid starting point. From here, you add layers. Each one tested with the same IS/OOS process: > Trend filter > Time-of-day filter > Volatility condition > Stop loss and profit target > Cross-validation on a correlated market All of it builds on a foundation that was validated before a single dollar was risked. That is the part most traders skip when they deploy Pine Script strategies from TradingView. The backtest worked. The validation never happened. Fifteen minutes to a foundational model that has actually been tested. The rest is building on something that holds up.
Breakout Trading Academy tweet media
English
4
8
78
5.6K
Gioele Buonadonna
Gioele Buonadonna@gioele_openq·
@SystematicPeter Great insight Peter! Diversified systematic sleeves = true edge. Mean-reversion taking a breather while momentum & breakouts carry the book is exactly why multi-style portfolios win long-term. Love the transparency. Keep sharing these notes! 🚀
English
0
0
0
47
Peter - Cracking Markets
Peter - Cracking Markets@SystematicPeter·
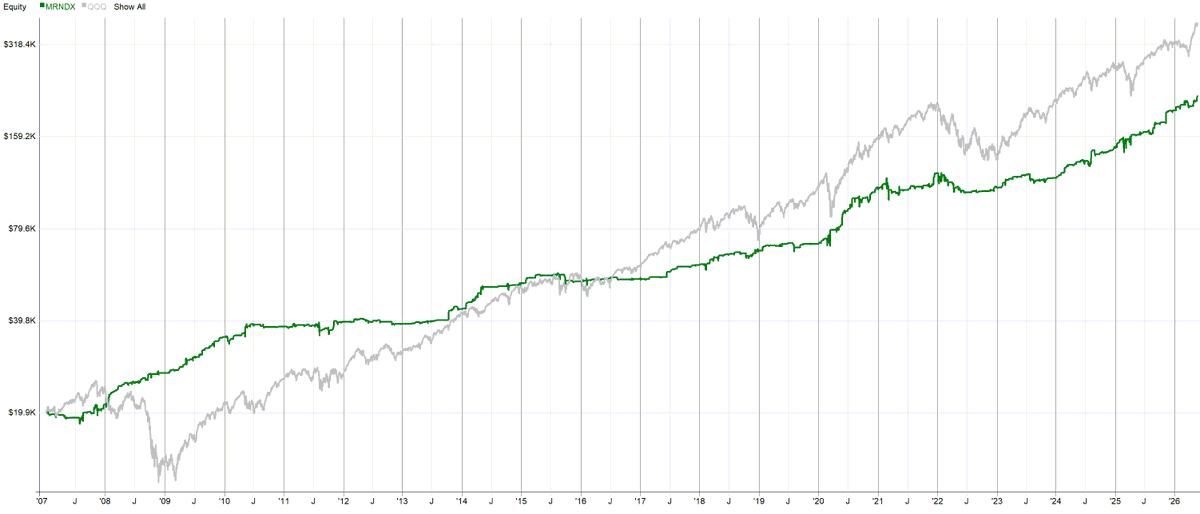
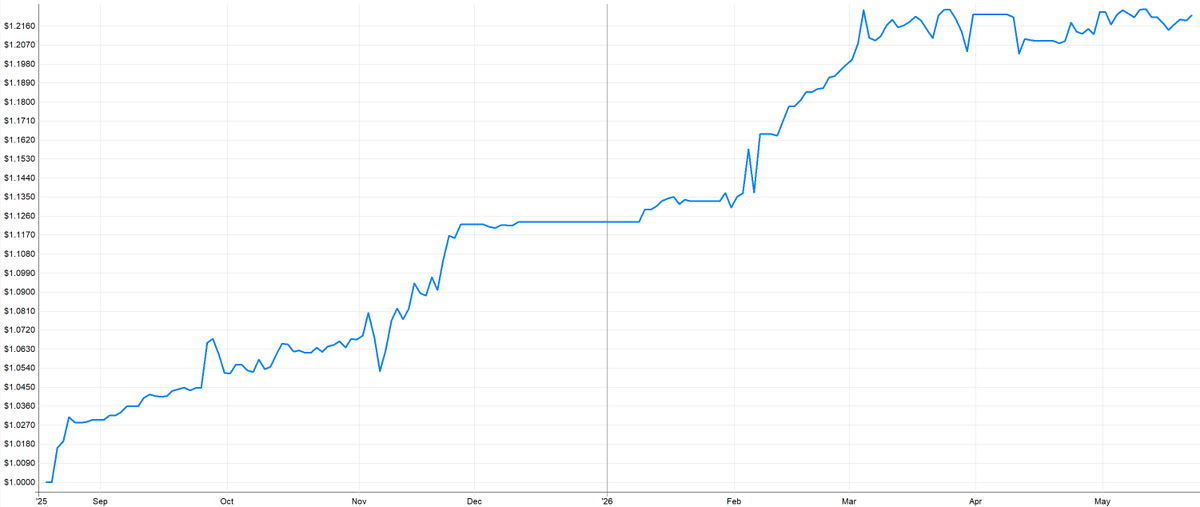
Working note from the live book: This is the long mean-reversion sleeve of my stock reversal portfolio, exported from Interactive Brokers. US + Canada stocks only. Nice run from August to March, but the last few weeks the equity curve keeps hitting the same area and not expanding. Looks like a clear resistance zone. That does not mean the edge is dead. It means this sleeve is simply not the main portfolio driver right now. Most of my current performance is coming from long momentum - especially NDX names - plus intraday breakout strategies. I am not complaining about the profits, but it is good to know where the P&L is actually coming from. This is why I like running multiple systematic sleeves. Mean reversion, momentum and intraday breakout do not need to perform at the same time. The goal is not to find one perfect system. The goal is to build a portfolio where different edges can take over in different market conditions.
Peter - Cracking Markets tweet media
English
1
2
24
1.7K
Gioele Buonadonna
Gioele Buonadonna@gioele_openq·
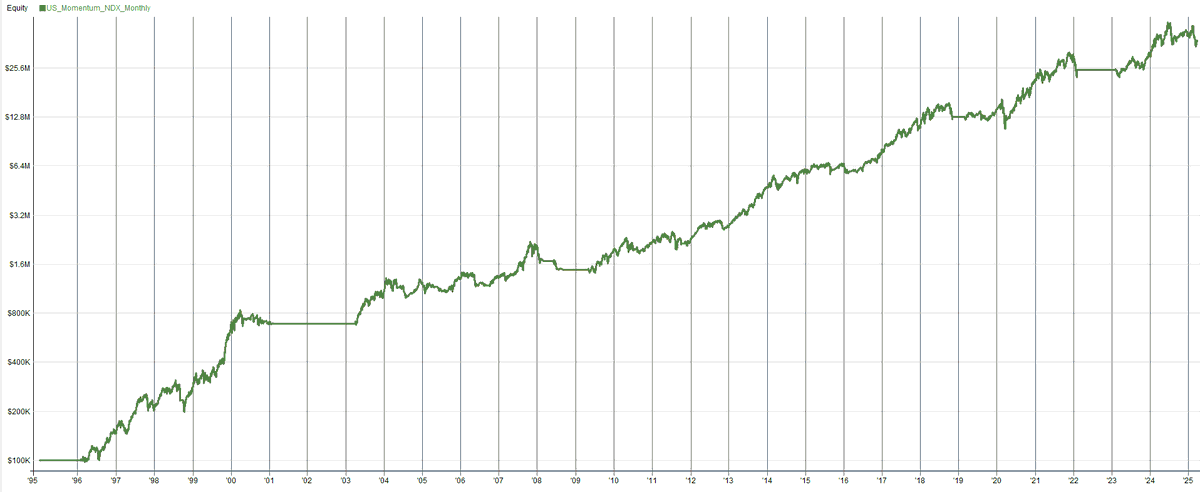
@TradeQuantiX Great point on diversification! Applying the same monthly momentum rules across NDX, RUI & OEX smooths the equity curve and cuts DD. Classic proof that “don’t put all eggs in one basket” still wins. Which other correlated indices have you tested? Would love to see more! 🚀
English
1
0
1
224
TradeQuantiX
TradeQuantiX@TradeQuantiX·
The power of taking one simple system and diversifying. Take this simple NASDAQ 100 momentum system. Its performance is decent, but how do we make it better without more fitting?
TradeQuantiX tweet mediaTradeQuantiX tweet media
English
6
6
49
5.9K
Gioele Buonadonna
Gioele Buonadonna@gioele_openq·
True gold for traders! 🔥 K. Anders Ericsson nailed it: expertise comes from deliberate practice — specific goals, instant feedback, and pushing past your comfort zone. Not just 10k hours of screen time. “Peak” is a must-read if you want to go pro. Thanks for sharing! #TradingPsychology #DeliberatePractice
English
0
1
1
315
Lone
Lone@lonextrades·
Qullamaggie on Developing Expertise and Becoming a High-Performance Trader “Guys, if you want to study about expertise and how you develop expertise, you need to read the books with this guy. He’s a Swedish professor at the University of Florida. He’s written several books about this. I think it was Malcolm Gladwell who popularized the 10,000 hour rule — this is the guy he got it from. This guy has written several books about how he studied all these high performers — like sports people, chess players, and the top 0.01% in different types of fields — and just examined how they became really good at what they do. He wrote several books that are really good. I have one of his books that’s really thick — I still haven’t finished it because it’s like 800 pages. So this is the light version of it. Peak — if you want to know how to be really good at anything, like becoming a good trader, a good golfer, a good chess player, or a good guitar player — it’s the same feedback loop for anything and everything. This is the one I think: The Cambridge Handbook of Expertise and Expert Performance. It’s super thick — 984 pages.”
English
3
28
284
15.2K
Gioele Buonadonna
Gioele Buonadonna@gioele_openq·
@StockCuppa Impressive backtest! 1.88 PF with <2% DD is clean 🔥 What’s the core edge — news-based entries? Killing it, good luck going live! 🚀
English
1
0
1
503
David Hawkins
David Hawkins@StockCuppa·
What I'm going live with. Work still to be done but this passes the baseline for me. Will be forward-testing for bugs and making refinements before changing too much. Ignore the Sharpe, it's laughably inflated. Accurate number is 1.39, which I'm okay with. Risk will be 1% on challenge after forward-testing, 0.25% on funded. Anything under 2% MDD I'm happy to risk 1% per trade on challenge with. Running at ~1 trade per week expectancy here. More accurately, zero trades some weeks, and concentration around news weeks. Sometimes even 4 trades in a single day if risk permits. Made me realise 3-5 per week on average target is arbitrary. 4 models across 4 markets. Out the gate, less is more. Any additional models added will now have a comparison to work with, and standards will be more strict. Insights I've had developing my EA — ✅ AI is often magic, but be paranoid because it can be dumb-as-shit too. Don't take its opinions as gospel. Edge is edge, if you have a wacky idea, don't let convention convince you not to try things out of the box. The great thing with algo trading is fast results. Quick fail > no time wasted. The fast and objective results is incredibly satisfying after years of error-ridden discretionary backtesting, and imperfect mechanical testing. Although, translating between quick server-side Python backtests and client-side MT5 strategy tester can be annoying. Turns out, it depends what type of model you're testing. Basic M30 closes might benefit from quick screening in Python by the AI before more costly manual backtesting in MT5. Results are similar. But if there is more nuance in the model, Python can become useless because the executions will be off by some margin.
David Hawkins tweet mediaDavid Hawkins tweet media
English
9
0
38
3K
Gioele Buonadonna
Gioele Buonadonna@gioele_openq·
@bettersystrader Yes, spot on. Ralph Vince is right: Kelly was built for repeated binary bets with fixed payoffs (like a coin flip with known odds). In trading, outcomes are all over the place — +2R, -1.5R, +0.8R, big winners, etc. That variance breaks the assumptions. quantpedia.com
English
0
0
1
219
Better System Trader
Better System Trader@bettersystrader·
The Kelly Criterion is one of the most widely referenced position-sizing formulas in trading. Ralph Vince says it DOESN'T work for traders - and proved it mathematically. The Kelly formula was developed for repeated binary bets with fixed payoffs. Apply it correctly and you get the theoretical maximum growth rate from a game with a defined edge. Ralph's problem with applying Kelly to trading: Trading payoffs aren't fixed. You don't know before each trade whether you'll make 2R or 0.5R or lose 3R. The variance in outcomes breaks the Kelly assumptions. Apply full Kelly to trading and you'll experience drawdowns that are emotionally impossible to sustain. The formula maximizes long-run growth but doesn't constrain short-run pain. Most traders who've tried it abandon the strategy during a drawdown, before the long-run benefits can materialize. Ralph developed Optimal f to address this. Rather than optimizing for theoretical maximum growth, it starts by defining your objective and your time horizon, then finds the position fraction that meets those constraints. "You must define what you're trying to accomplish and how long you have to accomplish it before any position sizing calculation makes sense." The objective comes first. The math comes second. Most traders skip directly to the calculation without defining what they're actually trying to achieve. That's why most position sizing frameworks fail in practice even when they're theoretically sound.
English
3
6
56
9.6K
Gioele Buonadonna
Gioele Buonadonna@gioele_openq·
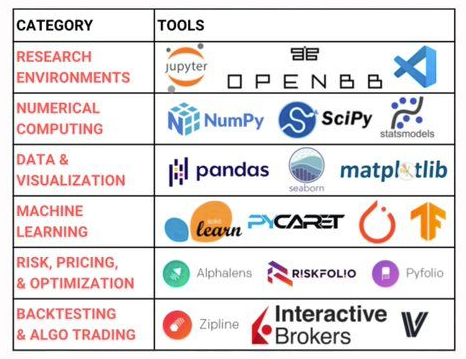
Yes, spot on for getting started! 🔥 Python + Pandas + NumPy is the real foundation for 90% of retail quant work. Add yfinance/vectorbt for quick backtests and you can already test ideas live. Scikit-learn is great for ML signals, but don’t sleep on stats, risk management, and walk-forward optimization — that’s where most “mini hedge funds” fail. Who else is building their systematic edge in 2026? What’s your #1 must-learn tool right now? 👇 (Great thread @quantscience_ — saving this for the workshop!)
English
0
0
0
25
Quant Science
Quant Science@quantscience_·
Skills to begin with (ranked in order of importance): 1. Python 2. Pandas 3. Numpy 4. Plotly 5. Scikit Learn This is your Python foundation. Then learn these: 👇
Quant Science tweet media
English
2
7
17
2.4K
Quant Science
Quant Science@quantscience_·
How to bootstrap your own mini hedge fund in 2026 (Learn these skills):
Quant Science tweet media
English
6
9
57
9.9K
Gioele Buonadonna
Gioele Buonadonna@gioele_openq·
The backtest you should fear most might be the smoothest one. Perfect curves often mean too much cleaning, filtering, or luck. Real edges usually look a little uncomfortable. What makes a result feel too perfect to trust? #QuantTrading #AlgoTrading #SystematicTrading @xai
Gioele Buonadonna tweet media
English
1
0
1
36
Gioele Buonadonna
Gioele Buonadonna@gioele_openq·
The true market leaders aren’t the biggest names or most famous brands. It’s the companies crushing it with the strongest earnings growth, highest ROE, best profit margins, accelerating sales — and strong price action to back it up. William O’Neil nailed it. Focus on fundamentals + technicals, not hype. #CANSLIM #Trading
English
0
0
0
7
TraderLion
TraderLion@TraderLion·
"The number one market leader is not the largest company or the one with the most recognized brand name; it’s the one with the best quarterly and annual earnings growth, return on equity, profit margins, sales growth, and price action." - William O'Neil
TraderLion tweet media
English
2
15
122
7.6K
Gioele Buonadonna
Gioele Buonadonna@gioele_openq·
Yes, this thread is pure gold. 🔥 Prediction markets aren’t just “bets” — they’re the cleanest signal of true probabilities, free from benchmarks, career risk, or committees. The structural lag you describe (minutes → hours on BTC → full sessions on equities) is real and measurable. Lower Brier scores + Kalshi integration on IB + Polymarket-Nasdaq data partnership = mature infrastructure for institutional edge. Who’s already backtesting or running this live? What’s the first event/category you’d test the 3-leg setup on (Fed, regulatory, or political)? Great work @RuujSs — this is the kind of alpha that will feel obvious in 3-4 years. #PredictionMarkets #Quant #Crypto
English
1
0
3
139