TylerOT

10.3K posts

TylerOT banner
TylerOT

TylerOT

@ot_tyler

Never financial advice | Opinions expressed are my own |

Katılım Şubat 2020
2.3K Takip Edilen383 Takipçiler
TylerOT
TylerOT@ot_tyler·
$NQ down, but not a dramatic selloff. Chill.
TylerOT tweet media
English
0
0
0
31
Peter DiCarlo
Peter DiCarlo@pdicarlotrader·
People don’t actually watch my content. They skim. Every comment on $TSLA today proved it. My thesis stayed the same for 6 months. It didn’t hit the target. And suddenly… everyone forgets the process. Most people don’t want understanding. They want outcomes. Get one call wrong and they switch instantly.
English
93
6
533
32.4K
TylerOT
TylerOT@ot_tyler·
$ADBE target 255. Then gap fill 269. This is a done deal.
TylerOT tweet media
English
0
0
1
79
TylerOT retweetledi
Lyn Alden
Lyn Alden@LynAldenContact·
Since Berkshire is an insurer, it needs a lot of cash on hand, and so ratio charts tend to be more informative than nominal charts. Berkshire's cash amount as a share of enterprise value has averaged 24% over 20+ years, whereas today it's nearly twice that at 44%.
Lyn Alden tweet media
@jason@Jason

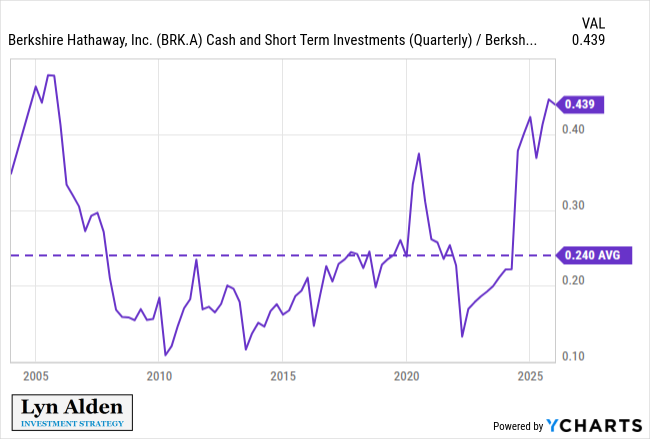
Berkshire has $373b to invest… 🤯
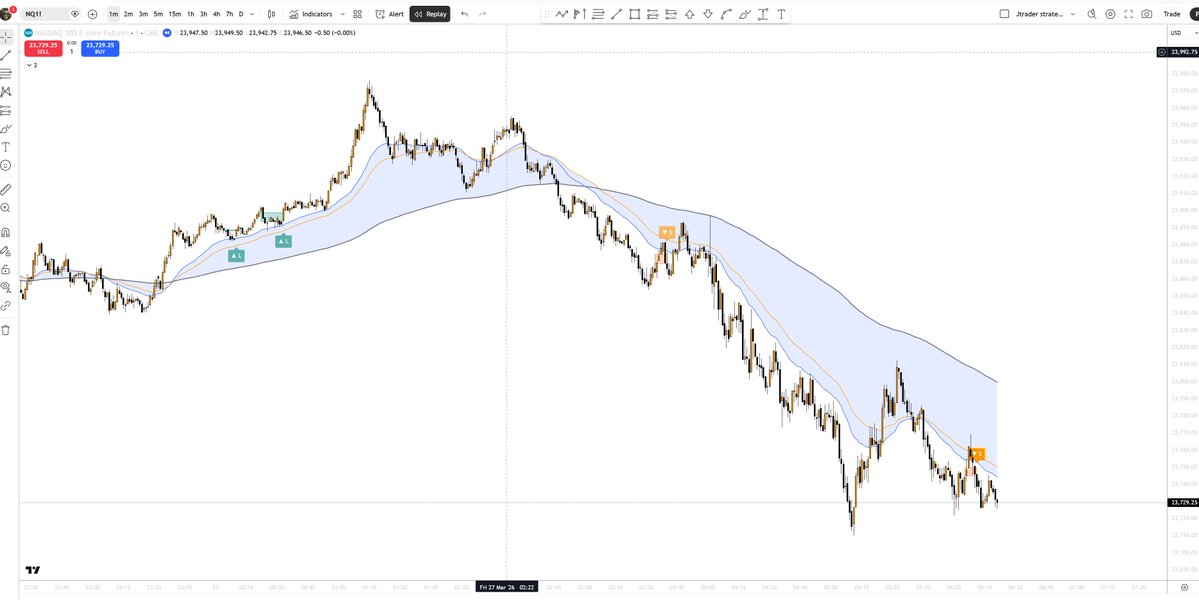
English
80
147
1.7K
189K
TylerOT retweetledi
Steve Jacobs
Steve Jacobs@SteveDJacobs·
Personally, I find Kelly way too aggressive for trading and find quarter Kelly the most appropriate for my style. The asymmetry of fractional Kelly means that risk shrinks geometrically (quadratically in variance), while reward shrinks only linearly. The Geometric Relationship Between Fraction, Growth & Risk The growth rate g(f) is a concave function of the betting fraction f: g(f) = p·ln(1 + bf) + q·ln(1 − f) This curve has a single peak at f = f*. Betting more than Kelly actually reduces long-run growth, and eventually guarantees ruin (see enclosed table). The ¼ Kelly Trade-off: Why It Works The concavity of g(f) means you give up relatively little growth by scaling down, but shed disproportionately large risk: * Variance scales as f² — so ¼ Kelly has (¼)² = 1/16th the variance of full Kelly * Expected log-growth scales roughly linearly near the origin — ¼ Kelly retains roughly ~50–60% of maximum growth * Maximum drawdown (which scales with volatility) is reduced by a factor of ~4× You may also enjoy this article: rpc.cfainstitute.org/blogs/enterpri…
Steve Jacobs tweet media
English
2
6
14
2.4K
TylerOT retweetledi
Steve Jacobs
Steve Jacobs@SteveDJacobs·
@slicedchedda Red font is extended (and if it is 11x ATR from SMA50 then it is over-extended). Purple are in the 5-7x ATR range so they are “holds” provided you entered lower. Orange and yellow are the focus for new positions and adds.
English
0
1
2
130
TylerOT retweetledi
Steve Jacobs
Steve Jacobs@SteveDJacobs·
📈 Relative Trend Strength For Swing Traders *💪 + watchlist stocks highlighted Relative Trend Strength grades stocks based on their Relative Strength AND Trend Strength. A+ stocks have both the highest RS AND strongest price structure trend. Yellow / Orange cells => Watchlists 1/2 Red font => over-extended 7x ATR-to-SMA50 or greater Purple font => extended 5x ATR-to-SMA50 or greater *Above Avg. ATR + 50M daily $ volume
Steve Jacobs tweet mediaSteve Jacobs tweet mediaSteve Jacobs tweet media
English
2
6
35
3K
TylerOT retweetledi
matt fortini
matt fortini@nhfortini·
I just spent 15 minutes and created a VCP 8ema pullback scanner across the entire S$P 500 market cap greater than 10B with ADR > 2.5 and when you hover over the symbol you get daily chart. I am blown away honestly ....
matt fortini tweet media
English
14
13
113
16K
TylerOT
TylerOT@ot_tyler·
$GBPJPY target 213. Will take time.
English
0
0
0
24
TylerOT retweetledi
Peter St Onge, Ph.D.
Peter St Onge, Ph.D.@profstonge·
My April stock newsletter just dropped, with updates on the economy, the war, and the portfolios. Year to date, the "Adrenaline" growth portfolio is underperforming by 3% annualized, while the "Market Neutral" portfolio returned 20% annualized -- beating the market by 45% 🤯 open.substack.com/pub/profstonge…
Peter St Onge, Ph.D. tweet media
English
8
22
188
32.8K
TylerOT retweetledi
Peter St Onge, Ph.D.
Peter St Onge, Ph.D.@profstonge·
Half of “jobs” in China’s cities are now gig work like food delivery, Uber, livestreaming, and freelancing. China's job wipeout is a test-case for what AI could do in America.
English
68
522
2.5K
164.2K
TylerOT
TylerOT@ot_tyler·
$OXY short target 58.
English
0
0
0
40
TylerOT
TylerOT@ot_tyler·
$CL crude short. Target 102.
English
0
0
0
35
TylerOT retweetledi
Riku
Riku@traderiku·
SMT Expiry Dates - Mini Lesson SMT has expiry dates The higher the timeframe the longer the expiry date, the lower the shorter This is why a 90m sequential SMT in Asia will likely not form the high/low of the day, but a 90m sequential SMT in NY can form the high/low of the day
English
5
32
347
19.2K
TylerOT retweetledi
Afyz
Afyz@XYJtrades·
When it is mechanical.. it repeats. Here's an example of the exact SS framework I taught you which allows you to engage the market away failure swings. This is from a backtesting session of mine: May 2025.... Same exact logic.
Afyz tweet mediaAfyz tweet mediaAfyz tweet media
English
5
17
207
9.1K
TylerOT retweetledi
The Tail That Wags The Dog
The Tail That Wags The Dog@TailThatWagsDog·
I just want to show you guys an excerpt from (unedited) from my process, prompting Claude on this income portfolio. It's looks and feels so convincing. But it leaves many of us doubting ... myself included. But the process APPEARS so "thoughtful" ... so plausible.
The Tail That Wags The Dog tweet media
The Tail That Wags The Dog@TailThatWagsDog

Got a lot of feedback on this tweet that was essentially ... if it looks to good to be true, it's probably not (true). One ... referencing a white paper posted by @tobyjwade. "When AI Sounds Smart But Gets the Numbers Wrong" deepvest.ai/articles/when-… This is a sobering "must read" for anyone interested in using chatbots to construct portfolios. A few excerpts from the research: • Claude Opus 4.6 fabricated data to produce approximate results—essentially hallucinations built on hallucinations. •. Non-Repeatable Results: When we asked the same question multiple times, frontier models frequently gave different answers. •. General-purpose AI tools failed 85% of tasks, producing incorrect calculations, hallucinated data, or no results at all.

English
3
2
26
8K
TylerOT retweetledi
Masked Trader
Masked Trader@masked_stat·
Going after paid alert indicators and open-sourcing them 😄 This time: EMA inversion from @jtrader Simple idea (EMA + inversion) but surprisingly decent P&L even without tweaks I added my own twist (3-candle rotation) Open source indicator: tradingview.com/script/6SBTqyR… Strategy + P&L: tradingview.com/script/6WqYIeB… Honestly worth exploring further might run some ML to filter and isolate the A+ setups via Python Credit to @jtrader for the idea Less for putting alerts behind a paywall Open-source → real stats, real validation
Masked Trader tweet mediaMasked Trader tweet media
English
33
72
712
62K