
@Beyondwb2 I also let Claude check the code I pushed to GitHub. Running into rate limits though on Claude
English
PJB
2.6K posts


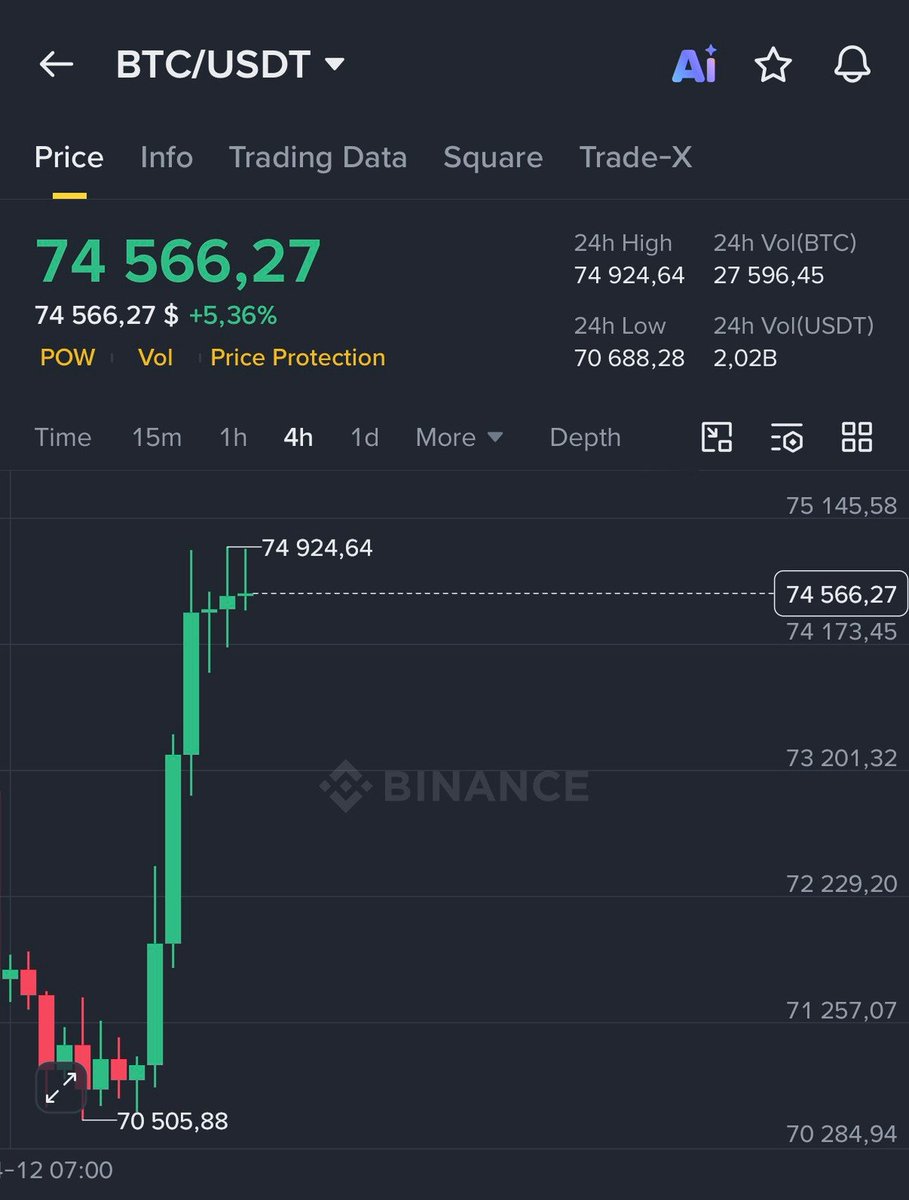
🚨 READ THIS CAREFULLY NOW $BTC PERFECTLY FOLLOWS A DESCENDING CHANNEL PATTERN $126K → $80K → $97K → $60K → $78K The structure is repeating perfectly, check the chart. 54% drop from ATH → complete Relief rally → now Final capitulation → next This is where the trap is. Most traders think the bottom is in during this phase. It isn’t. The part almost nobody understands: Timing. Days from cycle top → final bottom: 2012: 405 days 2016: 362 days 2020: 376 days Based on historical timing, the highest-probability window for the real bottom is: July–November 2026. That matters more than any price level people are watching. Most traders think like this: “I’ll buy at X.” But real bottoms don’t form where it feels obvious. They form where people give up. And before that happens: There has to be pain. - Forced selling (happening). - Liquidations (in progress). - Panic (almost there). - Sentiment collapse (soon). When people stop buying dips… Narratives break… Everyone turns bearish… That’s when bottoms form. We’re not there yet. Yes, I started accumulating in the $60k range already. Even though the timing window isn’t here yet. Back in October, around $120k, I said I’d be a strong buyer near $60k. People laughed. “BTC will never go below $100k again.” Now we’re here. Remember, I was the only one publicly calling the exact bottom at $16,000 three years ago and the top at $126,000 in October. If you missed those calls, don’t worry. I’ll call the next one too. Turn notifications on. If you’re not following yet, you’ll understand why that was a mistake later.


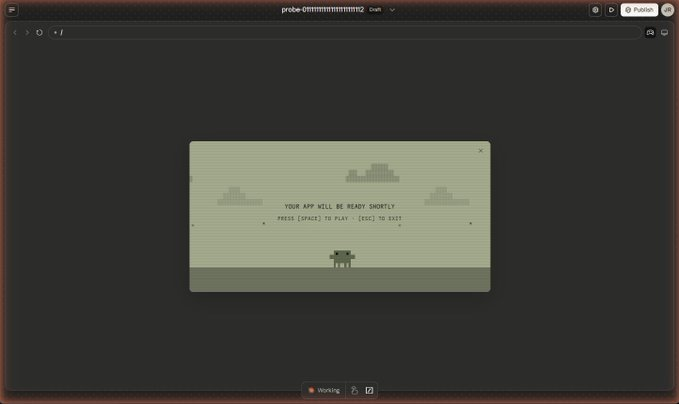
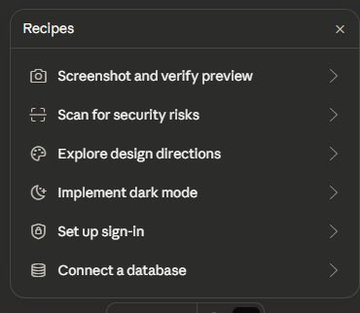
Sneak leak at something coming soon to Claude :)


Drone strikes on Amazon Web Services sites this week in the UAE and Bahrain highlight the vulnerability of cloud facilities that are symbols of US tech power in the region. ft.trib.al/v7ZedXA