
Plinian Put
927 posts


Xi tells Musk, Tim Cook and other CEOs on Trump's trip: China will 'open wider'
That my friends is how winning is done!
cnb.cx/4flccZt
English

Trump went to China pretending to be a big strong alpha male and was reduced to a sputtering mess by President Xi, a horrible authoritarian. Trump ended up mumbling about Taiwan and ranting about “Chinese food.” Trump loves dictators, and the dictators know they can manipulate Trump. Sad state of affairs for the US.
English

QUESTION OF THE DAY
Ask me anything about China. Living there, the CCP, the food, the culture, language, go for it
1776@humanevents.com
English

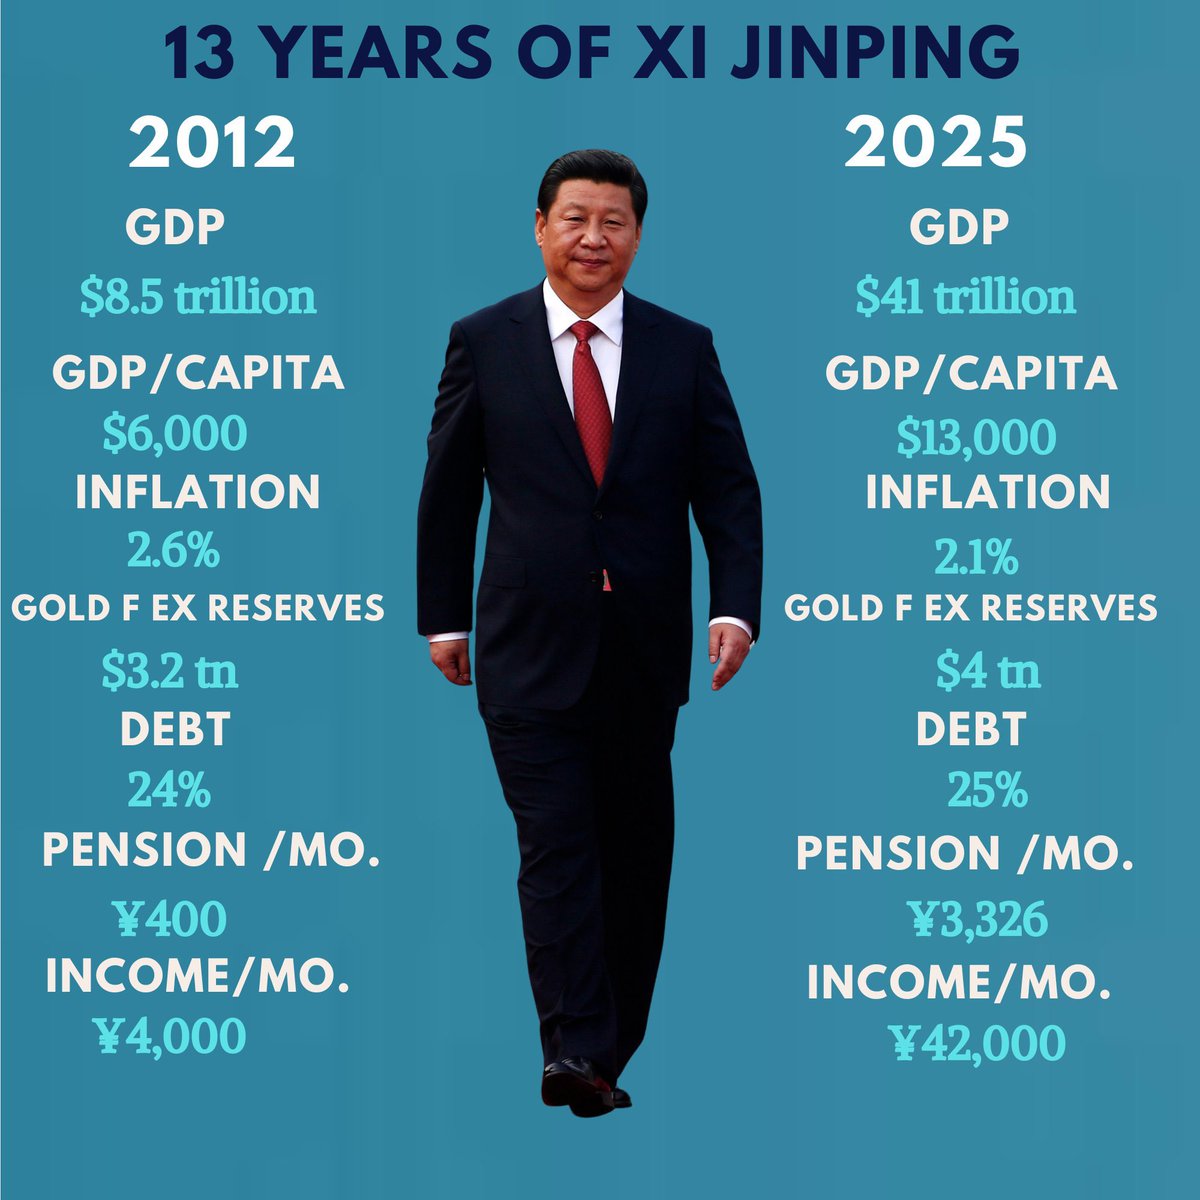
There were predictions about China overtaking the U.S. economy by now, but the U.S. is at least 1.5 times bigger at $32 trillion vs China’s $20 trillion.
China’s economy has been plagued in recent years by deflation, a property crisis and severe youth unemployment and demographics issues
The Hill@thehill
Iran war may give China, Xi, some leverage on Trump at Beijing summit thehill.com/homenews/admin…
English

As Trump heads to China to meet Xi, it’s time for a reality check on the Chinese economy.
We’ve endured years of breathless talk about the “Asian century” and China’s inexorable rise. Elites couldn’t stop praising the “China model” with its state-led efficiency, gleaming infrastructure, and unstoppable momentum. That narrative has aged disastrously. So much so all the old pro-engagement business leaders have begun changing their tune to save face (Dimon, Dalio et al.)
Even with reported 5% annual growth, China is not closing the gap with the US in nominal USD terms. Its GDP as a share of America’s peaked at 78% in 2021 and has fallen to just 64% in 2024.
Yes the renminbi’s sharp depreciation against the dollar is true, but it begs the question of why did the currency weaken enough to slash China’s relative GDP by 14 percentage points in three years? Currency collapse is not a sign of strength. The RMB has recovered some ground over the past 18 months, yet deflation and chronic overcapacity will cap any sustained rally.
With PPP adjustments, the gap closes but the US is still richer than China. Don’t listen to the blackpillers saying the US is collapsing or the “dollar dominance is ending.” Both countries have debt problems but China knows how to creatively hide it.
Markets tell the starkest truth. US equities (S&P 500) have surged from ~$45 trillion in 2021 to $55–60 trillion. Chinese indices (CSI 300 + Hang Seng) have slid from ~$13 trillion at their peak to around $10 trillion. If this were just a currency story, America’s market values wouldn’t be booming while China’s shrank in absolute terms.
The bottom line: China’s slowdown is structural. America is in much better shape and barring some epic self-cucking, the US should still be dominant

English


The world order is shifting away from the axis of evil. As Russia falters and 4 years of pointless aggression have won them nothing but a stronger Ukraine and Europe. Iran plays strong while teetering on some fantastical belief that holding a little Strait even matters at all. China now meeting with Trump realizing they picked the wrong team and their economy and future is crap. Maybe the enemies of peace and freedom might consider a different future...
English


I don't think carbs are a problem for building muscle.
I want to be clear about that, because I'm going to be misquoted on it within fifteen minutes of posting.
Carbs can be very useful. They're perfectly healthy in the right context, eaten by someone whose metabolism handles them well, in quantities that match their training. There are physiques built on rice and chicken. There are physiques built on potatoes. The world is large.
What I don't think is that carbs are necessary.
When you train the way I train, low rep, low volume, high intent, you're predominantly using the phosphocreatine system. The first ten seconds of any heavy effort. Glycogen is barely touched. You're not draining a system that needs refilling. You're not running a marathon at the end of every set.
Once you're properly fat adapted, six months in, sometimes longer, the body becomes extraordinarily efficient at running on fat and ketones for everything that isn't a sprint. Meat and fat take care of the building. Ketones take care of the energy. The system is closed.
The bonus is everything else.
You feel better. You recover faster. You look trimmer because you're not retaining water from glycogen storage. You don't have post-meal slumps. You don't need a pre-workout to get through a session that should already feel manageable.
Six years on carnivore. Six years of training. The physique is there. The strength is there. The recovery is there.
Carbs aren't the enemy. They're just not the requirement they've been sold as. You can build a body you're proud of without them, on meat and fat and a pot of butter.
That's been good enough a reason to keep me here.
English

I have completed the heretic's bodybuilding checklist:
- I don't eat before training
- I do not exceed 6 reps
- I rest 3 minutes
- I leave one rep in the tank
- I do five exercises
- I am out in under 50 minutes
- I do not deload
- I do not chase the pump
- I eat meat afterwards
- I skip the carbs
- I sleep
I will be excommunicated from the bodybuilding orthodoxy. The muscle does not seem to care.
English

If you invested $100 in the Shanghai Composite Index at its peak in 2007 you would have around $50-60 now, 2 decades later, w/o even adjusting for inflation.
$30-40 if you do.
Seems like that might be a more important caveat to mention than "size."
David Ingles@DavidInglesTV
The Asia Century 20 years ago, just 2 of the world's 10-largest stock markets came from Asia. Today, 6 out of the top 10 are from the region. China's equity market, which didn't make the top 10 list in 2006, is about 25 times larger today. Recently, Taiwan and Korea have ripped into the top tier at a mortifying pace. The US definitely remains unparalleled in size and depth. Outside of America, it's clear where the center of growth/innovation gravity is.
English


Stanley Druckenmiller on investing in China: "We exited China in 2018. We haven’t made a single trade in security there other than their currency once in a while. I will never invest in China as long as the current leader is there. The reason I’ll never say never is if they had a change in leadership, I’d at least consider the situation. I didn’t invest in Russia, and I’m not investing in China."

English

This account does nothing but constantly hype life in China. And now says life in the West is just as good.
Jostein Hauge@haugejostein
I've now visited three provinces and two municipalities in China, and based on what I've seen, there's no clear gap in quality of life between the West and China. Some things are generally better in the West: air quality, real wages, work-life balance. Some things are generally better in China: infrastructure, urban modernity, safety. Overall, the gap that many Westerners assume exists has largely closed.
English

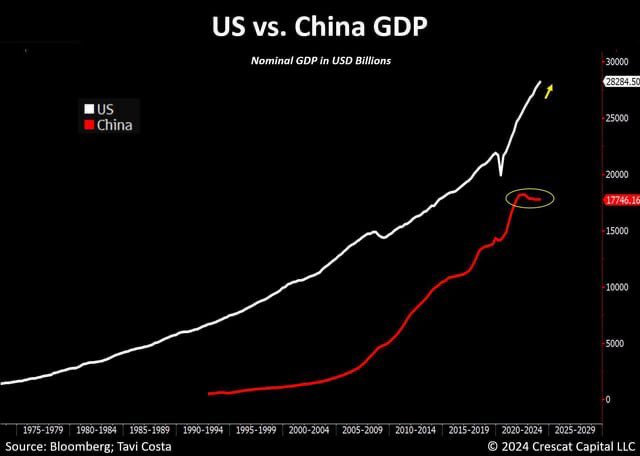

The dream of China surpassing the U.S. as the world’s largest economy is fading. In 2021, China’s GDP was about 78% of the U.S.; by 2024, that share had fallen to roughly 64%, back to around 2017 levels, with the gap between the two economies doubling in just a few years.

English

just spent 2 weeks in china. went into it thinking we're cooked. came back more bullish on america than ever. here's why:
1. chinese citizens are way more chronically online. on the subway, train, anywhere, literally everyone is glued to their phone. gaming, short form, wechat. "don't walk and look at your phone, it's dangerous!" announcements flood crowded areas. their tiktok isn't any better, its still garbage, soft-core porn, etc.
2. everyone's using AI — deepseek, kimi, doubao. but nobody's afraid of losing their job to it. here it feels like there's an existential crisis every week. in china, nothing. i think the CCP won't let companies mass-layoff workers. great for short-term stability. terrible for long-term competitiveness on a global scale.
3. china doesn't produce weirdos. i sat in on a class at tsinghua (china's MIT). not one student spoke unless the professor read their name out loud. no questions. no debate. chinese education produces world-class executors, not contrarians. it does make it a safer place to live though.
4. china doesn't have christianity but it has something america doesn't have: a shared story everyone believes in. every person age 25-70 watched their country go from abject poverty to skyscrapers in one lifetime. that kind of collective proof has a deep unifying effect. compare that to how divided we are right now. america has a huge meaning vacuum that needs to be filled.
nevertheless, i return back to my home in america reinvigorated. because everything i saw confirms one thing: china optimizes. america innovates. and the innovators always win.
English
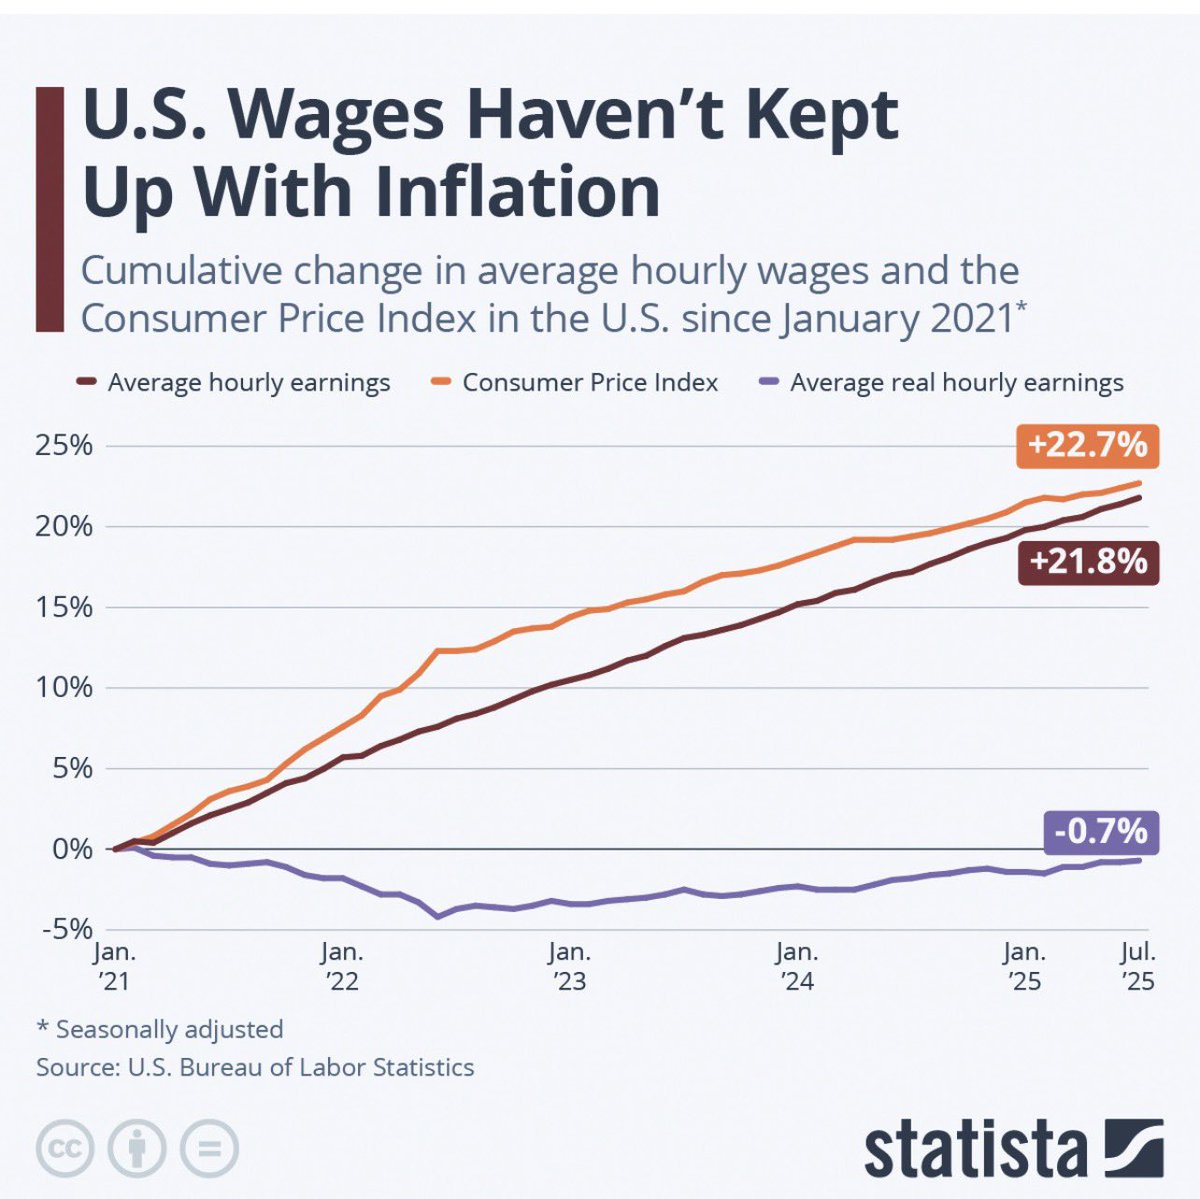
The Headline CPI today was about oil - Core Inflation remained well behaved. Shelter and Core Services CPI are at or below pre-COVID levels, reinforcing that underlying inflation pressure has eased. Only Core Goods remains elevated, which should retrace as we lap the one-year mark on tariffs.

English
English

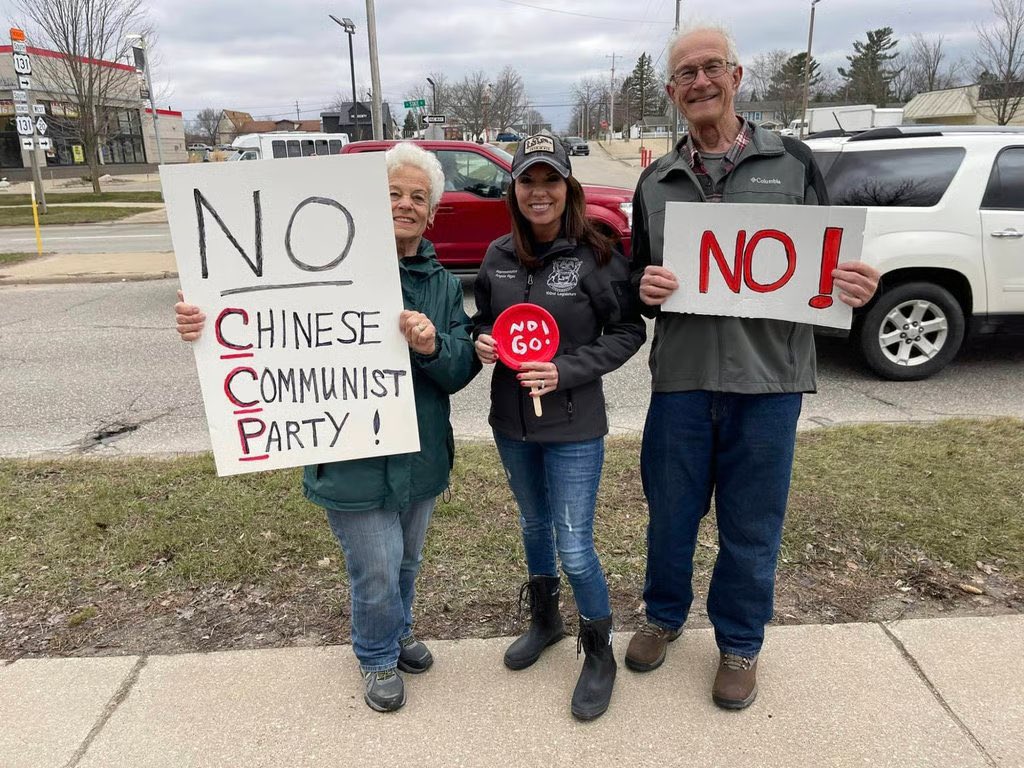
@zhao_dashuai Okay bro, have fun pretending China isn't creating the largest army in history to invade and sieze the democracies of their choice.
English

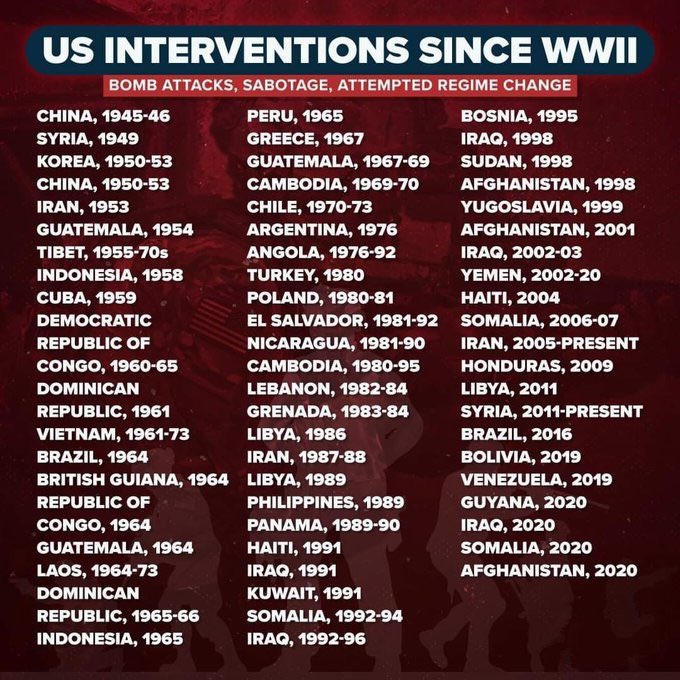
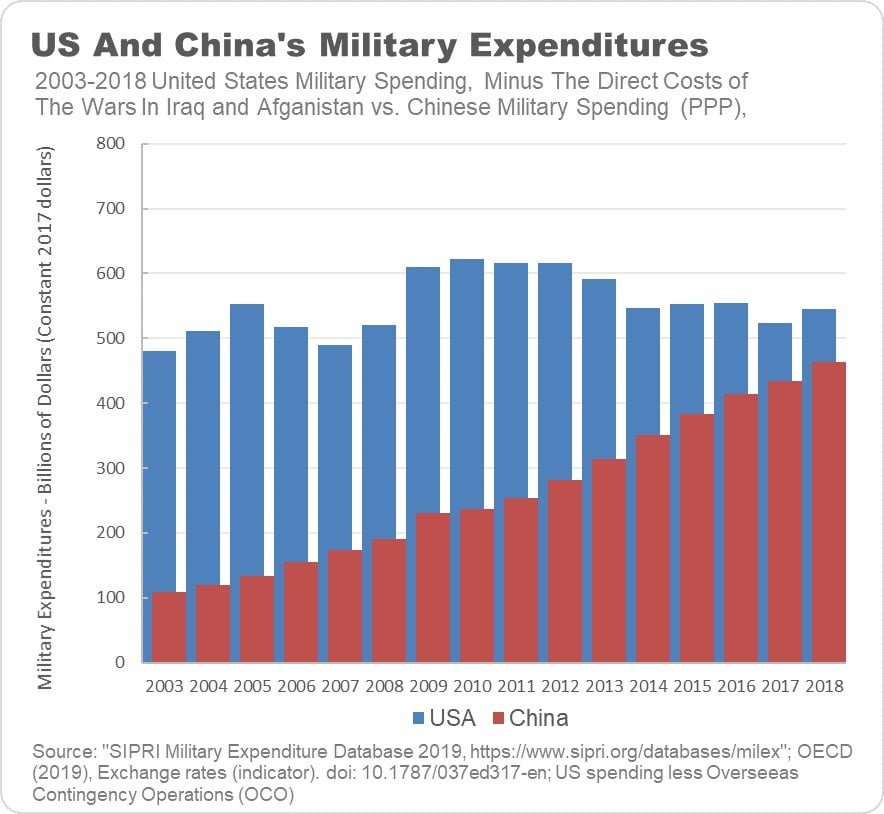
How it feels when your tax money is used to build up your own country rather than fighting foreign wars.
English

@plinian_put @Laz_Kozmonot @petergyang Yet there are more Shanghaiers moving to New York than New Yorkers moving to Shanghai.
English
Some initial observations about Shanghai after not being back for 10 years:
1. The city is incredibly modern - more so than New York and even Tokyo. It's funny riding modern subways and trains here and reading about how California has to shut down the BART/Caltrain due to budget cuts on X.
2. Apps run everything - Wechat, Amap (Google Maps), Dianping (Yelp), Alipay, etc. Basically, there's a Chinese equivalent of every US app and more.
3. Meals are probably 1/3 the price of the US and absolutely delicious. There's ALOT of variety in Chinese regional cuisines. Funny enough almost every restaurant has a Dianping coupon you can use to get free desserts. I like my spicy food :)
4. Fewer foreigners than I expected and concentrated in a few areas. Coming from the US, it's just a pain to have to get a visa, set up eSim, download all the apps, etc. You have to do alot of research before coming here.
5. The overhead highways kind of ruin the vibe a little with the cityscape.
6. People still smoke alot, but appears to be mostly older generation.
7. Speaking of the old generation, they know to have fun. Went to Fuxing park and many elders dancing, playing yoyo, singing, and more.
8. In contrast, from what I hear, the younger generation is working super hard and many college grads cannot find jobs are are "tang ping" (lie flat).
It's great to be back, will share more later.


English


I also enjoy living here but lets take it easy while comparing to Tokyo/NY etc
There is a reason 10mio Chinese were traveling to Japan for holidays every year
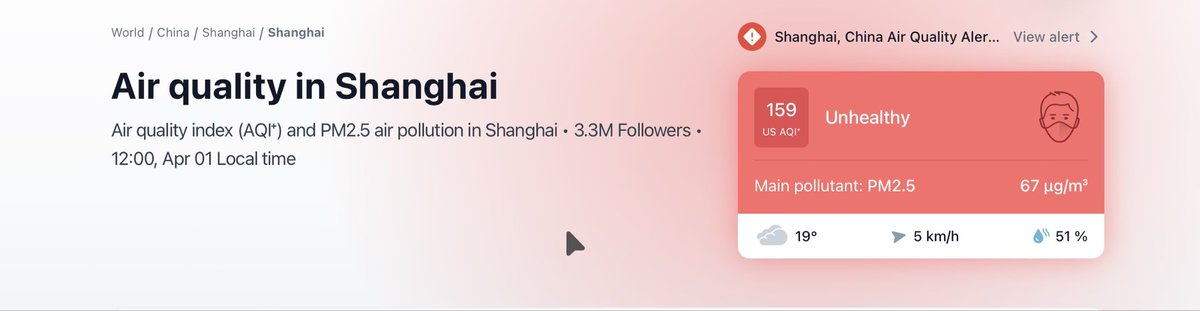
Below is the air quality now
Its quite common due to coal lead energy to have this kind of shitty air influencing your health overall during your lifetime, reduce your immunity.
I never had as many sicknesses as i have lived in Shanghai in my life.
Again i like living here but lets not be delusional.
English

Wouldn't be surprised AT ALL if China is funding the anti-AI movement in the US.
English