Protrader 365

3K posts

Protrader 365 banner
Protrader 365

Protrader 365

@protrader_365

Welcome to ProTraders365, where profit never takes a day off!💲 Make money with us? 🤑 Check out my TradingView account🔽

Earth Katılım Mayıs 2021
40 Takip Edilen1.6K Takipçiler
Protrader 365
Protrader 365@protrader_365·
Gold Near PRZ — Is Another Drop Loading? solana:GoLDppdjB1vDTPSGxyMJFqdnj134yH6Prg9eqsGDiw6A testing resistance zone $4,546–$4,590 + PRZ $4,537–$4,560 + key level $4,550 Elliott upward corrective wave completing → expect attack on support Target 1: $4,503 Target 2: $4,473 SL: $4,566 (worst) Support zone $4,454–$4,501 watch (possible breakout) Full charts & exact levels → @tradingview 👇 tradingview.com/chart/XAUUSD/2… #XAUUSD #GOLD #Commodities
English
0
0
2
54
Protrader 365
Protrader 365@protrader_365·
S&P 500 Lost the Ascending Channel _ Is a Bigger Drop Next? SPX hit full targets → now rejecting resistance $7,435–$7,464 after breaking ascending channel Classical: Head & Shoulders forming Elliott: more corrective waves expected Break $7,400 → Target 1: $7,351 Target 2: $7,303 SL: $7,473 Middle East escalation risk = sudden drop in fuel Full charts & exact levels → @tradingview 👇 tradingview.com/chart/SPX500US… #SP500 #stockmaket #SPX
English
0
0
3
54
Protrader 365
Protrader 365@protrader_365·
Bitcoin Update — Resistance Test in Play? bitcoin:native stuck in $76K–$77.8K range, heavily tied to S&P 500 + solana:GoLDppdjB1vDTPSGxyMJFqdnj134yH6Prg9eqsGDiw6A + Middle East news (Iran-US-Israel) Now testing resistance $77.62K–$78.21K + PRZ $77.62K–$78K + short liqs $77.9K–$78.54K Expect break of lower ascending channel + $76.8K level → drop to short liqs $75.46K–$76.1K Join Our Telegram for More Updates & Live Alerts! 👇 t.me/ProTrader_365 #IranWar#USA #Israël
Protrader 365 tweet media
English
0
0
3
48
Protrader 365
Protrader 365@protrader_365·
U.S. 10-Year Government Bond Yield(US10Y) update ✅Full Target Done✅ 💡One of the reasons for the decline in solana:GoLDppdjB1vDTPSGxyMJFqdnj134yH6Prg9eqsGDiw6A and silver prices, US stock market indices, and the crypto market, especially bitcoin:native, was the increase in the U.S. 10-Year Government Bond Yield. 🚨I warned about this on Apr 21👇 tradingview.com/chart/US10Y/73… #bonds #Gold #stockmarket
Protrader 365 tweet media
Protrader 365@protrader_365

US10Y Is Waking Up — Major Markets Could Feel It! US10Y testing support 4.10%–4.24% + Weekly 100_SMA Bullish Pennant + Elliott Wave 4 complete → falling wedge upper line break = new impulsive upside Target 1: 4.43% Target 2: Resistance zone 4.50%–4.64% SL: 4.15% Rising yields = pressure on: ⚪️Bitcoin & Crypto ⚪️Gold ⚪️U.S. Stocks (especially growth/tech) Full daily charts & exact levels → @tradingview 👇 tradingview.com/chart/US10Y/73… #US10Y #DXY #Bitcoin #Gold #Stocks #Yields

English
0
0
1
104
Protrader 365
Protrader 365@protrader_365·
🚨 Trump: “I delayed the attack on Iran that was scheduled for tomorrow.” Right now, the market is heavily reacting to war-related headlines involving Iran, the U.S., and Israel. Geopolitical tensions across the Middle East are becoming a major catalyst for volatility in crypto and global financial markets. Trade carefully — news is driving momentum. Stay Connected on Telegram!👇 t.me/ProTrader_365 #Trump #USA #IranWar#Israël
English
1
1
3
127
Protrader 365
Protrader 365@protrader_365·
🚨 Attention Traders! 🚨 The White House has reportedly rejected Iran’s latest proposal submitted today, calling it “insufficient.” Tensions are escalating once again, and the market could face another wave of panic-driven volatility. Traders should stay alert as the possibility of renewed military confrontation between Iran, the U.S., and Israel — and wider conflict across the Middle East — remains on the table. #Iran #Israel #USA #MiddleEast
English
0
0
1
104
Protrader 365
Protrader 365@protrader_365·
Bitcoin Near Heavy Support — Is a Relief Bounce Coming? bitcoin:native testing $72.76K–$76K heavy support + long liqs $74.3K–$75.38K + 50_SMA(Daily) Elliott downward waves are still in play, but strong support likely causes short-term upward correction SPX near support = correlation boost possible Target 1: $76,790 Target 2: $77,740 SL: $73,723 (worst) Short liqs $78.2K–$78.77K watch Full charts & exact levels → @tradingview👇 tradingview.com/chart/BTCUSDT/… #BTCUSDT #CryptoDaily #SPX500
English
0
1
1
87
Protrader 365
Protrader 365@protrader_365·
EURUSD Breakdown in Play — Is More Downside Coming? EURUSD broke $1.1643–$1.1684 support zone → now pulling back to it DXY bullish trend = extra pressure on EURUSD Elliott: downward corrective waves expected Expect drop → Target 1: Support lines Target 2: $1.1540 Heavy support zone $1.1390–$1.1572 watch SL: $1.1696 (worst) Full 4H charts & exact levels → @tradingview👇 tradingview.com/chart/EURUSD/5… #EURUSD #DXY #forex #forextrading
English
0
0
1
337
Protrader 365
Protrader 365@protrader_365·
Gold Back at Heavy Support — Will It Hold This Time? 
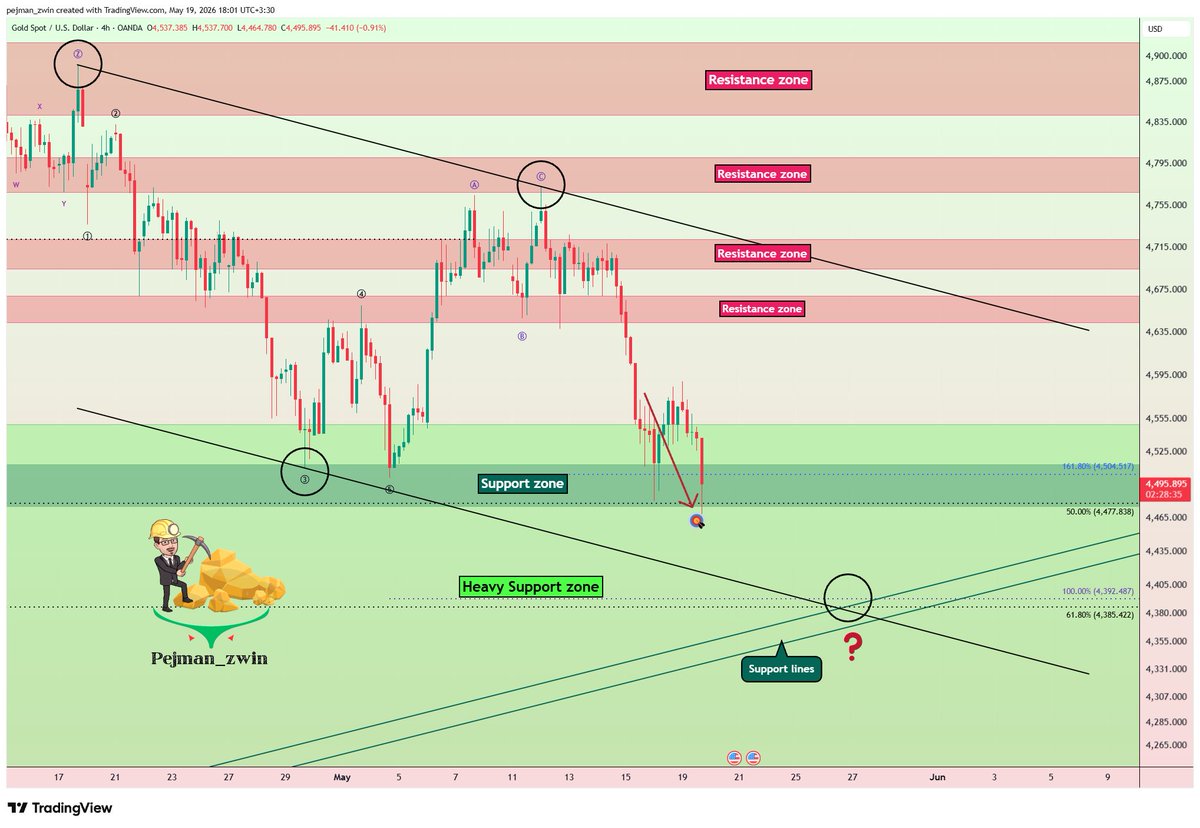
solana:GoLDppdjB1vDTPSGxyMJFqdnj134yH6Prg9eqsGDiw6A reached all downside targets as expected → now back inside heavy support $4,234–$4,551 + $4,475–$4,513 zone Elliott Wave: downward waves still in progress DXY & US10Y bullish = extra pressure on gold Expect drop → Target 1: $4,486 Target 2: $4,416 SL: $4,625 (worst) Can gold hold above $4,000 or further declines coming? Full charts & exact levels → @tradingview👇 tradingview.com/chart/XAUUSD/b… #XAUUSD #signal #Commodities
English
0
0
1
293
Protrader 365
Protrader 365@protrader_365·
Bitcoin Is Losing Support _ And Macro Pressure Is Building bitcoin:native failed to retest 200_SMA(Daily) → now breaking support $79.48K–$79.75K + lower descending channel Elliott: more corrective downward waves expected DXY bullish + SPX correlation + US10Y rising = extra bearish pressure Expect CME gap fill $78.22K–$78.545K → PRZ $76.26K–$77.1K Target: PRZ $76.26K–$77.1K SL: $80,900 Back above $80K or deeper correction? Full charts & exact levels → @tradingview 👇 tradingview.com/chart/BTCUSDT/… #Bitcoin #btcusdt #CryptoSignals
English
0
0
1
135
Protrader 365
Protrader 365@protrader_365·
S&P 500’s Rally Is Showing Its First Real Crack SPX +5% run inside ascending channel → now breaking lower line near resistance $7,435–$7,464 Elliott Wave 5 complete → bearish continuation expected DXY & US10Y rising = extra downside pressure Target 1: $7,399 Target 2: $7,354 SL: $7,487 Middle East escalation risk = sudden drop fin uel Full charts & exact levels → @tradingview👇 tradingview.com/chart/SPX500US… #SPX #SP500 #SPX500 #StockTrading
English
0
0
1
370
Protrader 365
Protrader 365@protrader_365·
bitcoin:native Still Looks Bearish After touching the $80,000 level, Bitcoin could still move lower from here. At the same time, the S&P 500 appears to be losing its ascending channel structure, which may signal weakness in the broader market. The U.S. Dollar Index(DXY) is also likely to continue its upward trend, while the U.S. 10-Year Treasury Yield remains bullish as well. Overall, the macro conditions still suggest a bearish outlook for Bitcoin. Join Our Telegram for More Updates!👇 t.me/ProTrader_365 #sp500 #dxy #dxyindex
English
0
0
1
142
Protrader 365
Protrader 365@protrader_365·
Dollar Index(DXY) Just Broke Out — Major Markets Could Feel It DXY successfully broke resistance lines on 4H Classic Double Bottom + neckline break + positive Regular Divergence (RD+) on lows → strong bullish continuation signal Pullback to broken resistance/neckline likely → then push higher Target zone: $99.95–$100.65 Full 4H charts & exact levels → @tradingview tradingview.com/chart/DXY/V1eK… #DXY #Dollar #forex #dxyindex
English
0
0
1
65