Sabitlenmiş Tweet

Reminder to all those who have followed me or found my commentary and analysis useful through the years - the best place to find me now is in the Blue Sky, at bsky.app/profile/quator…
English
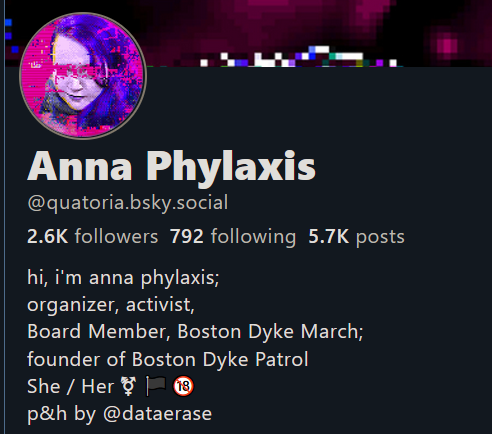
anna phylaxis @quatoria.bsky.social
224.6K posts

@quatoria
hi, i'm anna phylaxis; organizer, activist, founder of BDM Dyke Patrol She / They ⚧ 🏴🔞 p&h by @dataerase


WATCH: protest underway at the University of Oklahoma rallying in support of the instructor who was put on leave after giving a student a zero on a psychology paper. @OKCFOX


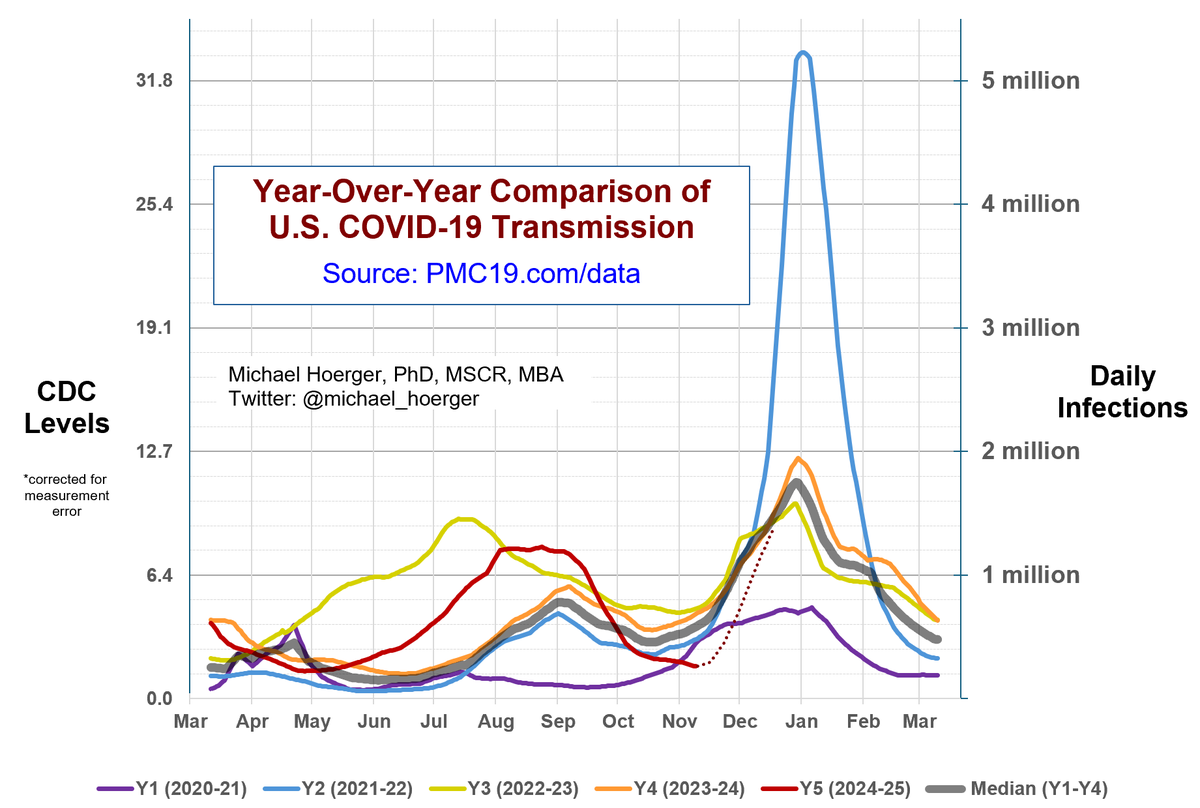
Canadian COVID Forecast: Nov 23-Dec 6, 2024 SEVERE: CAN, AB, BC, MB, NB, NL, North, NS, ON, PEI, QC, SK VERY HIGH: none HIGH: none MODERATE: none About 1 in 43 people in Canada are CURRENTLY infected.


Graham: So to any ally, Canada, Britain, Germany, France, if you try to help the ICC, we're going to sanction you.

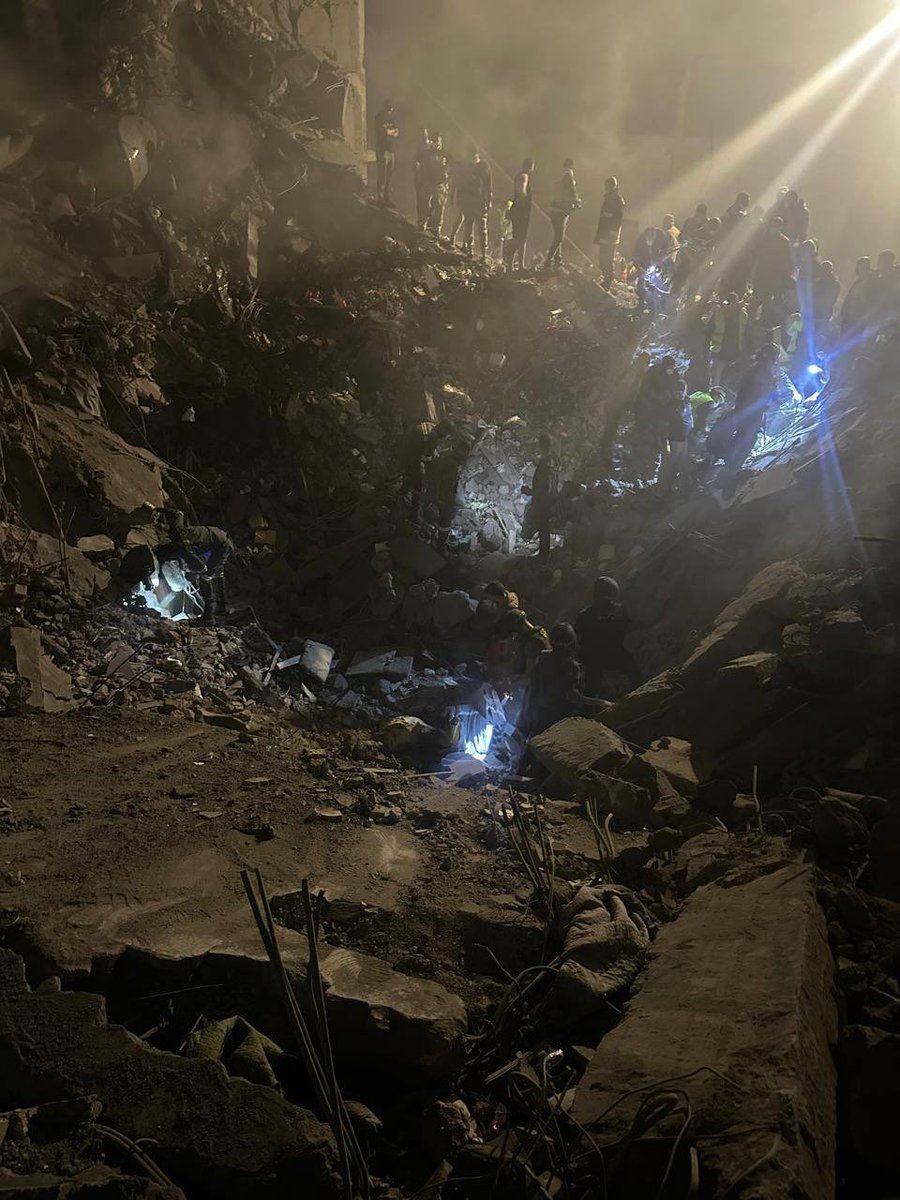
Israel killed 5 paramedics in Lebanon today, along with a hospital director. In just 52 days, Israel has killed over 215 Lebanese paramedics. If this were happening in Ukraine, it would dominate headlines across mainstream media. But because it’s Lebanon, not a single peep.


Vaccines have saved 154 million lives & 9 BILLION LIFE YEARS in the last 50 years alone. Someone tell RFK Jr.