Mauricio Rojas
1.2K posts


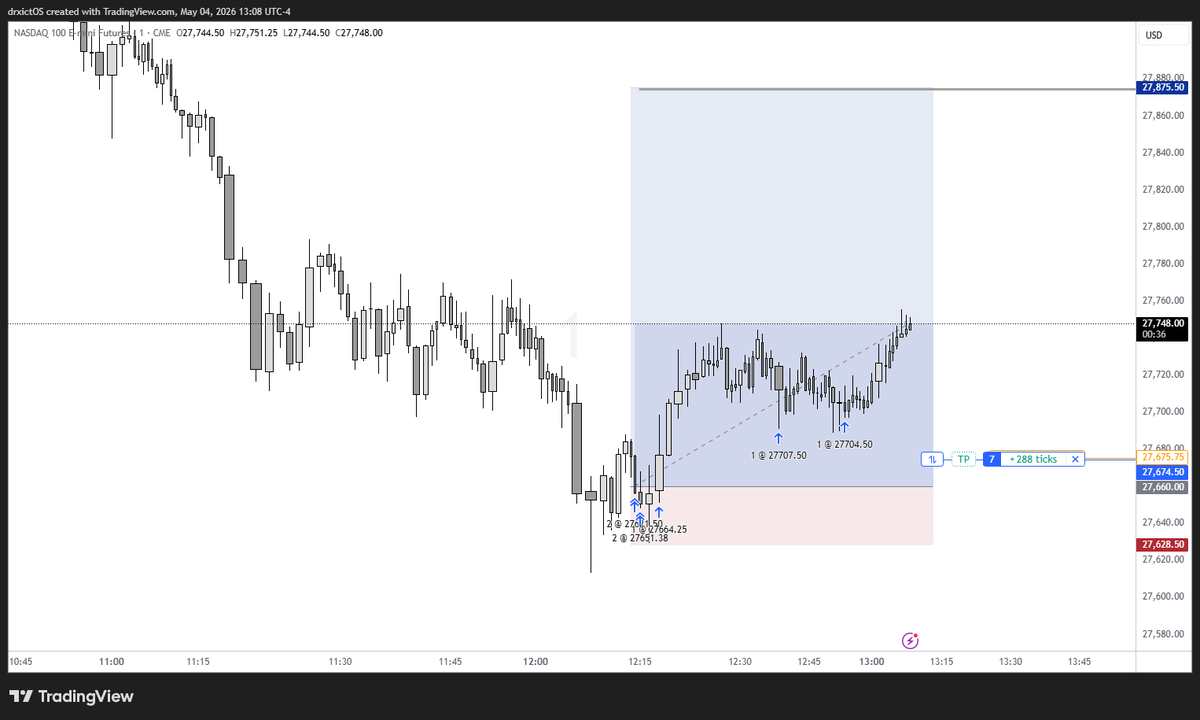
Market just refuses to take its medicine.
Spot up vol up in this range now- tread carefully!
English
@DonMiami3 Whoever follows you in your bearish thesis got smocked, and if they still follow your advise they are delusional
English

Very thankful to all of the people I’ve been able to meet through the X platform… a one of kind community on ‘Fintwit’ & 3 years ago I was sitting in an office wondering if it was going to look like a blank white piece of paper until retirement
Don’t be afraid to take a risk…!
English
@traderhc NVDA ER elephant in the room. With the China deal, game changer. FOMC min none event, NVDA is. Will gap fill.
English

Three hot prints in three days and the "stocks don't care about yields" narrative just died at 48 hours old.
Tuesday's 3x PPI beat? Market shrugged, $SPY closed green near all-time highs. Today Empire State doubles estimates and Industrial Production prints more than double consensus. Market pukes.
The 10Y moved 12 basis points on a regional manufacturing survey. Not CPI. Not payrolls. A regional survey.
That's the bond market telling you it's done giving equities a free pass on hot data.
The 30Y sitting above 5.10% is where things get uncomfortable. The 2s10s spread went from 53bps Tuesday to 60bps today. Bear steepener. The one configuration that grinds risk assets down without giving you recession cover to expect cuts.
TLT down 1.37% while gold drops nearly 3%. This isn't a fear event. It's a real yield repricing. Everything correlating to a single variable: rate cuts are dead for now.
I think FOMC Minutes on Wednesday become the week's landmine. If there's any hawkish lean in those transcripts, the 10Y pushes toward 4.65% and equities have another leg down before anyone buys this dip.
Is this the dip you buy, or the one where "buying every dip" finally stops working?
English
@I_Am_The_ICT Thoughts on @VolSignals idea that SPX options flow drives overall market direction?
Video explains buying/selling pressure from a market maker perspective youtube.com/watch?v=WiQorx…
Do you see SPX options as the 1st driver, or just one piece of the liquidity puzzle?
YouTube
English
@traderhc Not bearish at all. Too much liquidity to take above.
English
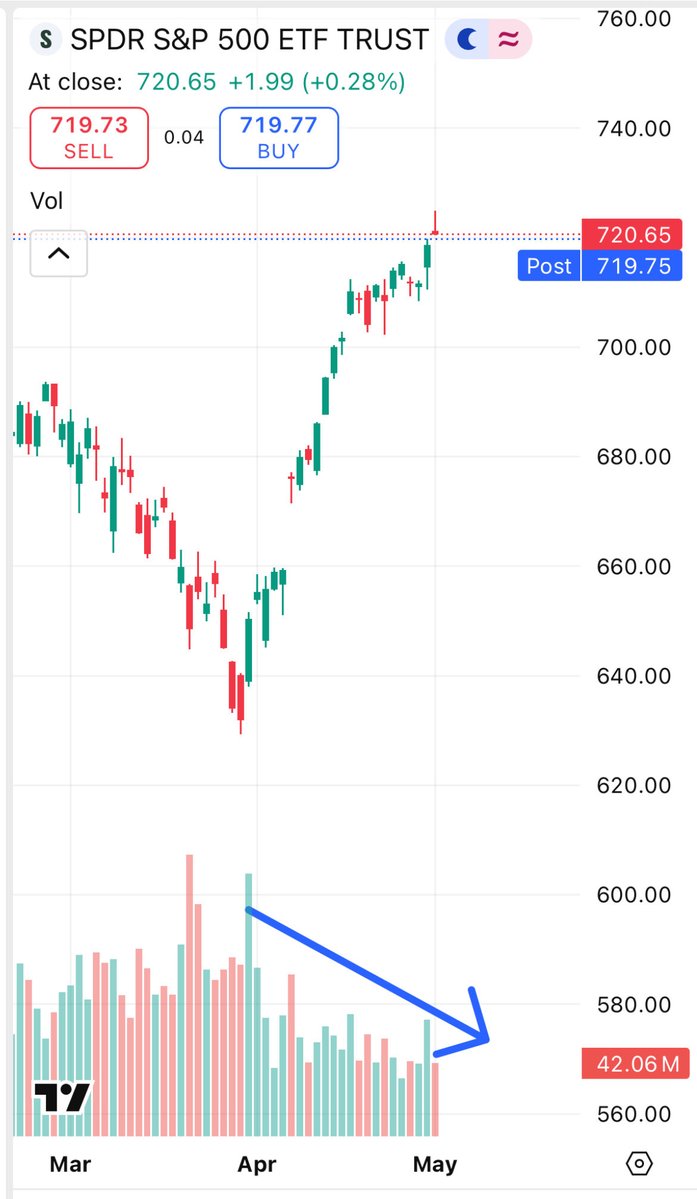
$QQQ pinned right at the 720 call wall with dealers still long gamma. That's your invisible floor . and your ceiling too until Friday's unpin.
The tell isn't tomorrow's print, it's Monday. Once that gamma rolls off, SPY/VIX correlation at -0.37 (vs -0.91 normal) is the anomaly that finally resolves. Which way you leaning post-OpEx?
English
OpEx tomorrow is the most important non-event in the market right now.
Dealer gamma hedging has been the invisible floor under equities all week. That mechanical bid vanishes Friday afternoon.
$QQQ at 719 on positioning flows, not fundamentals. Claims missed estimates today. Bonds rallied with stocks. Classic squeeze behavior.
VIX term structure in 16.6% contango tells you the options market already prices more turbulence ahead. Not less.
I think we see a fade back toward last week's levels by Wednesday. FOMC Minutes land into a market that just lost its training wheels.
The risk management window is today. Not Monday morning after the floor's already gone.
Anyone else positioning for the post-expiry unwind or is everyone just riding the gamma?
English
Tomorrow we get a final crash out about Powell not reducing rates to zero as inflation roars… should’ve hiked at the last meeting
English

🚨 Netanyahu and President Trump have a meeting scheduled tonight.
Last time Netanyahu visited Trump on Mon Dec 29, 2025, the Venezuela invasion began 1:30am Sat Jan 3, 2026
Financelot@FinanceLancelot
WATCH: Netanyahu says the war with Iran is "not over."
English
@pivot_to_ai @alifarhat79 100% agree, this bitch delusional to think we are tanking
English

@RealNickMugalli @jam_croissant Cry me a river. Blue collar funds with no SL will get destroyed by Trump administration. They got induced to short and got played big time
English

Peak concentration of every major bubble in history.
The AI Big 10 just hit 40%. The line is still rising. Peak theme concentration at bubble top:
- Railroads (1880s) — 63% of US stock market
- Nifty Fifty (1972) — 40% of S&P 500
- Japan (1989) — 44% of MSCI ACWI
- Tech/Telecom (2000) — 41% of S&P 500
- AI Big 10 (2026) — 40% of S&P 500 still rising…
The prior four didn't end because the businesses were bad. Railroads were the internet of their era.
Cisco and Intel had real earnings.
Japan had genuinely excellent industrials.
They ended because concentration itself is the risk.
At 40%+ of a benchmark, every institutional portfolio is overweight by construction.
Rebalancing becomes one directional.
Momentum becomes crowding. Crowding becomes fragility.
The trigger doesn't need to be fundamental — it just needs to be big enough to force systematic derisking.
Then the unwind feeds itself.
AI is real. The question is whether $800B+ capex, 40% concentration, and P/E above 28× are compatible with anything other than perfect execution from every company in the cohort for the next three to five years.
One $NVDA miss. One capex revision. One rate shock.
That's not a rotation. That's a market event.
Nifty Fifty peaked at 40% in 1972. S&P fell 48% over the next two years.
Not because the companies failed. Because the concentration did…

Nicholas Mugalli@RealNickMugalli
JPMorgan, MUFG, SMBC, and Morgan Stanley are actively shopping ways to offload data center construction debt. They have spent more than six months trying to distribute $38 billion of construction loans tied to a single Oracle leased project across Texas and Wisconsin. Some banks have already sold portions to nonbank lenders — at a discount. JPMorgan does not spend six months shopping $38 billion in construction debt unless internal risk limits are getting hit. The only way to keep originating new loans into the AI buildout is to make room first. Selling at a discount is not a negotiating posture. It is a signal that the balance sheet constraint is real and the queue of new deals behind this one is long. The structures being explored are what should be getting attention. A traditional significant risk transfer spreads exposure across dozens of loans so no single default sinks the trade. What is being shopped now is a modified single-borrower SRT — investors taking the riskiest tranche of one concentrated loan, to one operator, backed by one or two anchor tenants, carrying full construction risk. Deals in the $500M range, backed by a single name, already in market. That structure is not the diversified portfolio transfer Europeans have used for years. It is closer to the bespoke single name credit instruments that were being layered through the system in 2005 and 2006 — before anyone had stress-tested what concentration looked like when the underlying cycle turned. The cycle risk here is specific. These projects are underwritten on the assumption that frontier model spending continues indefinitely, that hyperscaler tenants honor long term leases, and that construction timelines in secondary markets hold. Maine passed a statewide data center moratorium in April, adding regulatory risk to projects that already carry construction and concentration risk. The question is not whether any of these projects default today. It is what the recovery looks like on a half built data center in a secondary market when the AI capex cycle decelerates and the anchor tenant's own model economics have changed. The banks are doing exactly what rational risk managers should do. They are identifying concentration, seeking to distribute it, and repricing where necessary. The fact that they need to is the signal. When the institutions leading the financing of the largest infrastructure buildout in a generation start choking on deal size nine months in, that is not a footnote in the credit markets. It is the leading indicator actually. Is this the beginning of AI credit stress — or just normal risk management at the edge of a supercycle??
English
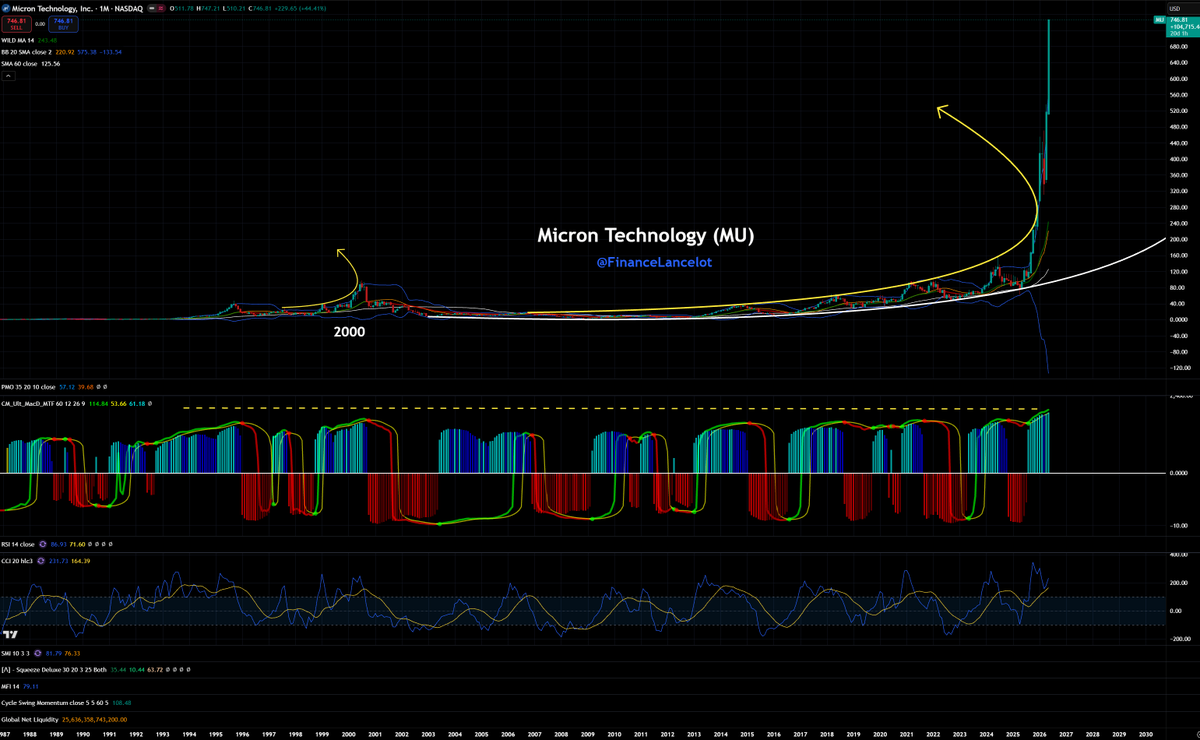
Memory manufacturers like $MU are likely in their final run right now.
The MACD indicator is at an extreme level, never seen before not even in the 2000 dot-com bubble.
The CCI bounced at level 160, which is also something we've never seen before either.
English

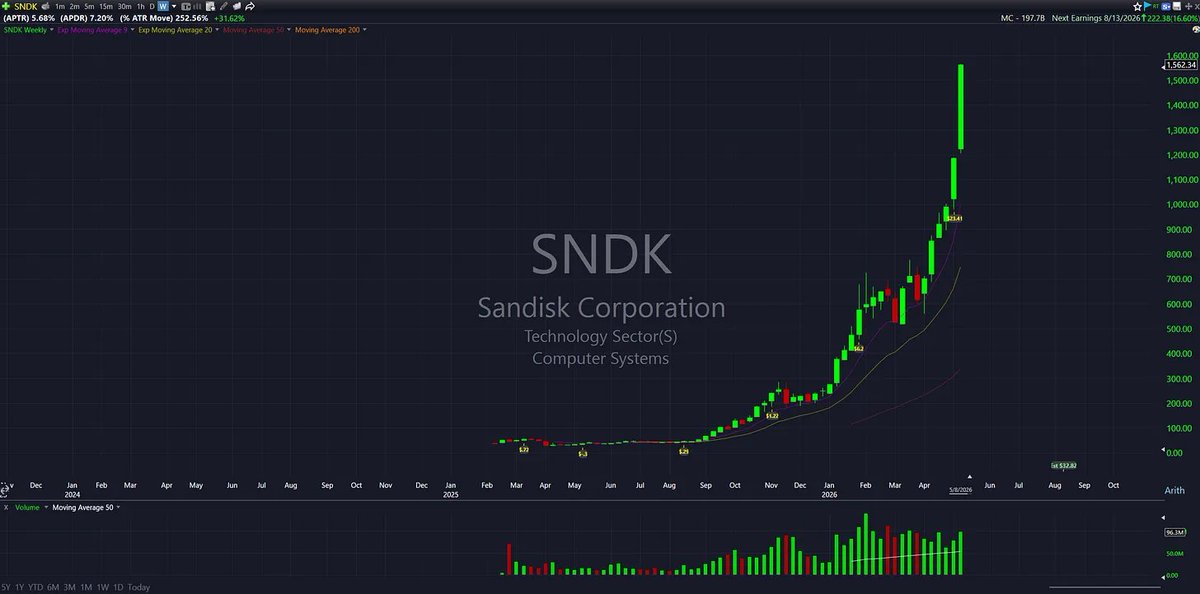
The window of opportunity is open this week for parabolic reversals in $SNDK $MU and solana:JCEmtMhYCuijq6t3bXbZeyr4566RYmsLaSdr6pYd79Rt
Let's see if this post is more hated than the parabolic short write-up I did on Silver in late January....
Jokes aside, I wanted to share my thoughts as I have during parabolic moves over the years with stuff like $SMCI $NVDA $MSTR $SLV $GLD $KORU $CAR etc, especially if I can help someone who is riding a large unrealized gain take advantage and trim into these parabolic extensions.
Early last week, I shared a screenshot of a spreadsheet I had saved from a study I did on the specific extension metrics in which many historic parabolic moves peaked. I also noted that it was too early to short the semiconductors as that they had not filled out the criteria required for a parabolic short.
Below is the same spreadsheet, but included is $SNDK $MU and solana:JCEmtMhYCuijq6t3bXbZeyr4566RYmsLaSdr6pYd79Rt updated with their extensions as of Friday's close. The green highlighted boxes represent above the average in which all the study examples peaked at.
As you can see they are not all quite above average yet, but any continued hype and momentum early this week and all three of these names will very likely be in play.
One characteristic that is extremely important when identifying a parabolic advance is consecutive weeks of range expansion. We recently saw this with Silver in January when it put together 3 consecutive weeks of range expansion before it's climax, as well as many more classic, model book examples throughout the years.
Consecutive weeks of range expansion signal exponential price progression, a hallmark of parabolic curves. It is a week by week build up into a climactic reversal. The cherry on top is a signifigant range expansion week on the 3rd or 4th week of the burst, which is typically the final week of the move.
Here are the last 3-4 weeks of percentage gains for these names:
$SNDK
Week 1 (+7.48%)
Week 2 (+19.91%)
Week 3 (+31.62%)
$MU
Week 1 (+8.20%)
Week 2 (+9.15%)
Week 3 (+9.16%)
Week 4 (+37.73%)
solana:JCEmtMhYCuijq6t3bXbZeyr4566RYmsLaSdr6pYd79Rt
Week 1 (+9.81%)
Week 2 (+20.50%)
Week 3 (+20.69%)
Week 4 (+25.40%)
Textbook parabolic price progression over consecutive weeks on all three of them.
After that final 3rd or 4th week of signifigant range expansion, you then look for a similar parabolic burst on the daily timeframe. $SNDK $MU and solana:JCEmtMhYCuijq6t3bXbZeyr4566RYmsLaSdr6pYd79Rt all closed down on Thursday, before exploding higher on Friday. Need at least 1-2 more large, consecutive days higher for these to trigger a climactic reversal.
We also witnessed what felt like complete upside panic and FOMO in the leading semiconductors on Friday. One example being the news that hit at 1pm stating that Apple and Intel reached a preliminary chip-making agreement, which led to a near +13% gain in just 20 minutes...
Moments after that headline, Trump said "Go and buy a Dell", which sent $DELL soaring an entire 200% ATR move in just 30 minutes.
This is typically the type of price action and hype you see during the final stage of a parabolic burst. Not to mention the absurd volume of options being traded on these names as we approach May OPEX this Friday...
To close this out, we also have the $QQQ at 9.91 ATR multiples above the 50-day moving average as of Fridays close, a level of extension never before seen since its inception in March of 1999. I have no doubt this market can continue higher this year, but this print only helps add conviction to the names potentially setting up for a opportunity into this week.
To clarify, the parabolic short is an extraordinarily high-probability mean reversion opportunity, that can sometimes lead to secular tops, but not always. I have no clue where these stocks will be a month or a year from now, but I know my setups when I see them.


English

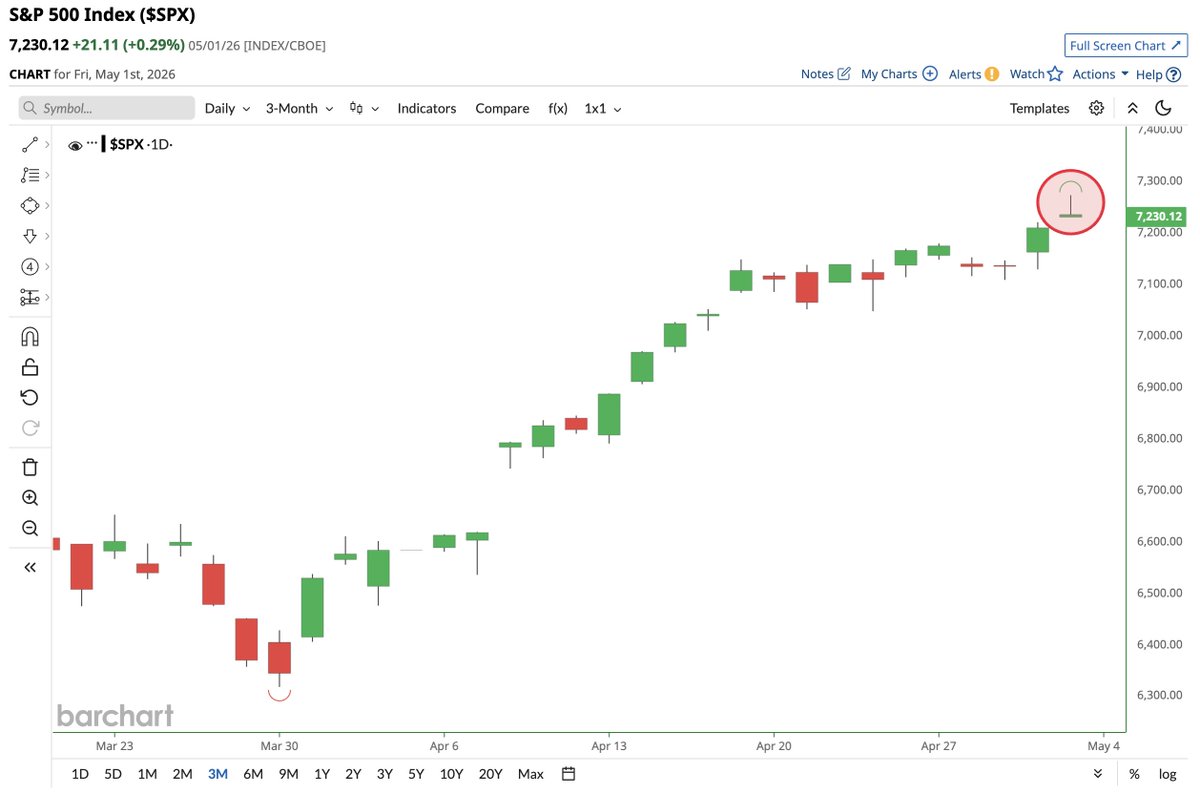
Look, I know none of this stuff matters anymore. But my G*d.
This will be the 4th time the S&P 500 $SPY has hit a record high while 5% of its members fall to 52-week lows.
1. July 1929
2. January 1973
3. December 1999
4. Today

English


TRUMP, ASKED ABOUT RESTARTING STRIKES: THERE IS A POSSIBILITY THAT COULD HAPPEN
English