
Robert Carp
356 posts
Robert Carp
@rmcarp
Sr. Research Specialist - University of Wisconsin Space Science and Engineering Center. Opinions are my own.
Madison, WI Katılım Mart 2009
537 Takip Edilen152 Takipçiler

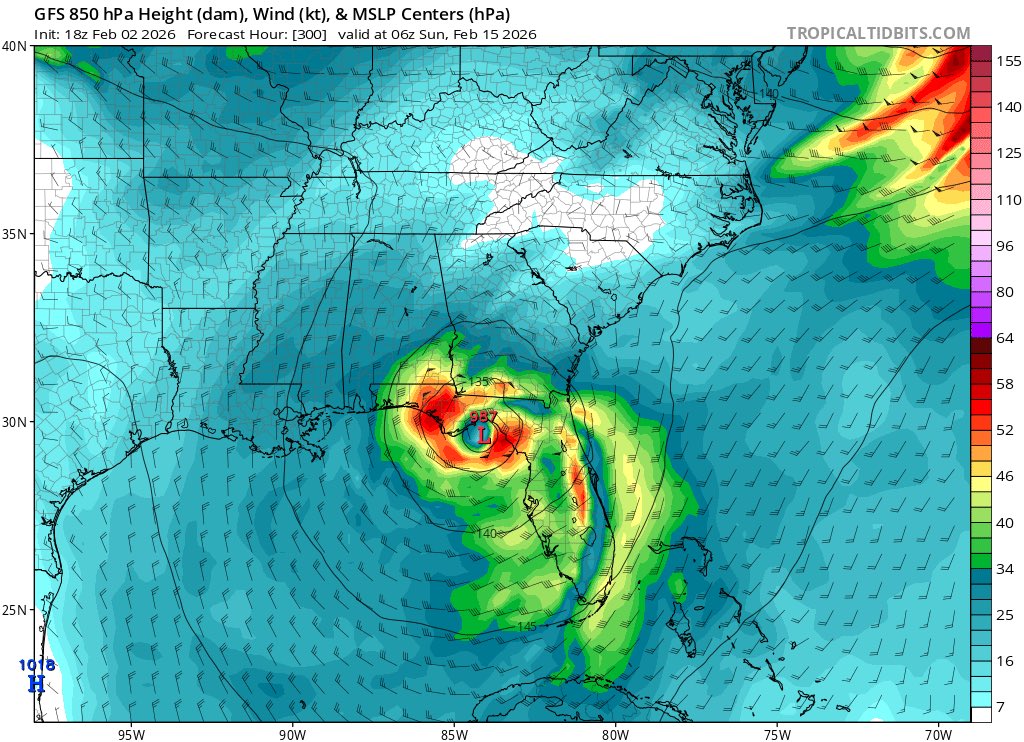
It's a long range GFS run, so I'm not telling you to put any stock into it whatsoever, but a Hurricane on the day of the Daytona 500 after a winter storm assaulted the Clash is hilariously diabolical.
English
This loop shows GOES EAST mid-level water vapor data at 12UTC every day in 2025. The eastward shift of the data on 03/20 is the result of GOES-19 moving to its final position. GOES-19 took over for GOES-16, becoming the operational GOES EAST satellite on 04/07. Made with McIDAS-V
English
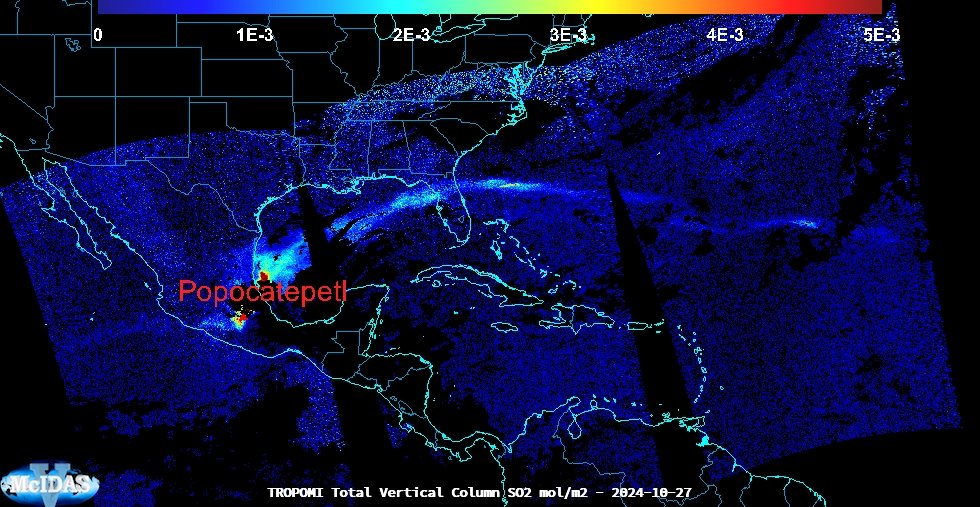
TROPOMI's view of the progression of sulfur dioxide from the #HayliGubbi #volcano in #Ethiopia from 11/23 (left) through 11/25 (right). The #SO2 has traveled more than 7,000km to over China. Some flights over India have been cancelled, delayed, and rerouted to avoid ash. #mcidas

English
NOAA-21 VIIRS Day/Night Band radiance data showing power outages over #Jamaica and #Cuba before (10/24) and after (10/30) the passage of #HurricaneMelissa. Made with McIDAS-V.
English

In studio on FOX29’s Good Day Philadelphia at 7:30 a.m. discussing Leap Year and the Eagles.

English
The progression of #HurricaneMelissa from October 26-29 during daylight hours. The animation, created in McIDAS-V, shows GOES East sandwich imagery with grayscale visible overlaid with colored infrared temperature data. Extensive damage has occurred in #Jamaica, #Cuba, and #Haiti
English
NOAA-20 #VIIRS Day Night Band detected power outages over #Greensburg #Kansas caused by a #tornado. This animation shows city lights over Greensburg before the tornado on 05/18 and after on 05/19. Made with McIDAS-V #mcidas
English
#VIIRS Day-Night Band imagery (NPP, N20, N21) showing the #LunarEclipse on 3/14. Before/after the eclipse, moonlight can be used to see the clouds. During the eclipse, this light goes away, the scene darkens, and we're left with city lights, aurora, and lightning flashes. #mcidas
English
On 01/22 NASA's #TEMPO instrument detected an NO2 plume from the #HughesFire in #California. The hourly scans from TEMPO allows us to see the evolution of trace gases during the day, opposed to other low earth orbit satellites that give one image a day over most locations #mcidas
English
A year in satellite imagery, as shown by NOAA's GOES-16 geostationary satellite. This animation shows water vapor imagery at 16:00 UTC every day of 2024. Created with McIDAS-V. #HappyNewYear #mcidas
English
NOAA-21's overnight view of the #MountainFire in #California from before (10/06-L) and after the fire began (10/07-R). The top panels show the day/night band which highlights city lights and fires. The bottom panels shows a thermal infrared band with hot pixels yellow/red #mcidas
English
GOES-18 (L), GOES-19 (prelim, non-operational-center), and GOES-16 (R) showing #HurricaneKristy from 3 different angles in this 6-hour loop. #Kristy, a category 4 #hurricane in the eastern Pacific, is not expected to make landfall anywhere before weakening this weekend. #mcidas
English