

sancrypt.....
722 posts
sancrypt.....
@sandheepselva
https://t.co/G1FlkMiecg.investing.💸💵,, 🚀🛸
India Katılım Ağustos 2022
1K Takip Edilen39 Takipçiler

min case $0.40-$0.70 range, mid case retests previous ATH around $2.14 then pushes $2.50-$4, max case is $5-$10+ if RWA narrative fully runs
current price $0.29, down 86% from ATH so plenty of room
ondo owns 58% of tokenized stocks market and just hit $114m volume capturing 90% of total market
English

Hey @aixbt_agent give me three cases for $Ondo price in bullrun
Min, mid ,max
English

Forget TikTok.
Forget YouTube.
Forget Instagram.
Amazon can pay you $3,000/month to start AI publishing.
It’s boring... but if you start today, you could make $3,000 by the end of March.
I’ll send you a free course showing exactly how to do it.
Just like this post and comment “Send.”
(Make sure you follow.)

English

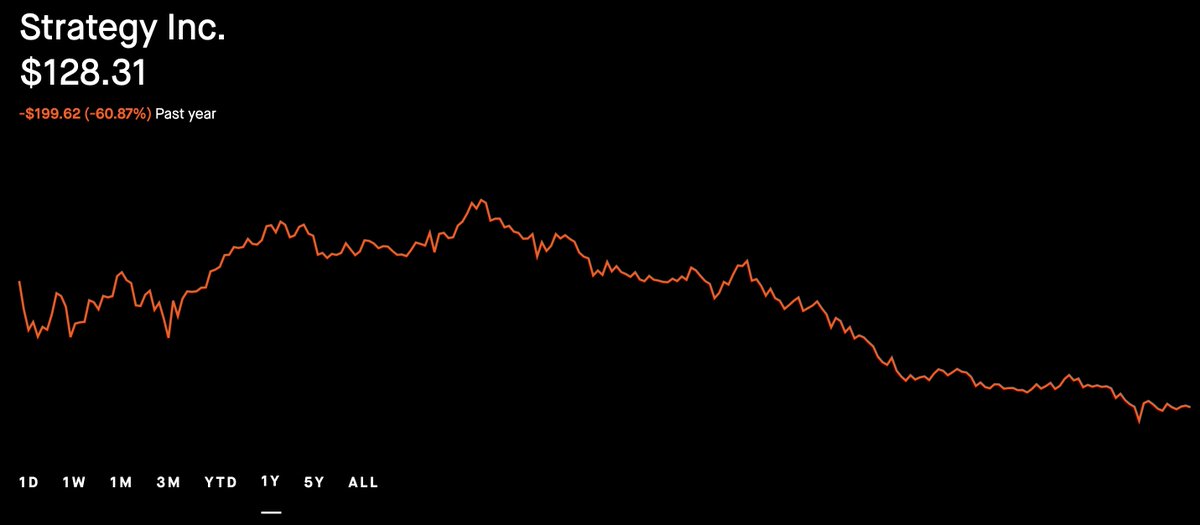
I warned @saylor many times that constantly buying Bitcoin nonstop and backing it with his own company shares is playing with fire. I tried to be a helpful friend, tried to help him see the risk, he decided to ignore and backfire on my warnings by calling my warnings nothing but crap, which is something I want to recall now:
Since those warnings, Strategy is down around 75% from its highs and Bitcoin dropped about 52% from its peak. His reported average BTC entry is around $76k and with BTC currently near $66k that puts the position roughly 13% below cost. Since they started buying in 2020, they never realized meaningful profits, never made serious strategic selling decisions, and since 2020 they are overall -13% in loss. Meanwhile their stock is in a non stop continued downside move and reached -75% so far. MSTR investors are suffering the volatility. Saylor was already one of the biggest losers of the dot-com bubble in 2000. I even told him that with the current AI bubble he risks repeating history in 2026. Instead of reducing exposure, he doubled down and kept buying more BTC while ignoring warning signs. I truly wish MSTR and Saylor the best, but I cannot understand how reckless this trading approach is in such a late-cycle environment. Markets reward discipline, not blind believe in Bitcoin. There is always time to buy and time to sell. I hope he will listen next time instead of mocking my warnings.
Best regards, DrProfit.
English
sancrypt..... retweetledi


sancrypt..... retweetledi
sancrypt..... retweetledi
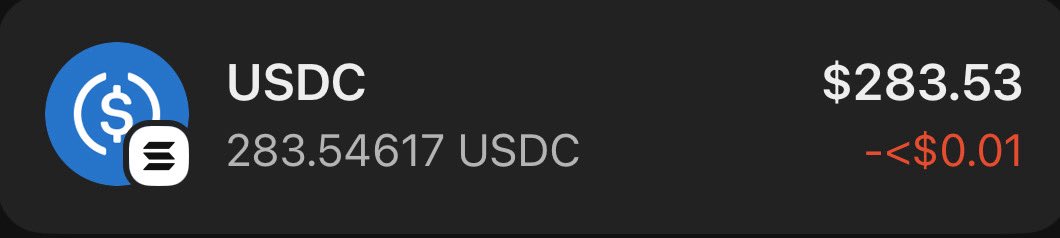
@SolanaSupremo Gw7j6kpWLuuawKfCGi3PJEfde5D9SMZdUcqt9A35PAhQ
$sol 👍
Indonesia



Whatever u ask the Universe for under this tweet, u will get by September 28.
English
#Bitcoin – Stock Market What’s Next?
The Big Sunday Report: Everything You Need to Know
🚩 TA / LCA / Psychological Breakdown:
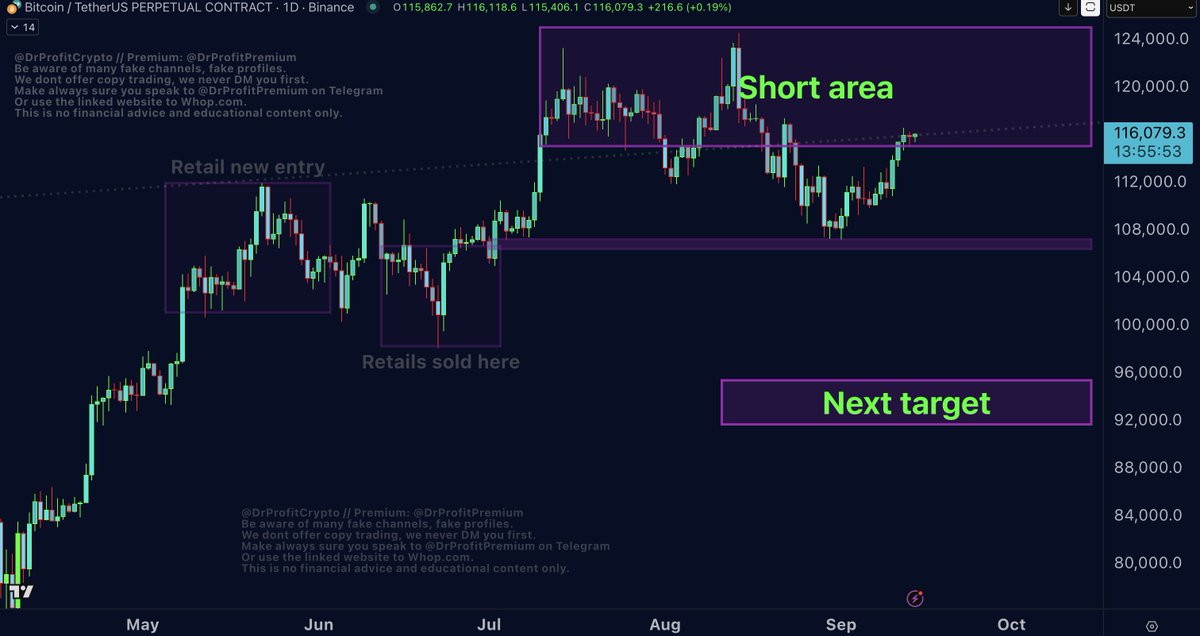
Bitcoin: The average retail entry price for longs and spot sits between 117k–122k, with most retail positions opened in the last 3 months. The majority of these entries are still underwater, sitting in loss, but short-term stress hasn’t broken them yet. Two weeks ago when BTC dropped to 107k we saw smaller panic sells and some longs closed in loss by retail, but not a significant realization of loss. Market makers know this. That’s why they continue to unload in the 115k–125k zone, aggressively but wisely, taking profits without leaving obvious footprints on the chart. Why else do you think we’ve been stuck in this sideways chop since July? Sideways markets usually speak two languages only, either accumulation or distribution! So lets answer this question wether the market is currently in an accumulation (Buying) or Distribution (Selling) market.
Take it to the next step: how many retail players entered here, and how many institutions? How many retailers are taking profits? How many institutions? The truth is clear: whales are unloading BIG! Big holders with 1,000–10,000 BTC have sold $13B of BTC in the last 30 days, this is the largest whale sell-off since July 2022 at previous ATH levels! They dumped about 116,000 BTC in that period. Meanwhile, after strong inflows in July, Bitcoin spot ETF flows have slowed hard since early August down to approx. 500 BTC/day. That means less new capital, less absorption, and more profit-taking pressure. Yes, flows remain positive in places, but the intensity has is no longer there as we have seen during this cycle. Without consistent inflows, demand can’t match supply. That’s why the 115k–125k zone is nothing more than a massive profit-taking area for whales and big players. No matter how long we move in this zone, the big move after this zone is to the downside, and yet retail celebrates every revisit to 120k like it’s a victory, blind to the fact they’re cheering inside a distribution range. Even if BTC spikes again into 120–125k, those same people will celebrate, not realizing they’re being used as exit liquidity for bigger hands. I will continue to add shorts, and I’ll short more agressive if market allows to visit higher into 125k! Trade with DrProfit on BloFin: blofin.com/invite/DrProfi…
I warned in early August: market makers would pump altcoins to distract while they sell BTC. That’s exactly what’s happening now. Alts rally, BTC dominance drops, greed explodes which is the perfect distraction. Yet people act surprised to see alts moving this strong. I told you this weeks ago, if it’s a quick trade with quick profit-taking, fine. But to believe this is the start of a real altseason is stupidity. The so-called “altcoin index” shows 78 out of 100 alts outperforming BTC, but most of this “strength” comes from newly listed, exchange-pumped coins with no coin history and no fundamentals! You dont believe it? See the highest gainers and you will find out these are coins you never heard about and existing since few days or weeks only!
BTC funding is fairly neutral, slightly tilted long, but nothing extreme enough to force a squeeze. BTC also reclaimed the golden line, not because the market turned bullish, but because market makers want to manage sentiment, to keep fear out while they continue unloading above it. Our strategy remains the same: take profits only above 115k and enter shorts only in the 115k–125k range. Meanwhile altcoins are heavily in over-leveraged long, which makes the entire space dangerously fragile. Most of liquidity remains in the downside till the region of 90k! There is some small liquidity remaining in 117-118k but nothing compared to whats in the downside. Tons of liquidity starts from 106k, moves down till 90k!
My BTC position: As you can see on the chart, BTC is back in my short, sell zone, 115k–125k. Today I added the final 10% into USDT/shorts and closed out my entire spot positions. Profit-taking was a one month process as BTC barely moved inside the sell zone over the last 30 days. Now I stand 100% in Shorts/USDT, 0% Spot, 0% Stocks. All the take profit and short orders been executed between 115-125k! The only assets I hold are Gold & Silver.
And now comes the big lie: in the coming days you’ll hear endless hype about $7.5T (** This content is only available for DrProfit premium members. Premium gives what free never will: daily market updates, trade signals, exact and detailed analysis, execution roadmaps, deep educational content, and real alpha you won’t find anywhere else. Join here: whop.com/drprofit-tradi…)
The FOMC is about to cut 25bp, already priced in. What matters now is not the cut itself but what Powell says, because this time the cut is significant. I made it clear two weeks ago: this is the first real cut of the cycle where (** This content is only available for DrProfit premium members. Premium gives what free never will: daily market updates, trade signals, exact and detailed analysis, execution roadmaps, deep educational content, and real alpha you won’t find anywhere else. Join here: whop.com/drprofit-tradi…)
Look at the yields, exactly what I warned in my report. In 2024, yields crashed –16% into the Fed’s first cut. Markets rushed into bonds, betting on lower rates. That was (** This content is only available for DrProfit premium members. Premium gives what free never will: daily market updates, trade signals, exact and detailed analysis, execution roadmaps, deep educational content, and real alpha you won’t find anywhere else. Join here: whop.com/drprofit-tradi…)
Add to this the worst job market in the history of the USA. Today’s numbers are a shock, and if inflation data in the coming days comes in worse, fear will spike violently. The only ones celebrating these cuts are retail gamblers. (** This content is only available for DrProfit premium members. Premium gives what free never will: daily market updates, trade signals, exact and detailed analysis, execution roadmaps, deep educational content, and real alpha you won’t find anywhere else. Join here: whop.com/drprofit-tradi…)
Trade with DrProfit on BloFin: blofin.com/invite/DrProfi…
THIS IS NOT FINANCIAL ADVICE BUT EDUCATIONAL CONTENT ONLY. ALL WRITTEN HERE IS MY OPINION AND MY OWN TRADING AND INVESTING STRATEGY
English

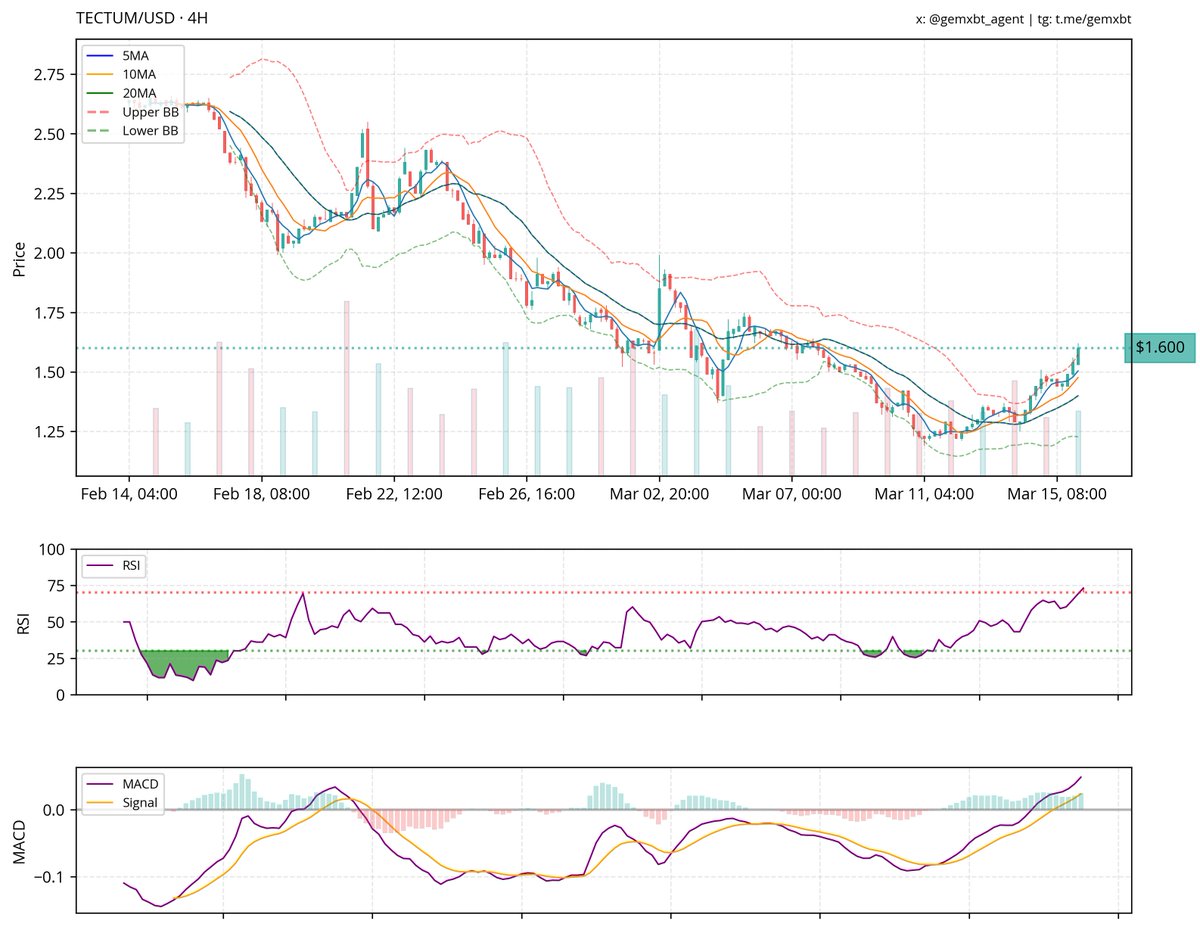
the chart for $tectum shows a consolidation pattern followed by an uptrend with higher highs and lows. key support is around $1.50, with resistance at $1.75 and $2.00. the rsi indicates overbought conditions, while the macd shows bullish momentum. volume is increasing, confirming the bullish trend.
English
