Tony Brite@tbrite89
2026 WxProbe NATL Hurricane Season Forecast: May Update
This update presents a significant downward revision from my April "First Look" outlook. The adjustments better reflect historical analog constraints, intensifying El Niño trends, and projected sea surface temperature (SST) configurations during the August–October (ASO) peak.
Seasonal Activity Projections:
Named Storms: 9–13 (11)
Hurricanes: 3–5 (4)
Major Hurricanes: 1–3 (2)
ACE: 40–90 (65)
Note: Single figures in parentheses represent the official seasonal totals forecast by WxProbe. The surrounding ranges represent standard WxProbe verification windows (allowable margins of error: +/- 2 named storms, +/- 1 hurricane, +/- 1 major hurricane, and +/- 25 ACE).
Historical Analog Evaluation:
The baseline composite includes six key analogs optimized for the unique 2026 atmospheric and thermodynamic setup: 2015, 1997, 2009, 2002, 2018, and 2023.
* Six-Year Composite Average: 12.5 Named Storms/4.8 Hurricanes/2.0 Major Hurricanes/82.5 ACE.
* Composite Oceanic Niño Index (ONI): 1.5°C during the ASO peak.
* Forecast Adjustment Justification: Present expectations favor a significantly stronger, more mature El Niño event than the 1.5°C analog mean, resembling a “super” El Niño scenario. Consequently, my final forecast targets lean lower than the raw six-year composite averages…though modern (1995-2025) baseline warmth prevents a total collapse.
Primary Seasonal Drivers:
1. Dominant Moderate-to-Strong El Niño Signal:
The Climate Prediction Center (CPC) May 2026 ENSO Diagnostic Discussion notes current neutral conditions, but assigns a 61% probability of El Niño development during the May–July window. Relevant models continue to project a robust, mature event by peak season. The expected atmospheric responses via the altered Walker Circulation include the following:
* Walker Circulation Disruption: Deep convective thunderstorms venting over the eastern Pacific force a massive eastward shift in the upper-level loop. This drives large-scale subsidence (sinking dry air) directly over northern South America and the Caribbean, capping the atmosphere and suppressing upward thunderstorm convection.
* Increased Wind Shear: Accelerated high-altitude westerly winds clash with low-level easterly trade winds. This severe vertical wind shear tilts and physically rips apart developing tropical depressions before they can organize.
* Altered Steering: A weakened, fractured Bermuda High limits favorable long-track westward migration, deflecting weak systems northward into hostile mid-latitude environments.
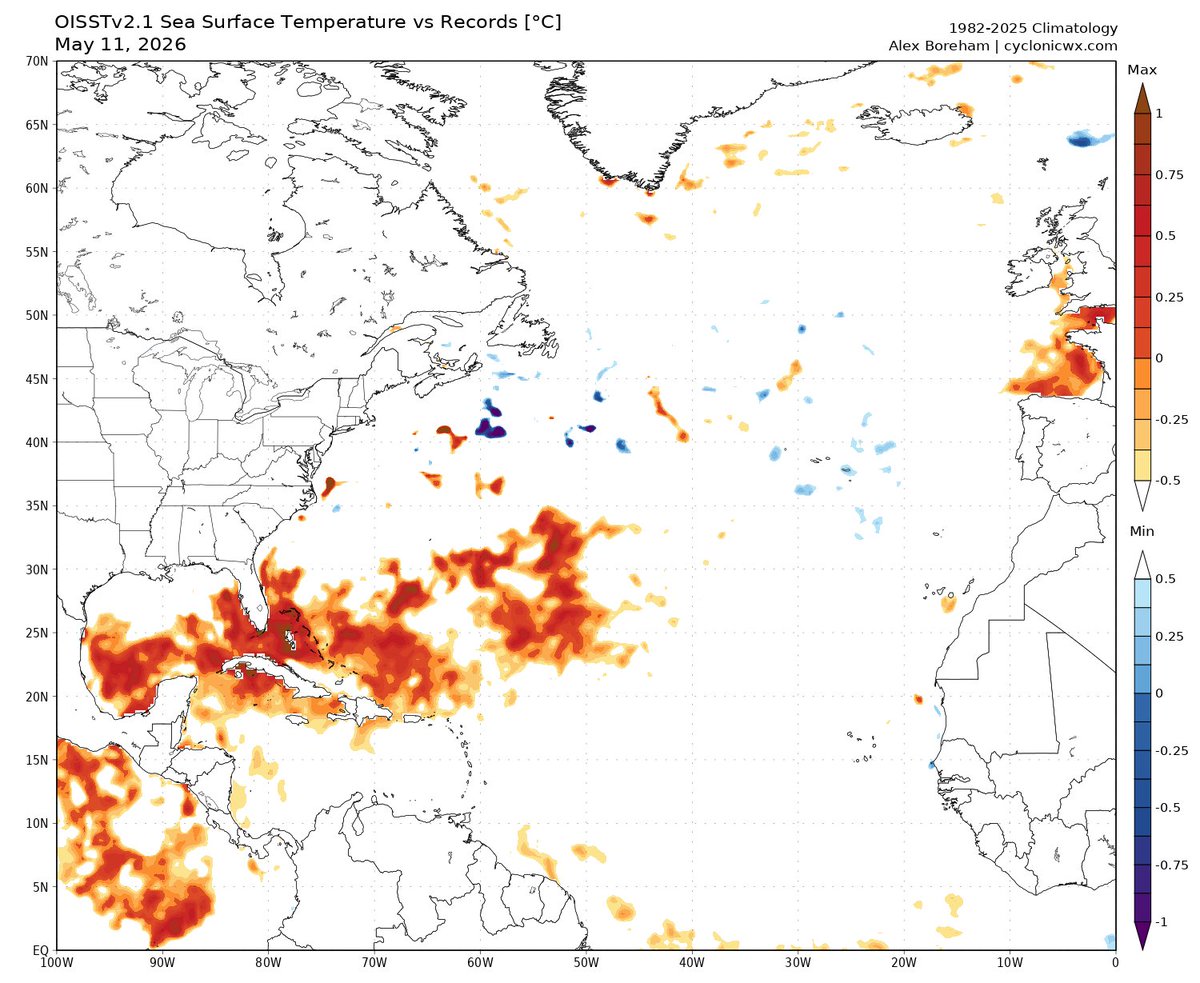
2. Non-Record, Polarized Atlantic SST Profile:
Atmospheric suppression should *not* face the historic thermal resistance seen in 2023. Specifically, current basin conditions exhibit a highly stark, split configuration:
* Gulf of Mexico Marine Heatwave: Sea surface temperatures and deep-ocean heat content are at near-record heights, tracking +1.0°C above the climatological 30-year average. This localized heat engine poses an increased risk for rapid intensification for any storm entering this part of the basin.
* Central and Eastern MDR: The tropical Atlantic corridor has cooled dramatically from the 2023–2024 marine heatwaves, tracking near or even slightly below normal. This introduces a minor Atlantic Niña-like signature.
* Thermodynamic Insufficiency: Without widespread, basin-wide record warmth, the tropical Atlantic lacks the thermal insulation/depth needed to counteract El Niño's hostile wind fields.
3. Verification Against Pure El Niño Analogs:
To properly isolate the true atmospheric mechanics, we need to classify the historical analogs into three distinct structural eras based on their spatial SST profiles:
Era 1: Total Suppression Era (1997 & 2015) = Widespread Cold Basin
Era 2: Standard Suppression Era (2002 & 2009) = Neutral/Quiet MDR Baseline
Era 3: Thermal Discrepancy Era (2018 & 2023) = Warm Basins/Variable El Niños
* The Four Primary Core Analogs (1997, 2002, 2009, 2015): These seasons act as our primary atmospheric baseline. By isolating just these four core years, we get an average of 10.0 Named Storms, 3.5 Hurricanes, and 1.8 major hurricanes, respectively. They represent the standard-to-strong Pacific (El Nino) suppression acting on a non-hyperactive Atlantic basin.
* The Relevancy of the Secondary Analogs (2018 & 2023): While not the main drivers, 2018 and 2023 are critical additions to the broad composite. The 2018 season featured a weak/borderline El Niño, but serves as a vital thermodynamic match for today’s extreme warm Gulf of Mexico. 2023 represents a strong Pacific El Niño, but remains a record-shattering warm-basin outlier…whose extreme MDR heat significantly neutralized the Pacific shear.
* Analog Exclusion (2006): 2006 is entirely excluded from the composite of all non-Modoki-El Niño events during the most recent active/warm AMO phase. Because 2006 featured a weak El Niño that developed unusually late in the summer, its atmospheric footprint fails to capture the rapid, early-season onset and strong-to-super intensity expected from this forthcoming 2026 Pacific event.
Climatological Implications for Late-Season Activity:
The suppressing effects of a strong El Niño characteristically maximize during post-peak and late-season windows (late September through November) as the Pacific event reaches maturity. While the North Atlantic basin produced well-above-normal late-season activity over the past few climate cycles, 2026 will likely display the opposite trend.
For historical context, the selected pure El Niño analogs generated a 52.8% reduction in late-season activity compared to the active-era (1995–2025) average. Consequently, a highly abrupt, suppressed finish to the 2026 season is expected after September.
Rationale for the specific Point Targets:
WxProbe has set the official point targets at 11 Named Storms, 4 Hurricanes, 2 Major Hurricanes, and 65 ACE to best balance large-scale global atmospheric suppression against localized modern basin warmth.
* Named Storm Range 9–13 (Target: 11): This range was chosen over the lower 8–12 bracket under strong consideration. While El Niño should effectively shut down the eastern MDR to long-track African easterly waves, extreme marine heatwaves lingering in the GOMEX and subtropical Atlantic will act as a secondary breeding ground. As a result, stalling cold fronts and non-tropical lows over these ultra-warm waters can easily spin up short-lived, homegrown systems. This localized environment will likely pad the final named storm count to 11.
* Hurricane Range 3–5 (Target: 4): This particular window is reduced from the 4–6 range projected in April to maximize WxProbe verification metrics. Because a strong-to-super El Niño exerts a powerful cap on the atmosphere, hostile vertical wind shear will prevent many homegrown named storms from achieving full hurricane intensity. A point target of 4 hurricanes anchors tightly to the core four analog mean (3.5)…while accounting for the modern climate baseline.
* Major Hurricane Range 1–3 (Target: 2): This window is selected over a lower 0–2 range to account for the high-end intensity risks in a suppressed year. While the overall environment is hostile, the enhanced heat content in the Gulf of Mexico provides a volatile energy source. This leaves statistical room for 1 or 2 systems to undergo rapid intensification into major hurricanes in the western portion of the basin or GOMEX (e.g., Isidore/Lili 2002), and another potentially in the MDR…matching the core analog mean (1.75) while respecting modern thermal environments.
* ACE Range 40–90 (Target: 65): This range centers precisely on a target of 65 to reflect a heavily truncated season. Hostile wind shear, mid-level dry air, and a weakened Bermuda High will severely limit storm longevity and track lengths by negating long-track westward progression. This keeps seasonal energy output well below the active-era (1995-2025) norm. However, a target of 65 sits slightly above the aforementioned core four analog mean (56) to allow for high energy generation from any short-track, intense systems over the ultra-warm subtropical waters.
Next Update:
I will issue the definitive seasonal forecast around the middle of June. In the meantime, it’ll be most interesting to see if the MDR can warm above the most recent climatological levels and how the overall SST profile may change over the succeeding 30 days.