Dera | Power BI Developer 💛✨@_DeraIJ
𝐏𝐚𝐫𝐭 2: 𝐃𝐲𝐧𝐚𝐦𝐢𝐜 𝐅𝐢𝐥𝐭𝐞𝐫𝐢𝐧𝐠 𝐰𝐢𝐭𝐡 𝐏𝐚𝐫𝐚𝐦𝐞𝐭𝐞𝐫𝐬
When to use Field Parameters vs Numeric Parameters (with examples)
Parameters can do a lot, but knowing when to use each type depends on what your data needs.
📍 𝐅𝐢𝐞𝐥𝐝 𝐏𝐚𝐫𝐚𝐦𝐞𝐭𝐞𝐫𝐬
Use this when you want to switch fields inside one visual.
It’s perfect when your visual has the same structure but different data points to explore.
Examples:
• Switching a KPI card between Delay %, Flight Volume, and On-Time Rate
• Switching a bar chart between Airlines, Routes, or Regions
• Switching a line chart between Monthly Delays, Monthly Cancellations, or Monthly Departures
Field parameters answer the question, “𝐖𝐡𝐚𝐭 𝐝𝐨 𝐲𝐨𝐮 𝐰𝐚𝐧𝐭 𝐭𝐨 𝐬𝐞𝐞? ”
📍 𝐍𝐮𝐦𝐞𝐫𝐢𝐜 𝐏𝐚𝐫𝐚𝐦𝐞𝐭𝐞𝐫𝐬
Use this when you want users to control a number inside the report.
Perfect for adjusting values or running scenarios.
Examples:
• Setting a custom delay threshold (e.g., highlight flights above 20 minutes)
• Running a what-if analysis on ticket prices or fuel cost changes
• Adjusting ranges for a KPI target dynamically
• Allowing users to change the number of top routes shown (Top 5, Top 10, Top 15)
Numeric parameters answer the question, “𝐇𝐨𝐰 𝐝𝐨 𝐲𝐨𝐮 𝐰𝐚𝐧𝐭 𝐭𝐨 𝐯𝐢𝐞𝐰 𝐢𝐭?”
𝘐𝘯 𝘴𝘪𝘮𝘱𝘭𝘦 𝘵𝘦𝘳𝘮𝘴:
📍 𝐅𝐢𝐞𝐥𝐝 𝐩𝐚𝐫𝐚𝐦𝐞𝐭𝐞𝐫𝐬 𝐜𝐡𝐚𝐧𝐠𝐞 𝐰𝐡𝐚𝐭 𝐲𝐨𝐮 𝐚𝐧𝐚𝐥𝐲𝐳𝐞.
📍 𝐍𝐮𝐦𝐞𝐫𝐢𝐜 𝐩𝐚𝐫𝐚𝐦𝐞𝐭𝐞𝐫𝐬 𝐜𝐡𝐚𝐧𝐠𝐞 𝐡𝐨𝐰 𝐲𝐨𝐮 𝐚𝐧𝐚𝐥𝐲𝐳𝐞 𝐢𝐭.
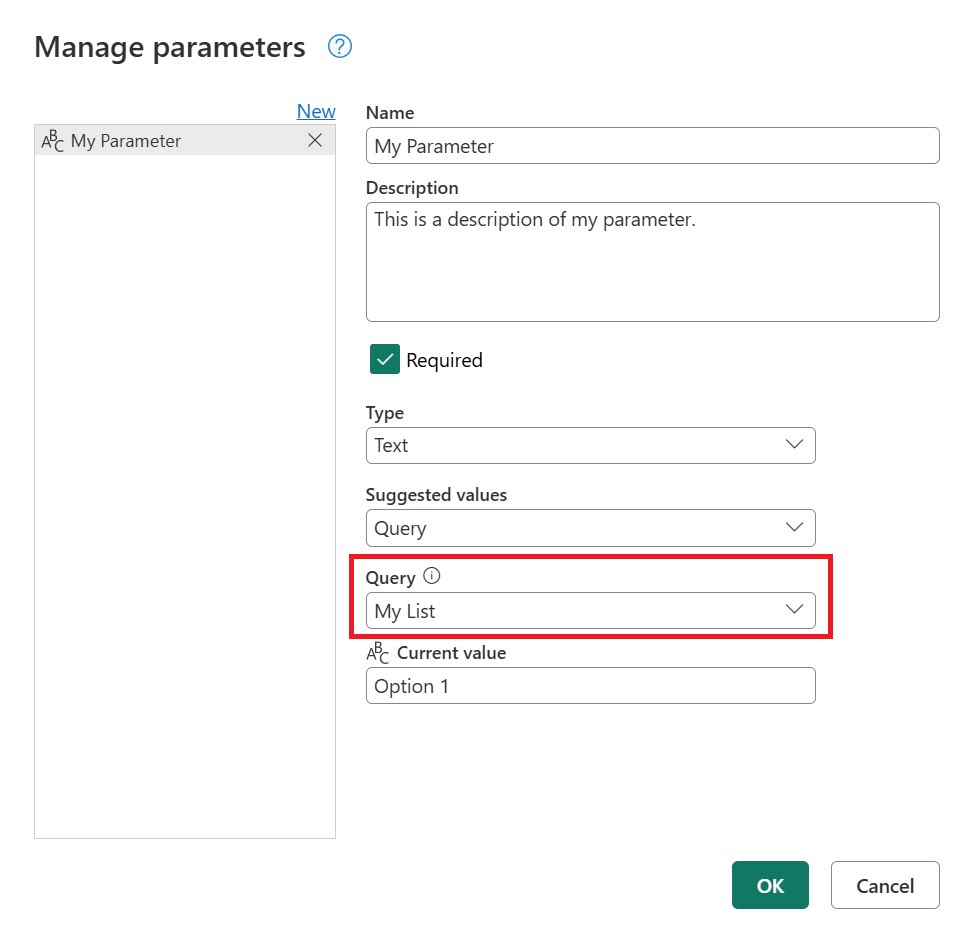
Follow for part 3, where I'll talk about the last type of parameter in Power BI, which is the 𝑸𝒖𝒆𝒓𝒚 𝑷𝒂𝒓𝒂𝒎𝒆𝒕𝒆𝒓.
#PowerBI #DataAnalytics #BusinessIntelligence #DataVisualization