Marco Russo

13.1K posts

Marco Russo banner
Marco Russo

Marco Russo

@marcorus

Consultant, speaker, book writer, mentor. Business Intelligence with Power BI, Analysis Services, and Power Pivot. Other info on https://t.co/hYayga42y6

Katılım Eylül 2009
475 Takip Edilen26.2K Takipçiler
Sabitlenmiş Tweet
Marco Russo
Marco Russo@marcorus·
After years in “stealth mode,” we’re excited to introduce DAX Optimizer. Dive deeper here: daxoptimizer.com/blog/introduci… 
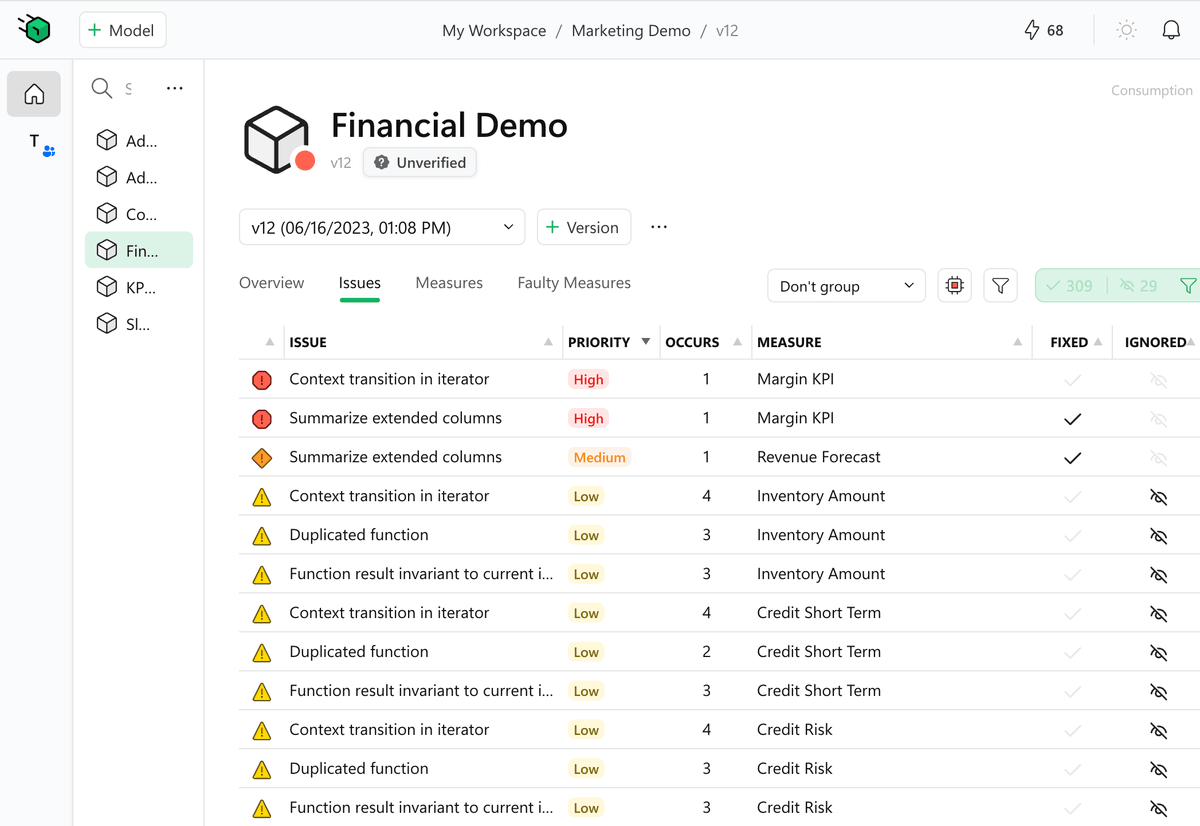
DAX Optimizer is a tool – delivered as a service – that helps identify potential bottlenecks and suggests impactful solutions and priorities. You still write the code, but it is like you have a mentor on the side teaching you best practices, focusing on the most impactful area of your measures. Spend your time where it matters, getting immediate improvements. For example, you may have 200 measures, many of which have similar coding practice issues: Where to start? DAX Optimizer guides you to the more important measures, which could be the ones that are more frequently used by other measures and not necessarily those that directly appear on any report. Now that we are out of stealth mode, we have much to say: how it works, how it preserves sensitive data, how it works for teams and individual developers, and share the plans to improve it over time. We will do that in the coming weeks. Where are we now? Our beta program is live, initial users are onboarded, and the waitlist is growing. We’re gradually rolling out invitation codes in the coming weeks. The service is functional, the UI for a single developer is polished, and the documentation is shaping up. While we work towards our public release, we’ll be actively seeking your feedback to refine DAX Optimizer. We won’t be rolling out a major marketing campaign yet, as we’re committed to perfecting the tool. Do not expect videos or articles from us until public release. That said, beta participants are welcome to share their experiences, as we do not require any NDA. Articles, videos, with the good and the bad – all are fair game. We believe in transparency! Join us in shaping the future of coding with DAX Optimizer. Your code, optimized. daxoptimizer.com
Marco Russo tweet media
English
19
91
363
47.3K
Marco Russo
Marco Russo@marcorus·
@asjones987 We cannot use the same technique used for VertiPaq Analyzer but we’re evaluating possible options.
English
0
0
1
17
Alan Jones
Alan Jones@asjones987·
@marcorus I assume due to how they are handled we won't see DAX Studio and VertiPaq Analyzer be able to pull DAX Visual Calcs? Something came up and I wondered what visuals on what pages had visual calculations.
English
1
0
0
11
Alan Jones
Alan Jones@asjones987·
@marcorus from what I can tell DaxStudio can execute a DAX UDF, but I can' see the DAX code of the UDF function. Am I missing that? What i really am after is the Excel VertiPaq Analyzer to have those defined also in it's output. Maybe as a new Type listed.
English
1
0
1
47
Marco Russo
Marco Russo@marcorus·
Honestly, many people attending Mastering DAX in-person already “know DAX”. They don’t come to learn function names; they come to clear doubts they’ve been carrying for years. In-person training is about interaction: exercises, questions, conversations. You always learn something new, no matter your current level. Next Mastering DAX in-person:  𝗡𝗢𝗥𝗧𝗛 𝗔𝗠𝗘𝗥𝗜𝗖𝗔  𝗛𝗼𝘂𝘀𝘁𝗼𝗻, 𝗧𝗫: Mar 30→Apr 1: sqlbi.com/p/mastering-da… 𝗡𝗲𝘄 𝗬𝗼𝗿𝗸 𝗖𝗶𝘁𝘆, 𝗡𝗬: Apr 8→10: sqlbi.com/p/mastering-da… 𝗕𝗮𝗹𝘁𝗶𝗺𝗼𝗿𝗲, 𝗠𝗗: May 27→29: sqlbi.com/p/mastering-da… 𝗘𝗨𝗥𝗢𝗣𝗘  𝗖𝗼𝗽𝗲𝗻𝗵𝗮𝗴𝗲𝗻, 𝗗𝗞: May 5→7: sqlbi.com/p/mastering-da… 𝗭𝘂𝗿𝗶𝗰𝗵, 𝗖𝗛: Jun 10→12: sqlbi.com/p/mastering-da… 𝗕𝗲𝗿𝗹𝗶𝗻, 𝗗𝗘: Jun 15→17: sqlbi.com/p/mastering-da… All the classes are in English.
Marco Russo tweet media
English
0
2
16
780
Marco Russo
Marco Russo@marcorus·
Let’s see how companies manage 𝗳𝗹𝗲𝘅𝗶𝗯𝗹𝗲 𝘄𝗼𝗿𝗸𝘀𝗽𝗮𝗰𝗲 𝗮𝗹𝗹𝗼𝗰𝗮𝘁𝗶𝗼𝗻with 𝗦𝘆𝗻𝗼𝗽𝘁𝗶𝗰 𝗣𝗮𝗻𝗲𝗹in Power BI, mapping office seats, verifying availability, moving across floors, and connecting the layout to live reservation data using custom SVG floor plans derived from AutoCAD files. 𝗦𝘁𝗲𝗽𝘀 𝗶𝗻 𝘁𝗵𝗲 𝗰𝗮𝘀𝗲 𝘀𝘁𝘂𝗱𝘆: - ConvertDWG office plans into SVG - Map seat/workstation IDs to data in the model - Manage multi-floor layouts with dynamic map selection - Enable tooltips, interactions, and linked visuals 𝗥𝗲𝗮𝗱 𝘁𝗵𝗲 𝗳𝘂𝗹𝗹 𝗰𝗮𝘀𝗲 𝘀𝘁𝘂𝗱𝘆 𝗵𝗲𝗿𝗲: okviz.com/usecase/worksp… 𝗧𝗿𝘆 𝗦𝘆𝗻𝗼𝗽𝘁𝗶𝗰 𝗣𝗮𝗻𝗲𝗹 okviz.com/synoptic-panel/
English
0
2
10
1.7K
Marco Russo
Marco Russo@marcorus·
Try to use with visual calc this measure: IF ( ISINSCOPE ( Product[Category] ), DISTINCTCOUNT ( Sales[Order Date] ) ) I guess that the additional cost for the visual calc is the unnecessary total computed by a simple DISTINCTCOUNT so the code above should remove it. Pure entertainment, I’m not suggesting to use that, I just want to validate my idea.
English
0
0
0
30
Ed Hansberry
Ed Hansberry@ehansalytics·
@marcorus Somewhat arbitrary calc just to test. My iterator was: SUMX( VALUES('Product'[Category]), DISTINCTCOUNT(Sales[Order Date]) ) The orig calc was just DISTINCTCOUNT(Sales[Order Date]) and then told it to do the custom subtotal. Fact table 120M records.
English
1
0
0
56
Ed Hansberry
Ed Hansberry@ehansalytics·
The DAX Query this feature creates is insane. Of course, the person this is targeted for would never see the query or understand the implications of it. But if you are a Power BI developer, experienced or aspiring, you will want to avoid this feature for production reports, and remove it from models you inherit. It can be useful in testing though for quick totals before you dig into the DAX to write the more advanced measure that works at the total level the way you want - which is an iterator most of the time. In my very VERY modest testing with AdventureWorks, I saw a simple query double in processing time using the benchmark feature of DAX Studio. I doubt this feature causes a doubling of all queries, but it isn't negligible, and on a real dataset with millions of records, it can be substantial. I'm looking forward to the deep dive from @marcorus and @FerrariAlberto
Daniil Maslyuk@DMaslyuk

Custom totals in Power BI are available now!

English
3
4
28
2.2K
Marco Russo
Marco Russo@marcorus·
@ehansalytics It’s a visual calculation, overhead should be minimal. I’m surprised it’s 10% it seems too much.
English
1
0
0
63
Ed Hansberry
Ed Hansberry@ehansalytics·
Running this on a larger model (Contoso with 120M records) I was seeing a more reasonable 10%-11% performance hit with a very simple DISTINCTCOUNT() being the base measure. As always, YYMV, and you should test the hit to the model before deploying, but I'll take a 10% performance gain every day of the week by writing my own measure.
English
1
0
0
151
Marco Russo retweetledi
Kurt Buhler
Kurt Buhler@kurtbuhler·
This article explains what a semantic layer is and why it's so important, irrespective of your data platform. Link below
Kurt Buhler tweet media
English
2
13
102
6K
Kurt Buhler
Kurt Buhler@kurtbuhler·
Seems like a lot of interest in this dashboard and approach. Good! It's very fun/useful... and fast. Soon as I get time after we release pbir-cli, I'll clean this up and share all the code so that you can use it with your own data, or to make your own, similar dashboards. :)
Kurt Buhler tweet media
English
1
5
50
2.6K
Ed Hansberry
Ed Hansberry@ehansalytics·
@marcorus Bi-Di is honestly more painful than what is represented, but yeah, a frankentable is the worst.
English
1
0
1
162
Marco Russo
Marco Russo@marcorus·
Feel free to agree or disagree with me in the comments ;)
Marco Russo tweet media
English
5
5
38
1.8K
Marco Russo
Marco Russo@marcorus·
If you are in 𝗡𝗲𝘄 𝗬𝗼𝗿𝗸 𝗖𝗶𝘁𝘆 and work with data in the Microsoft ecosystem, you should definitely attend the first Fabric NYC User Group event on 𝗔𝗽𝗿𝗶𝗹 𝟵, 𝟮𝟬𝟮𝟲 𝗮𝘁 𝟲 𝗽𝗺 𝘀𝗵𝗮𝗿𝗽: - Amazing location on the 5th Avenue - Free event - Two sessions, one from Kim Manis and one from me - Networking 𝗥𝗦𝗩𝗣: community.fabric.microsoft.com/t5/Fabric-NYC-… If you need a reason to 𝗳𝗹𝘆 𝘁𝗼 𝗡𝗬𝗖, you can stay longer and attend the 𝟯-𝗱𝗮𝘆 𝗠𝗮𝘀𝘁𝗲𝗿𝗶𝗻𝗴 𝗗𝗔𝗫 workshop I will deliver on 𝗔𝗽𝗿𝗶𝗹 𝟴-𝟭𝟬, 𝟮𝟬𝟮𝟲: sqlbi.com/p/mastering-da… If you can attend the class, I suggest that you attend the user group event, too! 𝗟𝗼𝗼𝗸𝗶𝗻𝗴 𝗳𝗼𝗿 𝘃𝗼𝗹𝘂𝗻𝘁𝗲𝗲𝗿𝘀: for some unexplainable reason, New York City did not have a Power BI and Fabric User Group until two days ago. To tell the truth, it does not have one yet. We all hope there will be an active one from April 9. Now. Having an active Fabric User Group (but I will continue to add Power BI here and there, forgive me for that) is beneficial for the users, for the community, for Microsoft, and for those volunteers who will spend some of their time moving it forward. You can be one of them: find one in your city. If you happen to live or work near New York City, this is your chance. The stars are aligned. I could give you many reasons why this could be a good idea, but there is only one important one: it’s fun and exciting. Feel free to comment below or write to me directly; I’ll be happy to answer your questions. If you are not sure, just register for the event, attend, and meet me and the other “temporary” organizers. Let's see what happens See you soon! 𝗢𝗸𝗮𝘆, 𝗯𝘂𝘁 𝘄𝗵𝗮𝘁 𝘄𝗶𝗹𝗹 𝘆𝗼𝘂 𝘁𝗮𝗹𝗸 𝗮𝗯𝗼𝘂𝘁? Good question. As I said, the content is less important than the networking opportunity, in my opinion. But this does not mean you should not come to listen to @kimmanis talk about the news in Fabric straight from the Fabcon conference, particularly about Fabric IQ. Then I will brainwash you, convincing you that using DAX User-Defined Functions is a good idea for you and your (future?) AI agents. Enough! (photo by Josip Ivanković on Unsplash)
Marco Russo tweet media
English
0
1
9
625
Kurt Buhler
Kurt Buhler@kurtbuhler·
More experimentation with this custom agent. Just a fun side project... a little goblin that has access to CLIs, MCPs, and skills to work in Fabric, Databricks, or locally in Excel. Here it is organizing it's workspace after testing the PBIR CLI. Still needs a lot of tuning but is fun to do between other stuff.
English
3
1
29
2K
Marco Russo retweetledi
Kurt Buhler
Kurt Buhler@kurtbuhler·
The message "AI will replace you" is irresponsible and unhelpful; I'm sick of it. The message should be how these tools can augment and enable you to do more and overcome technical barriers. "Copilot will replace Power BI reports... the business will just ask a question" "Data agents will replace dashboards... your personal data analyst" "Coding agents with tools and skills will replace developers" I feel like this has been implicitly or explicitly communicated in various ways over the last two years. It's disappointing in particular to hear it from people from Microsoft or MVPs who seem to not realize how damaging it is. Do you want to know why there's so much resistance and vitriol against AI and Copilot? Aside from ethical concerns... this is why; the messaging has been too strong, too unsympathetic, and has at no point acknowledged or walked back these blunders with self-awareness or authenticity. When you say these things, you're dismissing the professionals who have built their careers on these tools and their expertise; as if they will not evolve with and leverage this change. As if they don't matter. They do matter; we all matter. And obviously, professionals can adapt if they invest in learning these tools. Look, no one can deny that this technology is powerful and extremely, extremely disruptive. If I provide someone a coding agent with a few well-written skills and CLI tools they can do things that they didn't even dream was possible before that. Obviously that has an impact on many areas, like consulting, training, and UI-heavy tools. AI and agents can't think for you; they can't design the solution for you. I've also tried to account for this in content and the tools I'm making or sharing... they're to augment you; help you. In the face of this disruption we need to focus intensely on a vision for a future where we're enabled and augmented; where we're all lifted up. We should reject the notion that AI will replace human workers and things that make us human -- art, expression, thought, design... If replacement is a risk or threat, then we need to treat it as a problem and challenge that we should address. That's why I'm encouraging people to start experimenting with and creating things using AI or agents. As these changes happen we must consider how we can help people get on board and benefit. We owe each other that much.
Kurt Buhler tweet media
English
7
15
108
8.8K
Marco Russo
Marco Russo@marcorus·
With Synoptic Panel in Power BI, you can turn dental records into a visual map of the mouth and analyze results by demographics or habits. It’s a straightforward way to transition from individual data to aggregated insights, providing a clear view of your data.  That’s one of the many use cases for Synoptic Panel.  I’m curious, how could this feature help you in your reports? Share your thoughts in the comments!
English
0
0
2
853
Marco Russo
Marco Russo@marcorus·
I'll be speaking about DAX User Defined Functions in Berlin on June 16, 2026, at 18:00 local time. If you are in the Berlin area, do not miss this free event from the Berlin Power BI User Group. RSVP: meetup.com/berlin-power-b… And if you want another good reason to visit Berlin, I have a 3-day Mastering DAX workshop on June 15-17, 2026. The new program covers all the new DAX features, including UDFs and calendar-based time intelligence: sqlbi.com/p/mastering-da…
Marco Russo tweet media
English
1
2
12
658
Marco Russo
Marco Russo@marcorus·
In technical discussions, the truth usually sits somewhere in the middle. We all have opinions, and that's fine. What matters is being intellectually honest: present your facts, respect the other side, and let people read and decide for themselves. No one ever changed their mind because someone shouted louder. Every professional discussion deserves this kind of balance and mutual respect. Honestly, though, some things are just not up for debate. 𝐂𝐨𝐝𝐞 is 𝐟𝐨𝐫𝐦𝐚𝐭𝐭𝐞𝐝 with 𝟒 𝐬𝐩𝐚𝐜𝐞𝐬, not tabs. Not three, not two. Four spaces. Period.
Marco Russo tweet media
English
5
2
28
1.8K