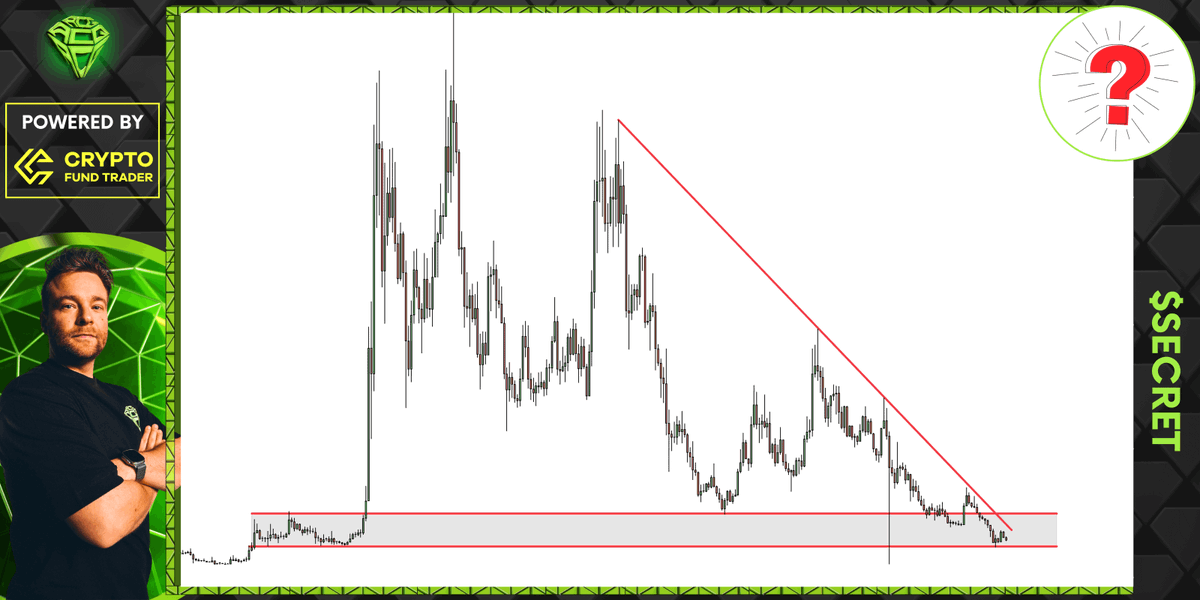


This is a very simplified visual presentation of the current trend. I mentioned before that structure is slowly leaning more bullish today than before. But another reason I want to highlight today is the LENGTH. While it's slow and steady, there's no brutal sell-off, there's no inability to hold today's levels. The markets are reaching higher and actually holding it well. In a downtrend most of the time we do also retrace and create bullish rallies within. That makes it so difficult to pinpoint if the bottom is really in or not at the bottom range. It's the million dollar question and often only answered after we leave that range. As it can easily be a simple bear market retracement but also the beginning of the reversal. Today we have a bit more clues however as we are reaching BEYOND bear market retracement territory. But also as I just mentioned earlier the length. Bear market retracements eventually do sell-off brutally again (the normal continuation of the trend). They don't hold newly reached key levels for long. To many sellers to push it down and a lack of buyers to sustain it. The dynamic between those 2 is shifting lately. Even a news highlight of Microstrategy some hasn't budged price. So again the markets are going back into a better direction than some would think right now. The next dip in the coming weeks (if there even is any) for this same reason will likely be a higher low. Probably mid 70s. Don't see us going to the equal low territory anymore even.