Mick Makkinen

6 posts

Mick Makkinen

Mick Makkinen

@spigwont

Hi, this is an anonymous account I use to quietly & privately follow people/stuff that are interesting to me or just relevant to what's happening in the world.

Ireland Katılım Mayıs 2010
458 Takip Edilen11 Takipçiler
Mick Makkinen
Mick Makkinen@spigwont·
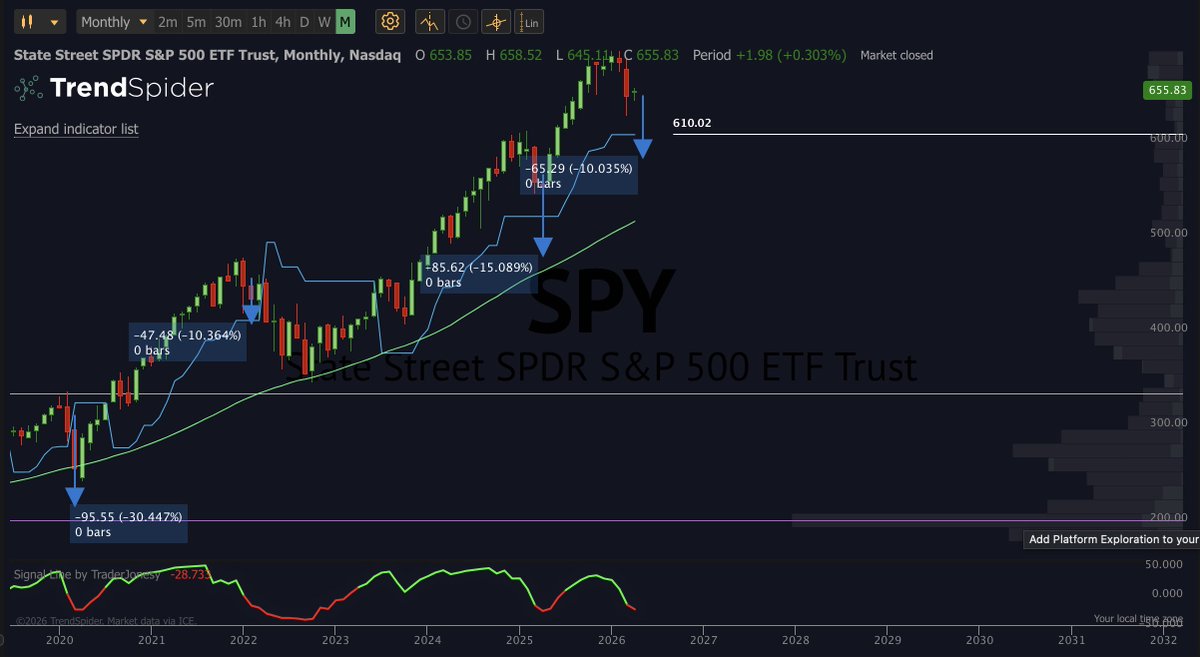
@Basssem666 It was pointed out in some other post I saw that SPY tends to grind up on gradually decreasing volume and even fast rips happen on short term volume declines. See daily chart for 2024 with an MA on the volume as an example. See other short term rips where volume drops. Its normal
English
5
0
3
566
Bassem
Bassem@Basssem666·
$SPY This rally has been remarkable no doubt about that, but the volume is very suspicious. I’m not trying to be a perma bear and I’m not, i go long when i see fit. Despite that I still underestimated the extension of this rally and took multiple losses trying to short it. Owned my Ls and moving on. I’m currently neutral, not bullish, nor bearish, and I’ll explain why. The volume on the weekly declined as we went up, the monthly looks funny as far as volume, really pathetic so far but there are still two weeks to go. Nonetheless, with how much the index went up it should be a lot more. This lack of volume says smart money isn’t buying. I’m not calling for new lows or anything yet but just caution. This rally is still very suspicious regardless how historic it is. Price is currently at a rejection zone between 700-705. If price rejects then we’ll start correcting a little. If price holds above then the next level on my fibs is around 710- 713 and that’s crazy without a pullback, but I’m ready for anything at this point to be honest. The first phase of the correction whenever it starts should resolve around 682-678, won’t be in a straight line as there are many supports above, but eventually it should get there, then we will see whether the bulls or the bears are in control. If the 670s hold it’ll be a buyable dip. Technically, even if the correction extends to fill the gap (660) or tag the 200 dma from above it will be a buyable dip as well, if the levels hold of course. If price starts to make higher highs again from there then we’ll likely go for 713 or even higher on SPY, that’ll be super bullish. If price drops below 659 and fails to reclaim it then we are going to test 648-644, if this support fails too then price is heading towards the March low and may even break it. Ultra bearish. It’s still 50/50 between the bulls and the bears despite the massive rally. The volume is very suspicious. No bias. One level at a time.
Bassem tweet mediaBassem tweet mediaBassem tweet mediaBassem tweet media
English
48
16
368
63.5K
Mick Makkinen
Mick Makkinen@spigwont·
@MichaelPBento I recall seeing a message last week where the Iranians thanked Pakistan for mediating. Trump can take the extension unilaterally and say it was requested, all he needs is an excuse.
English
0
0
1
351
Michael Bento
Michael Bento@MichaelPBento·
Someone want to explain to me why the market popped on a statement from the Pakistani Prime Minister who, has no involvement in the conflict and the Iranians have repeatedly denied are mediating.
Michael Bento tweet media
English
64
15
231
13.2K
Mick Makkinen
Mick Makkinen@spigwont·
@TraderJonesy Didn't recognise you with the new pic, thought you'd stopped posting 😄
English
2
0
2
50
TraderJonesy
TraderJonesy@TraderJonesy·
Most people are about to get caught off guard… because they’re focused on the wrong thing. Everyone’s locked in on headlines, deals and what might happen next. I don’t see a deal getting done but it doesn’t matter. You can’t trade headlines. You can’t control them, you can’t backtest them and you can’t build consistency around them. The only thing that matters is probabilities and what the charts are actually doing. Right now, probabilities favor downside. There is a 70% probability that the #SP500 hits 642 by Wednesday. There is an 85% probability that the #SP500 hits 642 by Thursday. The bigger picture, #Bitcoin already rolled over before everything escalated. That’s because it’s pure liquidity. No earnings, no story, just liquidity. When liquidity gets pulled, Bitcoin moves first. Stocks lag because they’re tied to earnings and other factors... but they always catch up. That’s what’s happening now. Tech and high beta names are starting to roll and equities are playing catch up. I’m about 40% sized into my May puts. Started building in the 640s last week, added again near 657 and that gap down allowed me to de risk and recover a good chunk of the losses from being a bit heavy earlier. We pushed back up, filled the gap and now we’re setting up again. If we see 662 near the 200 DMA, I’ll move to about 70% size. If we push into 670, I’ll take it to 80 to 90% size. I am not fully (PORT) sized. I am sized in terms with what I want to be in with on this particular position. I run multiple approaches at the same time. About $100K is allocated to the quant fund across roughly 15 names that is fully systematic on 4 hour signals. Around $200K is in the main fund across 50 names, focused on higher timeframe accumulation and rotation. The May positions are planned to be near 50K right now across 5 names, and if they are fully sized in to? That would be closer to $250K but I am rarely fully sized. I am trading with over a million in funds. If everything was maxed out across all approaches, I’d have about $550K deployed. Which means I’m still sitting on over half cash right now. That’s intentional. This structure is what’s allowed me to stay consistent over the last 8 years.. I’ve closed around $120K over the last three months with $30K to $60K months. See my latest post. April started rough but adjusting near the highs and catching the move down helped recover over half of that quickly. One thing I stay strict on is not increasing my sizing as I grow. Most people scale up after wins. I don’t. I keep the structure the same and pull profits out. It limits growth but it keeps everything repeatable and controlled. I’m not trying to overextend. I’m trying to build something that lasts. Targets on $SPY are 642, 631 and 610. Earlier in the week I was heavier but the gap gave me the reset. Now I wait. If the levels come, I take them. If not, I stay patient. We have seen that monthly signal line only flip bearish three times over the last 6 years.. We got it for March. Each time, has led to a minimum 10% decline the following month. This month and next will be very interesting. Since 1993, whenever the monthly signal line has turned bearish, the S&P 500 has typically declined to test the monthly 2.5x ATR level. This has occurred in 11 out of the 14 instances, with only three exceptions. Currently, that 2.5x ATR level sits around 610, which is why I’m targeting 610 as a potential downside level. Possibly within this month or next. In the short term, my target remains 642. THANK YOU FOR YOUR ATTENTION TO THIS MATTER!! — TJ #SP500 #SPY #QQQ #TSLA #PLTR #NVDA #AAPL #Bitcoin #Crypto #stockmarket
TraderJonesy tweet media
English
29
32
443
61.1K
Mick Makkinen
Mick Makkinen@spigwont·
@JohnLoc18 USA bombed missile bunkers near Hormuz with 5000lb munitions. Oil spiked down on the news which caused futures to shoot up
English
4
0
5
1.1K
Noble Francis
Noble Francis@NobleFrancis·
UK brick deliveries are a useful proxy for new house building starts in the absence of monthly starts data. Deliveries in January 2026 were 7.6% lower than a year earlier, according to the Department for Business & Trade. (1/n) #ukhousing #ukconstruction
Noble Francis tweet media
English
6
20
50
9.8K
Mick Makkinen
Mick Makkinen@spigwont·
@interesting_aIl This has to be a troll video. Not knowing these answers just shows that you don't read very much. They're not difficult.
English
0
0
6
285
Interesting AF
Interesting AF@interesting_aIl·
This English exam from Japan is impossible 😭
English
2.3K
602
10.9K
9.9M