stateofblocks

284 posts

stateofblocks banner
stateofblocks

stateofblocks

@stateofblocks

Whispers from the Bullpen

Katılım Şubat 2023
2 Takip Edilen62 Takipçiler
stateofblocks retweetledi
that1618guy
that1618guy@that1618guy·
Finally gotten around to building this for my @stateofblocks community My personal favorite setup: the weekly 9/21 EMA crossover The problem is I was always flipping through 50+ charts trying to remember which alts were setting up for a trend change ... so I built a screener that does it for me It scans the top 50 alts on Bybit spot every day and tells me: > Which ones are approaching their 9/21 cross (and how many weeks out) > Which ones just crossed and are retesting the EMAs (the real entry) > Which ones have compressed volatility (squeeze) ready to expand Already caught RENDER cross and TON retest Live and free: screener.stateofblocks.com
that1618guy tweet media
English
1
1
16
1K
stateofblocks retweetledi
that1618guy
that1618guy@that1618guy·
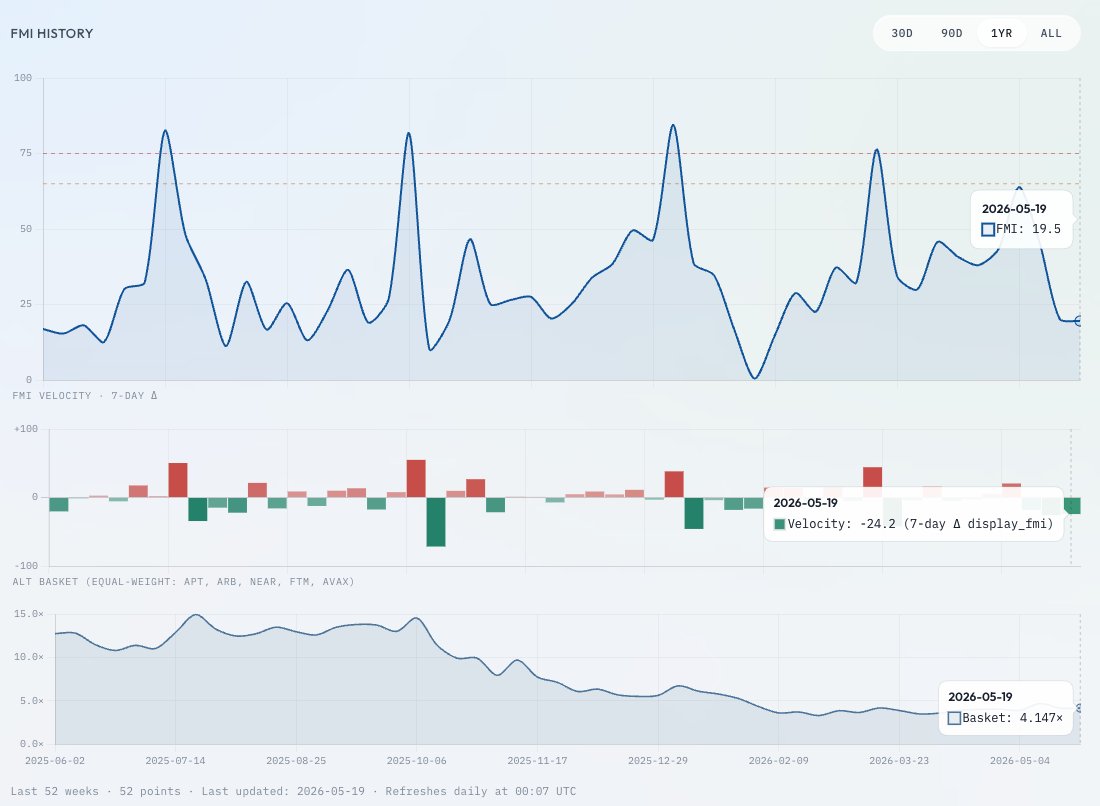
Heres what FMI looks like in practice When multiple stressors measures fire at once (peaks above 65-75), Alts tend to get fragile & that's when washouts happen FMI push to 75 earlier this month caught the recent Alt pullback nicely Current reading @ 19.5 w 1/7 components elevated meaning cascade risk is low right now More detail to follow
that1618guy tweet media
that1618guy@that1618guy

New indicator - "Fast Money Index" or FMI 💸 TLDR when folks make too much money in a short period of time market often rolls over soon after... Qn here is how can we quantify this into a repeatable framework & my answer is via FMI V interesting results, will share more soon

English
0
1
5
597
stateofblocks retweetledi
that1618guy
that1618guy@that1618guy·
Shared this note with my folks over at @stateofblocks in early Feb 26 when $HYPE ran from $20 to ~$40 was looking for a pullback/consolidation to mid 20s and thats what we got HYPE went from $40 -> $25 j revisited this note and wow... played out amazingly well
that1618guy tweet mediathat1618guy tweet media
English
0
2
10
567
stateofblocks retweetledi
Delphi Digital
Delphi Digital@Delphi_Digital·
Gold's structural cycle still has BTC ahead of it. Gold's 18% pullback from its $5,589 January peak came from three macro drivers: the Warsh nomination sparked hawkish repricing, Operation Epic Fury on February 28 sent oil above $100 and re-accelerated inflation, and the USD rebounded. The PBOC's March 2026 purchase of 5 tonnes was its largest in over a year and brought reserves to 2,313 tonnes, or 9.6% of total reserve assets. Net central bank purchases totaled 244 tonnes globally in Q1 2026, above the prior quarter and the five-year average. 68% of central banks plan to increase gold holdings in 2026, up from 62% last year. The structural bid did not move with the price. Gold and Global M2 have historically led BTC by 3-4 months. The current lag has stretched to 5-6 months. 2020 saw a similar dynamic when COVID delayed the handoff before the cycle re-asserted. The Iran shock may be playing a similar role this cycle.
Delphi Digital tweet media
that1618guy@that1618guy

x.com/i/article/2056…

English
5
7
22
10.1K
stateofblocks retweetledi
that1618guy
that1618guy@that1618guy·
Fwiw shared this note back in early March with @Delphi_Digital members on my view on $BTC vs $GOLD BTC/GOLD ratio was sitting at 12.1 then and it’s now at 17.36 up ~ +43%? Still believe H2 of this year will be meaningful for the ratio as the king corn plays catchup
that1618guy tweet mediathat1618guy tweet media
English
4
2
11
1.3K
stateofblocks retweetledi
that1618guy
that1618guy@that1618guy·
Wow… CPS continues to climb now at 0.9188 while $BTC price grinds out this mid 70k range This is a setup for a large basing area before the eventual blow off -> This is VERY BULLISH for the king corn “BTC is lagging US equities bla bla” “When equities pull back BTC is done”
that1618guy tweet media
that1618guy@that1618guy

$BTC is still showing that patience is strong (CPS up and to the right -> makeup of participants rn have longer term horizons) Yes this rally has real backing to it and no, I don’t think shorting the king corn makes sense here

English
4
2
32
19.2K
stateofblocks retweetledi
that1618guy
that1618guy@that1618guy·
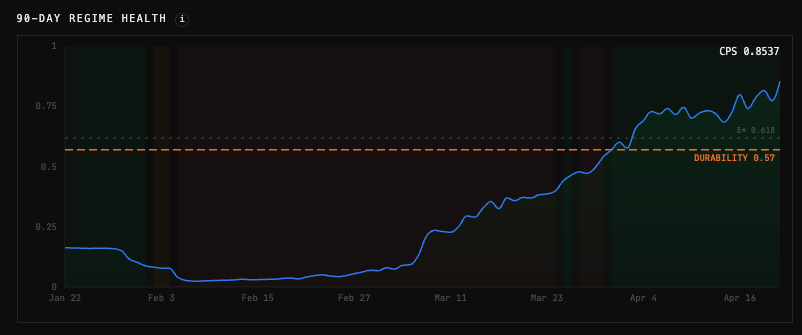
this regime is the healthiest its ever been -> patience continues to climb while $BTC is still held below 80k this current C regime continues to give us clues that it should be durable
that1618guy tweet media
Delphi Digital@Delphi_Digital

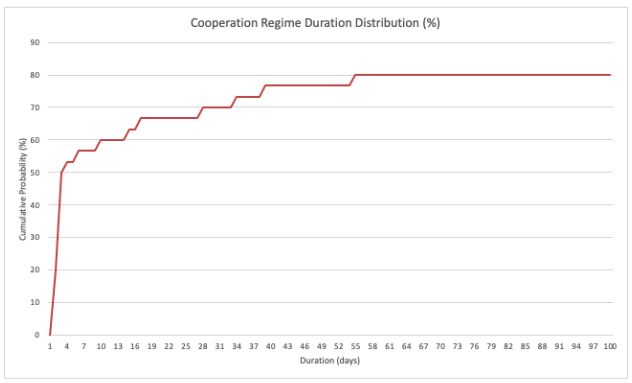
BTC has gained 11% since the Game Theory Dashboard shifted to Cooperation. At Day 21, the return is running ahead of the +5.7% historical mean but still within the normal range. Only 32% of Cooperation regimes make it to Day 21. Of the ones that do, 55% go on to last 100+ days.

English
1
1
12
1.6K
stateofblocks retweetledi
Delphi Digital
Delphi Digital@Delphi_Digital·
BTC recently cleared $75k and the Game Theory model is reading this as a structural shift. The Composite Patience Score (CPS) tracks the balance between patient and speculative capital on a daily basis. It now sits at 0.68, which is comfortably above the 0.57 durability threshold. The Cooperation regime that flipped earlier this week is strengthening instead of stalling. The $75k touch played out within 4 days as the model's base case, and a pullback into the low $72s would be on the expected path for the regime. The first real warning sign would be a decisive break below 0.57 on CPS.
Delphi Digital tweet media
English
9
5
40
5.9K
stateofblocks retweetledi
that1618guy
that1618guy@that1618guy·
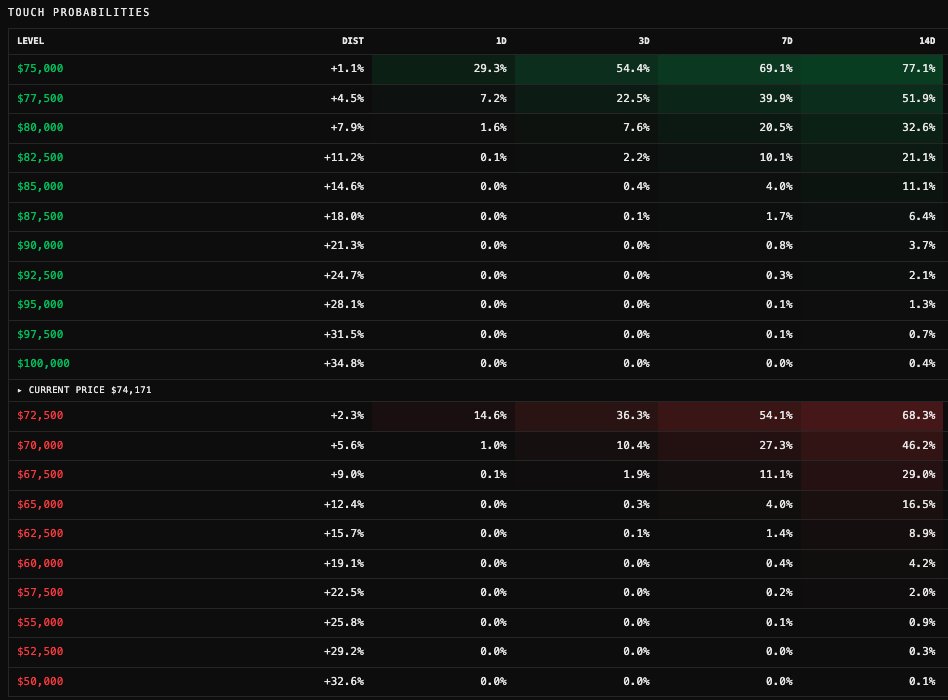
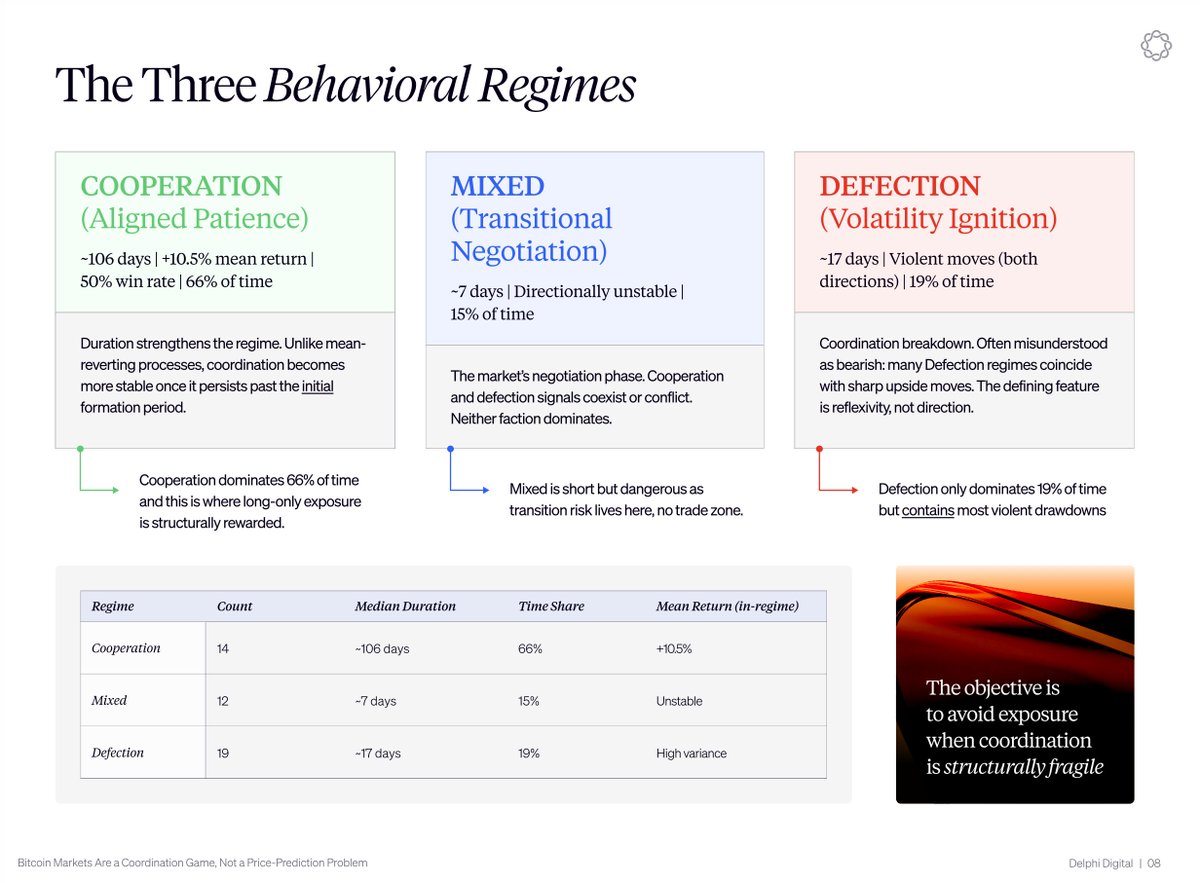
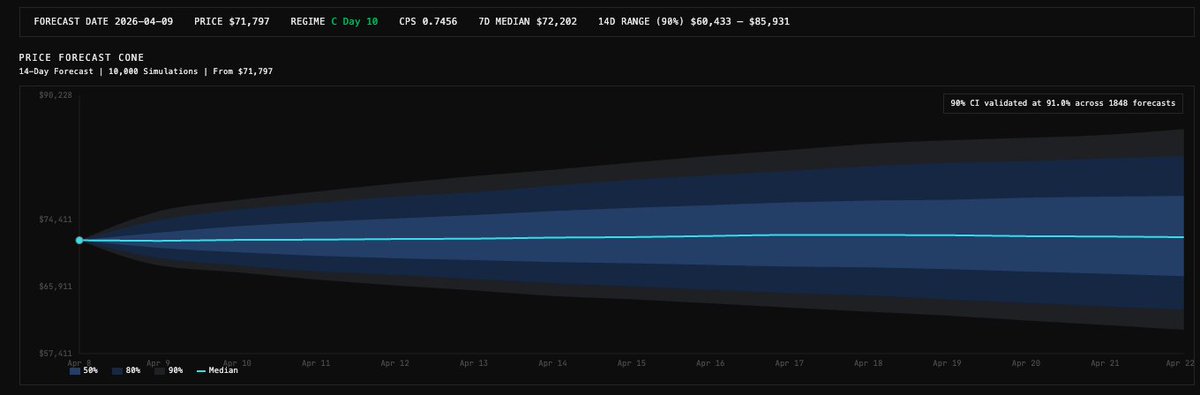
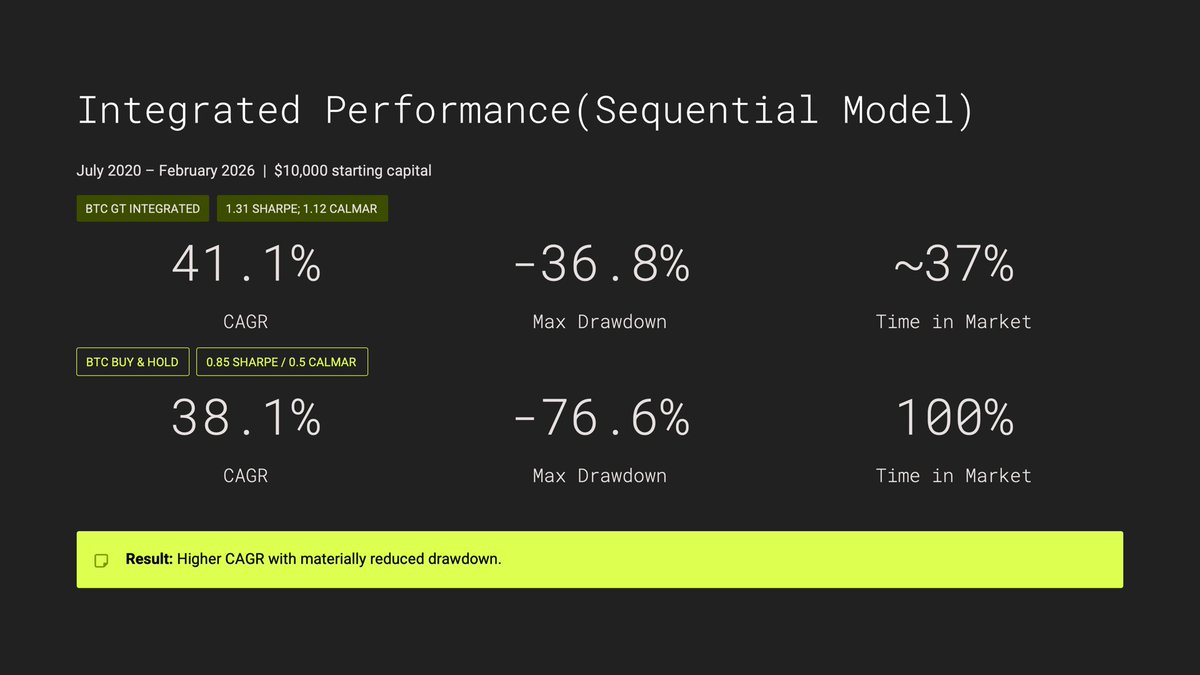
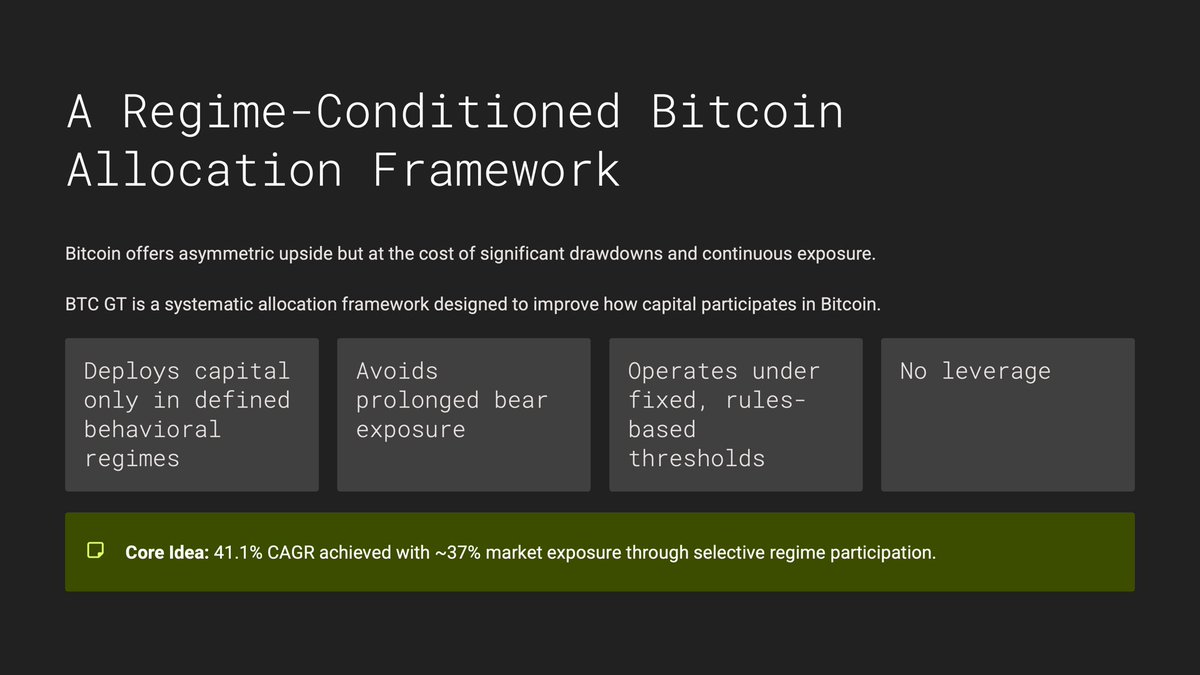
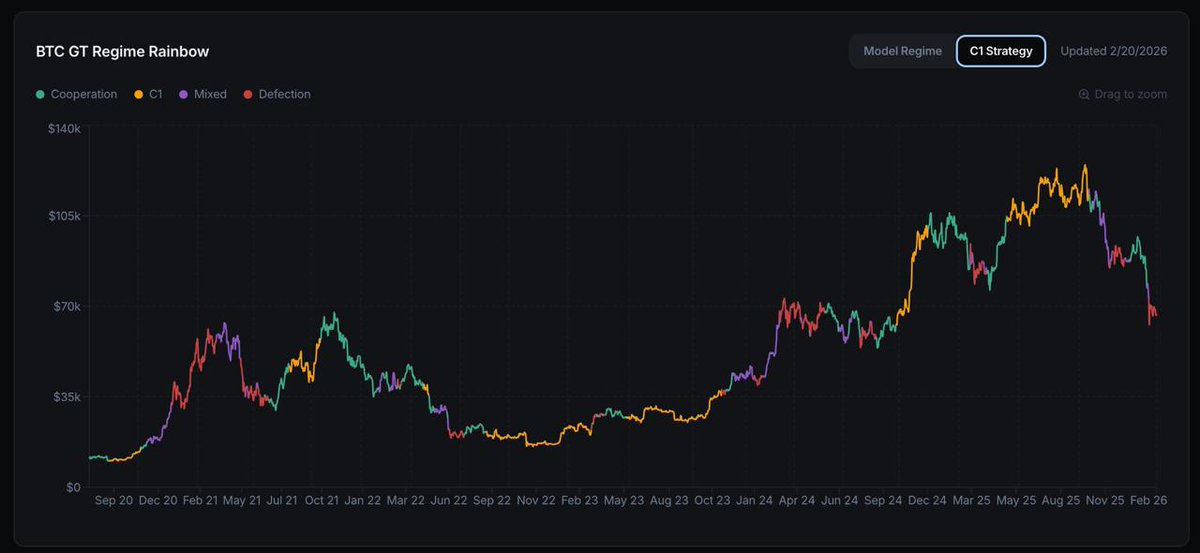
Most people analyze Bitcoin through a price lens. I've spent the last year asking a different question: what if the coordination dynamics between patient and speculative capital matter more than where you think price is headed? I see the Bitcoin market as a repeated coordination game. 2 types of capital show up every day: patient money (ETF holders, LTH accumulators) and speculative money (leveraged perps, momentum desks). Who's running the show at any given time is what actually drives market structure. Here's the tension. When patient capital cooperates, everyone benefits. Ranges compress, positioning builds quietly, and the trend compounds. But defection is always the better short-term play: extract before others do, front-run the move, lever up. The problem is when too many participants do it at once, liquidity degrades, volatility spikes, and everyone gets punished. Classic prisoner's dilemma playing out across thousands of actors with different time horizons every day. That's why Bitcoin cycles look so repetitive. Same structure every time. Most capital destruction doesn't happen at entry, in fact it happens when coordination fractures and you don't recognize the shift until price has already confirmed it. So the question for any allocator isn't "where is price going?" Rather, its "which regime am I in, and is coordination intact or breaking down?" That's what my BTC Game Theory model tracks the 3 behavioral states in real time: > Cooperation: Patient capital in control. 66% of the time. Where long exposure compounds. > Mixed: Transition zone. Nobody's in charge. No trade. > Defection: Leverage and reflexivity take over. 19% of the time but contains the worst drawdowns. Most capital destruction doesn't happen at entry but it happens when coordination fractures and you don't recognize the shift until it's too late. The model flagged both the 2022 bear market and the 2025 decline before price confirmed the breakdown -not by predicting price, but by catching the behavioral shift underneath. Full framework is live now on the Delphi's portal - how the regimes form, why they transition, and the mechanics that kept the model out of both major drawdowns. Bitcoin markets are a coordination game, not a price prediction problem.
that1618guy tweet mediathat1618guy tweet mediathat1618guy tweet mediathat1618guy tweet media
English
7
9
51
11K
stateofblocks retweetledi
that1618guy
that1618guy@that1618guy·
Not every Bitcoin market rewards holding spot Sometimes the edge is trend Sometimes it’s mean reversion Different regime -> different deployment strategy I’ve been building a game theory framework (BTC GT) that identifies the regime first, then allocates capital accordingly Clip from my conservation with @laurashin on @Unchained_pod
English
2
2
15
2.4K
stateofblocks retweetledi
that1618guy
that1618guy@that1618guy·
Research via @Delphi_Digital otw on how my BTC GT model works first then followed by custom CTA strategies i've layered on top of it going to be a banger, stay tuned 🫡
that1618guy tweet mediathat1618guy tweet media
Delphi Digital@Delphi_Digital

Our analyst @that1618guy built the Game Theory Rainbow Chart which identifies when Bitcoin players are coordinating to accumulate and when they're acting in self interest. It breaks into two regimes. Cooperation is when volatility drops, long-term holders start tilting up and exchange balances go down. Players are working together to keep price low and buy more. Defection is the opposite. Volatility spikes, whale inflows pick up, funding and open interest stay elevated. What's interesting is how differently these regimes behave. Defection burns out fast. Cooperation is sticky. Once it takes hold, the longer it runs the more likely it continues. Right now we're 25 days into a defection regime which is unusually long. On the chart, green zones represent cooperation. Orange zones represent optimized cooperation regimes that have persisted long enough to signal durability. Historically these have been the most attractive periods for allocation.

English
1
1
11
1.9K
stateofblocks retweetledi
that1618guy
that1618guy@that1618guy·
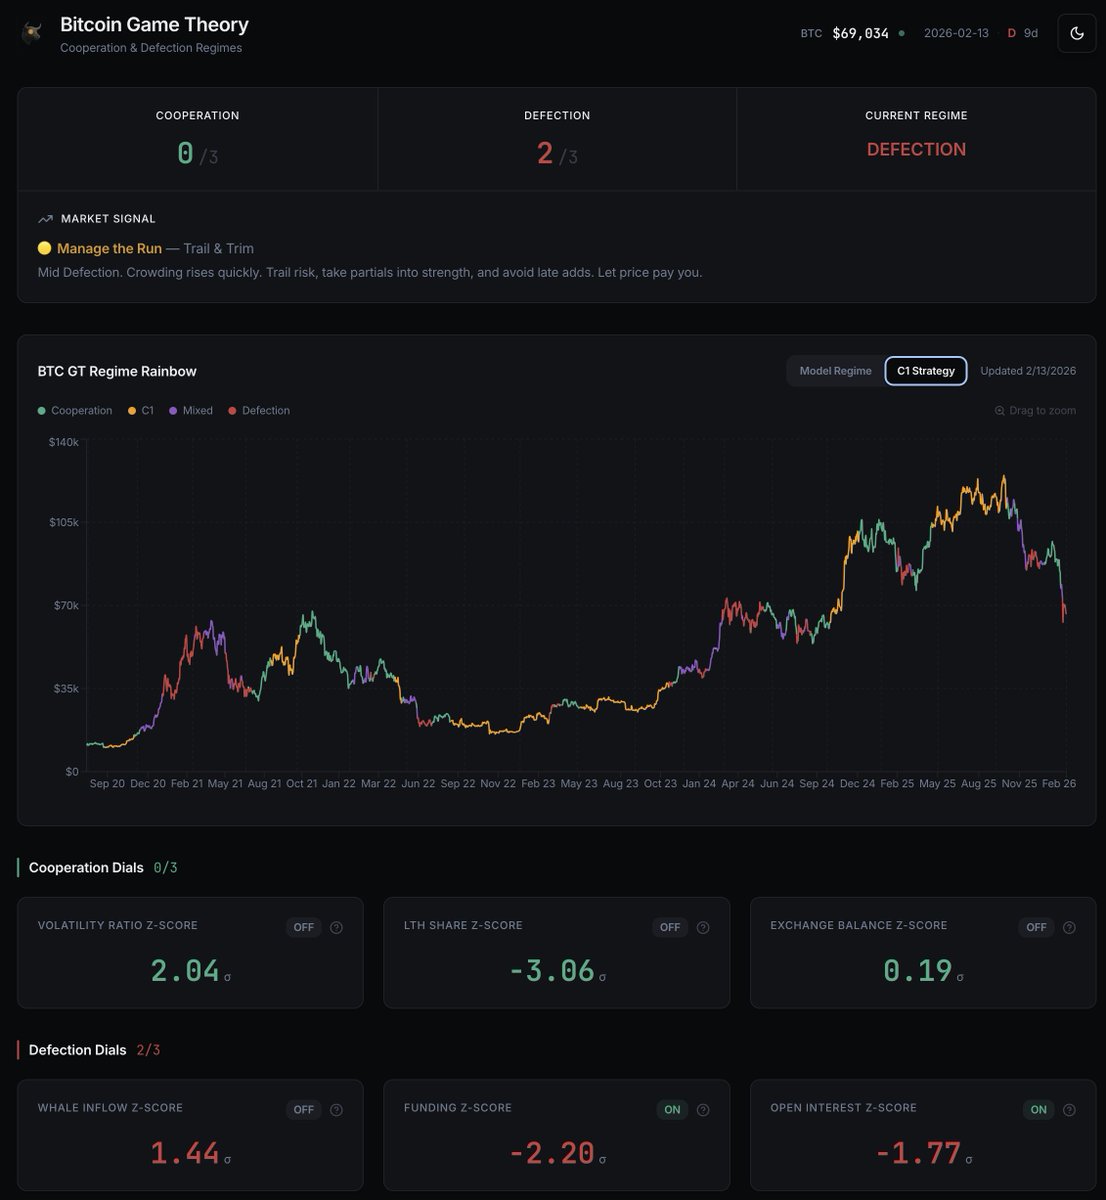
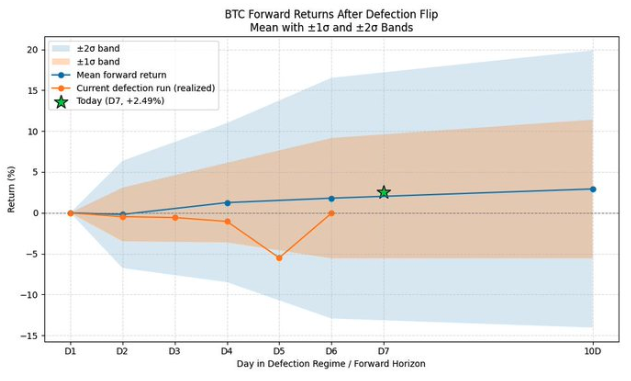
BTC Game Theory Model Update Currently in Day 15 of Defection - Capital preservation is the current model's position Only 20% of D regimes have lasted this long, most burn out within a week Price is +7.8% from regime start but the historical mean at this point is +1.6% and D regimes have no reliable directional edge Cooperation signals haven't reformed and until they do and survive the persistence filter, there's nothing to act on. The model is still staying in cash.
that1618guy tweet mediathat1618guy tweet mediathat1618guy tweet media
English
2
1
9
1.5K
stateofblocks retweetledi
that1618guy
that1618guy@that1618guy·
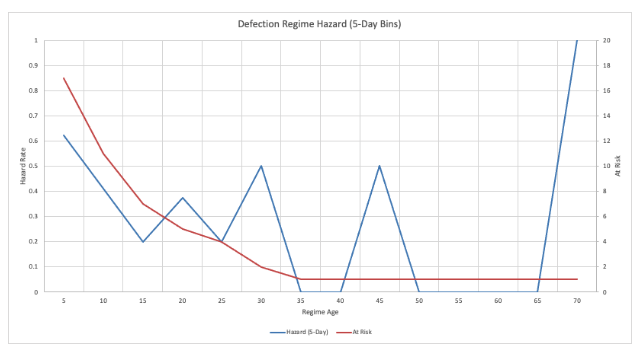
Refreshed my BTC Game Theory model dashboard UI + minor logic tweaks Pushed: -> GT regime rainbow model + strategy toggle -> new data pipelines to keep UI current -> simplified overview of current regime -> cleaner more professional UI In the works: -> more stats on each regime's hazard rates (i.e. By Day 9, Defection regimes face an 85% hazard rate, meaning only 15% survive to Day 10) -> more stats on regime's Persistence rates (i.e. Once Cooperation regimes reach Day 20, 72% continue to persist through Day 40) -> tradable strategies for regime mean deviation (i.e. Day 5 Defection out of the S.D.; therefore a mean reversion play to the baseline etc + much more, just need time to build / test. Cheers.
that1618guy tweet mediathat1618guy tweet mediathat1618guy tweet mediathat1618guy tweet media
English
1
1
6
1.1K
stateofblocks retweetledi
that1618guy
that1618guy@that1618guy·
revisiting this ... $AVAX 1W 9/21 EMA downside cross did in fact play out very closely to the levels we were looking at was looking at the $10 levels to be hit and we got to $11.1 most of the drop has occurred from the downside cross already, the next obvious trade will be the reverse - when the upside cross happens
that1618guy tweet media
that1618guy@that1618guy

$AVAX just got the 1W 21/9 EMA downside cross what now? Last post on this the upside cross that we tracked gave us a +50+% return to the $35 range. Now, the downside trade has just triggered This setup has triggered a total of 7 times and 6 times out of the 7 has led to bear market type of pullbacks (smallest drawdown still in the -49% range). The only 1 other time was a fakeout, which resulted in an upside cross immediately 1W after (see first blue arrow) Now, although statistically speaking this cross if confirmed will initiate targets at minimum to the $10 level if it plays out similarly to past times. However, there is some hopium that this downside cross might be a fakeout like what we have seen before. If this is the case, we will need to see the EMAs put in the cross back up very very soon (imo in the next 1-2 candles max) Conditions now for a cross up is a closure above 20.44 for the weekly (subject to change live per price action). Personally, i think for charts like $AVAX, it's literally now or never. If there is a chance that the fakeout happens, it should be within 1-2 weeks. Personally, i'd like to remain optimistic first and give the chart a fighting chance The fakeout trade if plays out, returns ~57-60% and has played out two times in total (see big red arrows). This gives us a target of ~$30-31 if the upside plays out from here. Going into November... there is still a chance that the fakeout plays out. Cause if not, $10 is the breakdown target based on past occurrences.

English
0
1
5
1.9K
stateofblocks retweetledi
that1618guy
that1618guy@that1618guy·
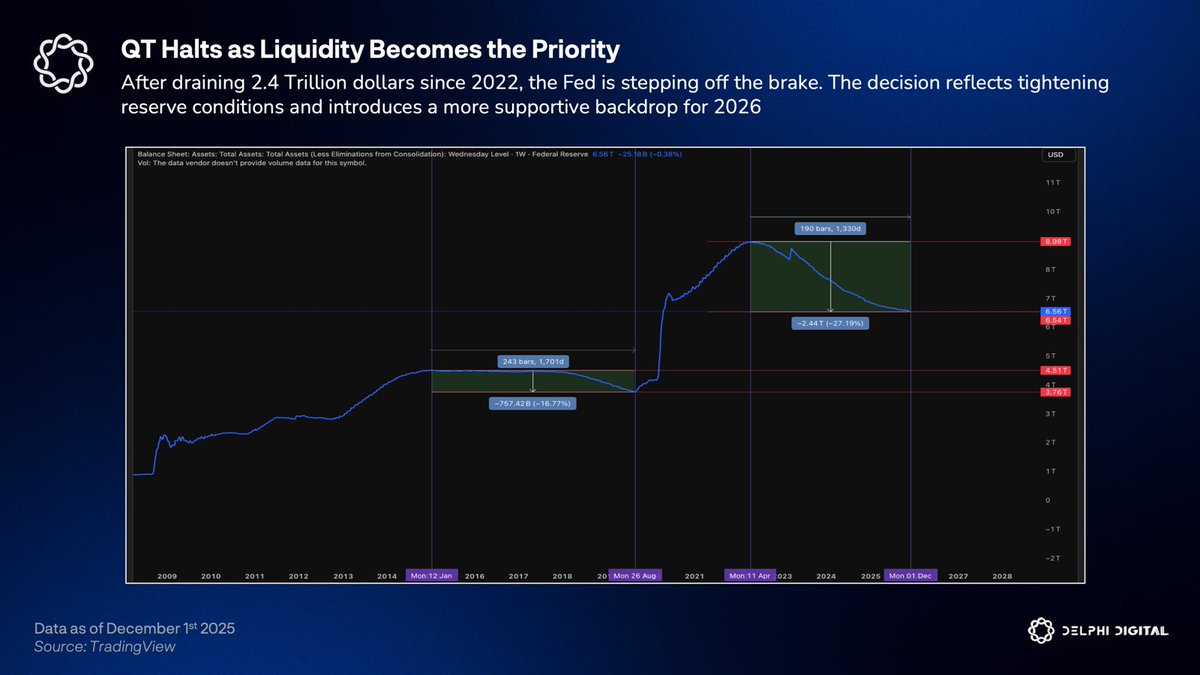
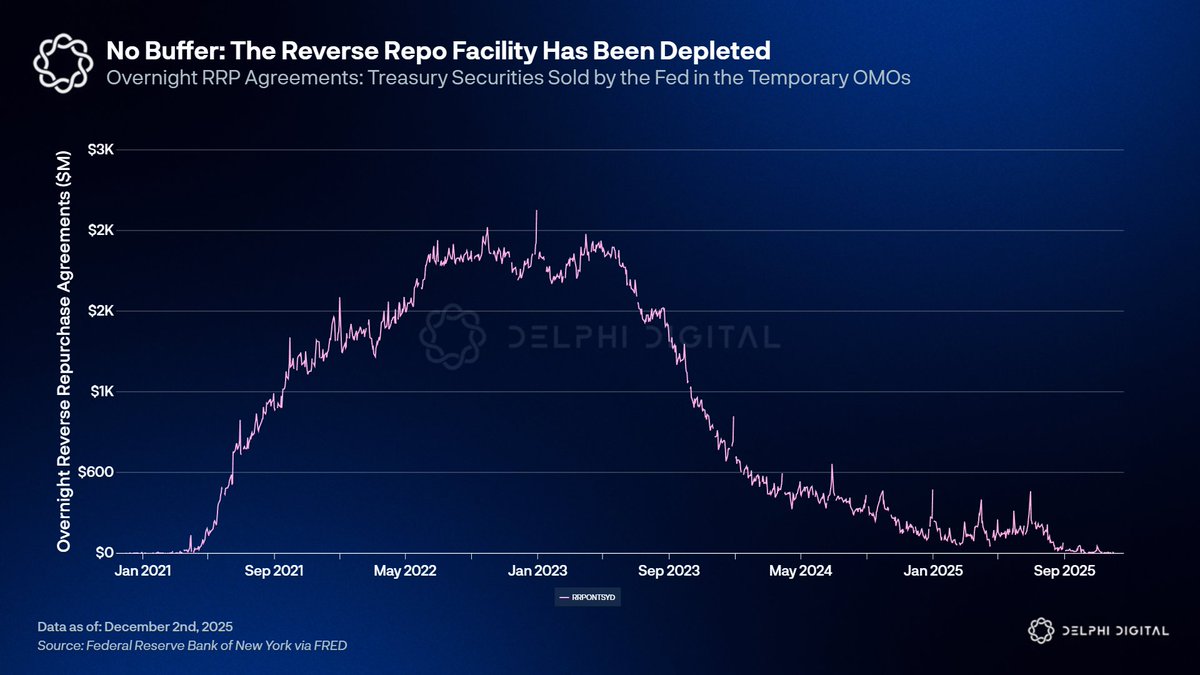
2026 Shifts the Focus to Liquidity Expansion The liquidity regime that defined crypto's struggle over the past 2 years is finally turning. After pulling roughly $2.4T out of the system since 2022, the Fed officially halted QT on Dec 1st - the first real inflection in U.S. liquidity conditions since the tightening cycle began. QT pushed bank reserves from their highs toward the lower edge of the Fed’s comfort zone. On top of tightening liquidity, we had the Treasury General Account (TGA) refill in Q3 of this year. Throughout the quarter, the TGA acted like a slow vacuum by pulling dollars out of circulation. The balance surged to nearly $1T as the government front-loaded bill issuance through a year of political noise. This time there was no Reverse Repo Facility (RRP) to absorb most of the impact like it did in 2023. The liquidity came mostly out of bank reserves. ON RRP has collapsed from more than $2T to effectively 0 and bank reserves took the hit this time, putting pressure on the Fed’s to end QT and prioritize liquidity stability instead. Coming into 2026, the Fed should continue to further loosen financial conditions by drawing down the TGA. Even though it will not resemble the 2020 style "liquidity flood" but it is the first genuinely supportive flow environment crypto has seen since early 2022. Our Year Ahead in Markets report breaks down the full liquidity setup, the structural case for gold and how this regime shift reshapes the landscape for digital assets.
that1618guy tweet mediathat1618guy tweet mediathat1618guy tweet media
English
6
4
34
11.2K