
Mr. Marbles
851 posts

Bitcoin & Altcoins: Breakout...
Why This Time It's Different 🔥
Watch Here: 👇
youtu.be/OsGsaKYxIiE
YouTube

English

$BTC
It's coming...
Keep shorting.

LP@LP_NXT
$BTC The next pump will be expected, yet most will still miss the move. Keep shorting and lowering your targets, bears... Higher first. Lower high in July. ⏳
English
@APompliano You are not a 50/50 guy? I guess you are grabbing the check all the time then?
English

I never trust a man that wants to split a check at dinner.
English
$BTC Bullish Trifecta (HTF)
67k - 72k is inevitable...
1. RSI Bullish Divergence
2. Falling Wedge
3. Cup and Handle
Mic Drop 🎤

English


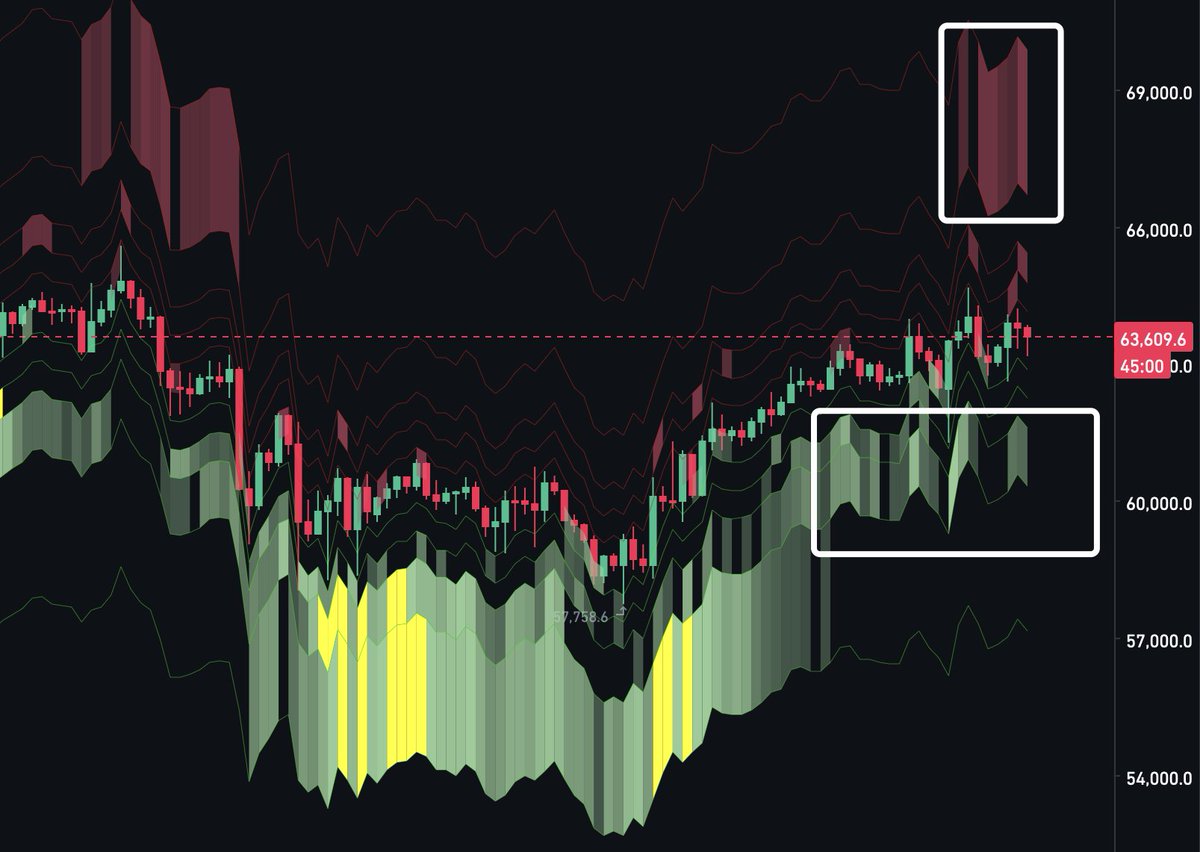
$BTC 7-Day Liquidation Heatmap
It would be assumed 65k is swept next.
However, MM's have been really good about front running these levels. 🥕
Think we see 65k this weekend / today?

English


@LP_NXT And I would think next Fed meeting would be time to go to cash
English
bitcoin:native
Don't lower your targets.
If another sweep comes, I'm deploying my final 15%.
58–52K has been my bid zone from the start, and it still is.
The plan remains the same, sell higher over the coming years.

LP@LP_NXT
$BTC Keep lowering your targets. I'm a buyer here and on a sweep of 60K. I've said it before, and I'll say it again 60K before the end of July...
English
@astronomer_zero What happens after 66? You think we keep going higher into end of July before downside?
English

$btc
Still letting the bullish sentiment resolve further.
Wishing you all an excellent morning or evening wherever you may be located.
Not going to waste your time too much with this post.
But just pressing the gentle reminder to let the local bullish sentiment we have seen at 64.3k resolve further.
Where 64.3k was our key level of action (taking profits, locking in the W), now is a moment of inaction (doing nothing - for me).
And both actions are important to support the balance of timing the market well...
I already mentioned this clearly as well, but I should remind you again that this "bullish" sentiment we saw at 64.3k is local and not as strong as the bearish sentiment we saw sub 60k, so this developing pullback is in my view nothing but an internal pullback (one that doesn't make lows below the excessive bearish sentiment we have seen sub 60k).
Ideally, we develop a divergence, with higher lows in price, lower lows in sentiment.

Astronomer@astronomer_zero
$btc Hourly range retested, and daily range target now entered ✅ TP's taken in last post (slight local sentiment shifts). The Monday move led us to retest the hourly range high, bouncing us higher into my daily first main target area. Also seeing some slight "ha, told you the rally in July is coming" type of engagement-oriented posts, backed by some "science" (just one or two data points from prior cycles, pure bias fitting, because again if it didn't happen, it would not have been talked about). In my opinion a little bit too much of that too early now. So just to remind you that this is contribution to some slightly local bullish sentiment we are seeing now and these posts made before into the lows (as hedges) would never have been talked about if we just went lower from 58k lows, but they are created to keep engagement to their accounts "just in case" we rally. Indeed nothing but local bullish sentiment contribution. Nothing major and not as big as the bearish sentiment near the 58k lows, but it's an observation, and it validates why I TP'd my second long from higher into my daily first main target area at 64.3k, so that the win is locked in and we can wait patiently for next target which could take some time. Do not worry though, time is good, time resolves sentiment and your patience is a weapon. But it explains why I believe TP'ing and locking in the W of the second trade is the optimal move of execution today. The trade is up 2.5RR, and no trade up 2.5RR should ever not become a win.
English
$BTC
Local bottom. ✔️
Order book pressure continues to show strong bids stacked just below price, providing support. Some sell pressure is building around 69K, but not enough to suggest a significant move lower.
As long as buy pressure remains below price, 67K is the next major target. ⏳
LP@LP_NXT
$BTC Order book pressure shows strong bids stacked just below price in the mid-50Ks, with very little sell pressure overhead. Historically, this type of buy pressure tends to appear near local bottoms. If this area holds, a move into 68–69K becomes increasingly likely, where sellers have previously stepped in. This is a crucial level to watch.
English
English


Basket for the cycle is $BTC $SOL $SUI $HYPE solana:oreoU2P8bN6jkk3jbaiVxYnG1dCXcYxwhwyK9jSybcp
English

@LP_NXT Cool. Looking forward to following you during crunch time. Any thoughts on where we go after? You think we shoot for that 54 range everyone is looking for?
English
@stephenhus Late July, in my opinion, although it could extend into early August.
I'm targeting the 68–69K area, with a possible extension into the low 70Ks depending on how price develops.
English
$BTC
Keep shorting.
I remain long...
The games have begun. 🎲

LP@LP_NXT
$BTC I'm long. Lower high in July. Let the games begin. 🎲
English

🚨 BREAKING: This statement from @UEFA cannot be understated - this will have huge implications on the tournament moving forward and the relationship between Europe and FIFA.
What do you all think of this situation?
UEFA@UEFA
UEFA statement on the Balogun case: ⬇️ uefa.com/news-media/new…
English