Tim de Silva

1.6K posts

Tim de Silva banner
Tim de Silva

Tim de Silva

@timdesilva

Economist @StanfordGSB | Likes Fast Cars

Palo Alto, CA Katılım Temmuz 2009
683 Takip Edilen1.9K Takipçiler
Tim de Silva retweetledi
Luis Garicano 🇪🇺🇺🇦
The elasticity of derived demand is always higher than the world thinks. More generally: for every disruption there are many more margins of adjustment than people anticipate. See Ukraine, Covid (Zoom!). Adjustment is the magic of capitalism.
Javier Blas@JavierBlas

While we await for the deal, I think we can already highlight a few oil lessons: 1) Although we don’t yet understand how, China can reduce oil imports massively (>5m b/d cut) 2) Saudi/UAE bypass pipelines work 3) OECD nations can release their SPR at flow rates of >2.5m b/d

English
1
18
58
12.1K
Tim de Silva retweetledi
Luis Garicano 🇪🇺🇺🇦
I write today in Silicon Continent with Jesús Saa-Requejo "Three Theses on AI Value Capture". We argue that the leading AI labs are betting hundreds of billions on the idea that holds the best model captures the value. We think that's the wrong bet. The model layer is squeezed between customers who can switch with a simple change in configuration and suppliers who are each monopolists. Our hypothesis is that the surplus flows past the labs, to chips above and implementation below. Hence the country that wins AI is not the one with the tokens on the frontier model. It's the one that is best able to implement the technology. siliconcontinent.com/p/three-theses…
English
11
29
112
58.4K
Tim de Silva retweetledi
Adam Tooze
Adam Tooze@adam_tooze·
If housing were more affordable in the UK and the US, the birth rate might be slightly higher but it would not reverse the overall trend. More at today's Chartbook Top Links!
Adam Tooze tweet media
English
5
19
94
14.1K
Tim de Silva retweetledi
Jesús Fernández-Villaverde
Jesús Fernández-Villaverde@JesusFerna7026·
This map, from @prabhavjain85, is fascinating. Much of India already has TFRs on par with those of Western Europe or Latin America. Look at West Bengal, Tamil Nadu, or Kerala: 1.3! That is below Brazil’s (1.52) or the United Kingdom’s (1.44) and getting close to Italy’s (1.14). If you are going to tell me some hypothesis about India’s family structure being “different” (i.e., higher marriage rates) in keeping fertility high, you’d better have a good explanation for West Bengal, Tamil Nadu, and Kerala. At the same time, you still have Bihar at 2.9 and Uttar Pradesh at 2.6. So right now, the best way to think about India demographically is as two distinct countries: a region with a high TFR and a region with quite a low TFR. Of course, this will have large consequences for the internal politics of India.
Jesús Fernández-Villaverde tweet media
English
45
101
500
47K
Tim de Silva retweetledi
Jesús Fernández-Villaverde
Jesús Fernández-Villaverde@JesusFerna7026·
Let me lay out the unpleasant arithmetic of the replacement rate, and why a modern society finds it so hard to reach. A population of 100 women in an advanced economy needs 210 children to replace itself. Why? Absent sex-selective practices, roughly 105 boys are born for every 100 girls. Evolution overshoots male births because boys are more prone to early death from accidents and disease. Therefore, of 210 children, about 108 are boys and 102 are girls. Not all girls reach the midpoint of their fertile age: accidents, suicide, homicide, and illness take some. In an advanced economy, about 98% of them survive, leaving 100 women to replace the original 100. Now consider the distribution of children per woman. Imagine 15 women have no children. Five do so by choice, for various reasons (professional, affective, religious). Ten face unfixable fertility problems, theirs or their partner’s. The 10% figure is conservative: the medical literature points to around 13%, and that does not even count male fertility problems. Of the remaining 85, 10 have one child, 60 have two, 10 have three, and 5 have four. I am stopping at four to keep the post concise; very few women in younger cohorts have five or more children, but I could adapt the example to account for them. Hence, the 100 women in this population have 180 children, for a completed fertility rate of 1.8. Interestingly, this is roughly the rate we saw in many advanced economies until the early 1990s, and in the U.S. until around 2008. But we are still 30 children short of replacement! Voluntary childlessness is only 5%. Three-quarters of women have two or more children. Look around: most of your friends will have two, plenty will have three or four. And yet, we are well below replacement. You would not look at this population and call it selfish (is having two kids hedonistic?) or accuse it of losing family values (only 5% of women are choosing voluntarily not to have children). The point is simpler. To reach 210 births, you need a substantial share of women to have three or more children. Two as the “normal” pattern will not get you there. And modern society makes three or more a costly proposition for most families. Of course, current fertility rates in most advanced economies are well below 1.8. But my point is that, under present social arrangements, we should not expect 2.1, even if (to humor last weekend’s debate) we banned smartphones and TikTok. We need many, many more families with three or four children. More pointedly, there is no self-regulating mechanism that pushes a society back to 2.1. The market-clearing analogy many economists use is flawed; scarcity feedback does not work the same way. (Another post on this another day.) And, as I often read, the claim that “nature” somehow regulates current overpopulation is just childish mumbo jumbo. So yes, the arithmetic of replacement rate is unpleasant.
Jesús Fernández-Villaverde tweet media
English
140
373
1.8K
1.5M
Tim de Silva retweetledi
Jesús Fernández-Villaverde
Jesús Fernández-Villaverde@JesusFerna7026·
Smartphones are not the explanation for the recent decline in fertility. Instead, they are an accelerator of deeper forces already at work. Let’s start with the facts. Fertility is falling almost everywhere: in rich, middle-income, and poor countries; in secular and religious countries; and in countries with high and low levels of gender equality. The decline accelerated around 2014. So, no country-specific explanation will work unless you are willing to believe that 200 distinct country-specific explanations arrived at roughly the same time. Smartphones look like the obvious candidate: the first iPhone was released in 2007, and global adoption has been astonishingly fast. Economists understand the first major decline in fertility in advanced economies, from 6 or 7 children per woman throughout most of human history to about 1.8, that occurred between the early 1800s and roughly 1970, well before smartphones. The main drivers were a sharp fall in child mortality (effective fertility was rarely above 3 and often close to 2) and the shift from a low-skill, rural agrarian economy to a high-skill, urban industrial one. We have quantitative models that fit these facts well. Country-specific factors mattered too, of course. Proximity to low-fertility neighbors accelerated Hungary’s decline, while fragmented landowning structures accelerated France’s. But these were second-order mechanisms. This is also why most economists long considered Paul Ehrlich’s doom scenarios implausible. We forecast that fertility in middle- and low-income economies would follow the same path as in the rich, probably faster, because reductions in child mortality reached India or Africa at lower income levels (medical technology is nearly universal, and most gains come from handwashing and cheap antibiotics, not Mayo Clinic-level care). Much of what we see in Africa or parts of Latin America today is still that old story. But in the 1980s, a new pattern appeared. Japan and Italy fell below 1.8, the level we had thought was the new floor. By 1990, Japan was at 1.54 and Italy at 1.36. This second fertility decline began in Japan and Italy earlier than elsewhere, driven by country-specific factors, but the underlying dynamics were widespread: secularization, an education arms race, expensive housing, the dissolution of old social networks, and the shift to a service economy in which women’s bargaining power within the household is higher. The U.S. lagged because secularization came later, suburban housing remained relatively cheap, and African American fertility was still high. U.S. demographic patterns are exceptional and skew how academics (most of whom are in the U.S.) and the New York Times see the world. My best guess is that, without smartphones, Italy’s 2025 fertility rate would be about 1.24 rather than 1.14. I doubt anyone will document an effect larger than 0.1-0.2. Italy was at 1.19 in 1995, not far from today’s 1.14. The TFR is cyclical due to tempo effects, so I do not read too much into the rise between 1995 and 2007 or the decline from 1.27 in 2019 to 1.14 today. The direct effect of smartphones is not zero, but it is not, by itself, that large. Where social media, in general, and smartphones, in particular, matter is in the diffusion of social norms. What would have taken 25 years now happens in 10. Social media are not the cause of fertility decline; modernity is. But they are a very fast accelerator. That is why social media are a major part of the story behind Guatemala (yes, Guatemala) going from 3.8 children per woman in 2005 to 1.9 in 2025. Without them, Guatemala would also have reached 1.9, just 20 years later. Modernity, in its current form, is incompatible with replacement-level fertility. By modernity, I do not mean capitalism: fertility fell earlier and faster in socialist economies than in market economies. Socialist Hungary fell below replacement in 1960, and socialist Czechoslovakia in 1966 (both experienced small, short-lived baby booms in the mid-1970s). By modernity, I mean a society organized around rational, large-scale systems and formalized knowledge. Countries will not converge to the same fertility rate. East Asia is likely stuck near 1, possibly below, given its unbalanced gender norms and toxic education systems. Latin America faces the same gender problem plus weak growth prospects, so I expect something around 1.2. Northern Europe has more egalitarian family structures and might hold near 1.5. The very religious societies are probably the only ones that will sustain 1.8. All of this could change with AI or changes in population composition. We will see. But on the current evidence, deep sub-replacement fertility is the “new new normal.” Unless we reorganize our societies, better learn to handle it as best we can.
Jesús Fernández-Villaverde tweet media
English
220
913
3.7K
884.3K
Tim de Silva retweetledi
Luis Garicano 🇪🇺🇺🇦
No smoking gun, but the preponderance of evidence points to smartphones, not economics, as the culprit for the global drop in fertility: • In the US and UK, births fell first and fastest in areas that got 4G earliest • Birth rates were stable in the US, UK and Australia until 2007; in France and Poland until 2009; in Mexico and Indonesia until 2012; in Ghana, Nigeria and Senegal until 2013-15 Each of these inflection points matches local smartphone adoption (see picture). • The younger the age group, the sharper the drop. • in-person socialising among young adults is dropping. In SK, by 50% in 20 years • Sexual dysfunction is higher among heavy social media user • Effect is largest in culturally traditional societies — Middle East, Latin America, sub-Saharan Africa • Decline holds across countries hit hard by GFC 2008 and those not hit, fast-growing and not growing. Excellent again @jburnmurdoch. ft.com/content/fba35e…
Luis Garicano 🇪🇺🇺🇦 tweet media
English
312
1K
4.6K
1.4M
Tim de Silva retweetledi
Crémieux
Crémieux@cremieuxrecueil·
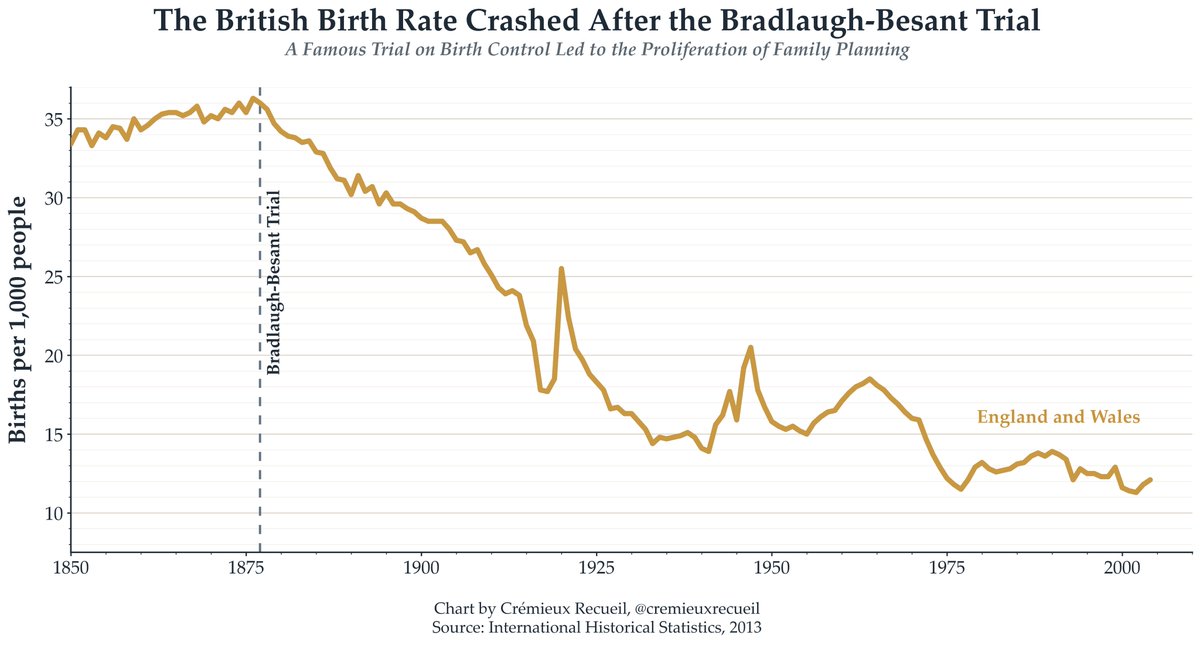
British fertility abruptly fell after one important court case: the Bradlaugh-Besant trial🧵 You can see its impact very visibly on this chart:
Crémieux tweet media
English
35
171
2.3K
290K
Tim de Silva retweetledi
Jesús Fernández-Villaverde
Jesús Fernández-Villaverde@JesusFerna7026·
Ask and you shall receive. I slowly increase life expectancy from 77 to 100 over time to match historical patterns. Year | Population | e0 ---------------------------------------------------------------- 0 | 65809011 | 77.0 25 | 55494906 | 79.9 50 | 42257304 | 82.8 100 | 15135338 | 88.5 150 | 4831254 | 94.2 200 | 1511262 | 100.0 So, in 50 years, we drop to 42 mil.
Jesús Fernández-Villaverde tweet media
English
3
1
40
5K
Joe Weisenthal
Joe Weisenthal@TheStalwart·
Everyone scoffs typing "what stocks should I buy?" into ChgtGPT and expecting good answers. But I still don't totally get it. If a human could theoretically be good at stock picking, why not a machine trained to think like a human bloomberg.com/opinion/newsle…
English
93
9
284
103.9K
Tim de Silva retweetledi
Hanno Lustig
Hanno Lustig@HannoLustig·
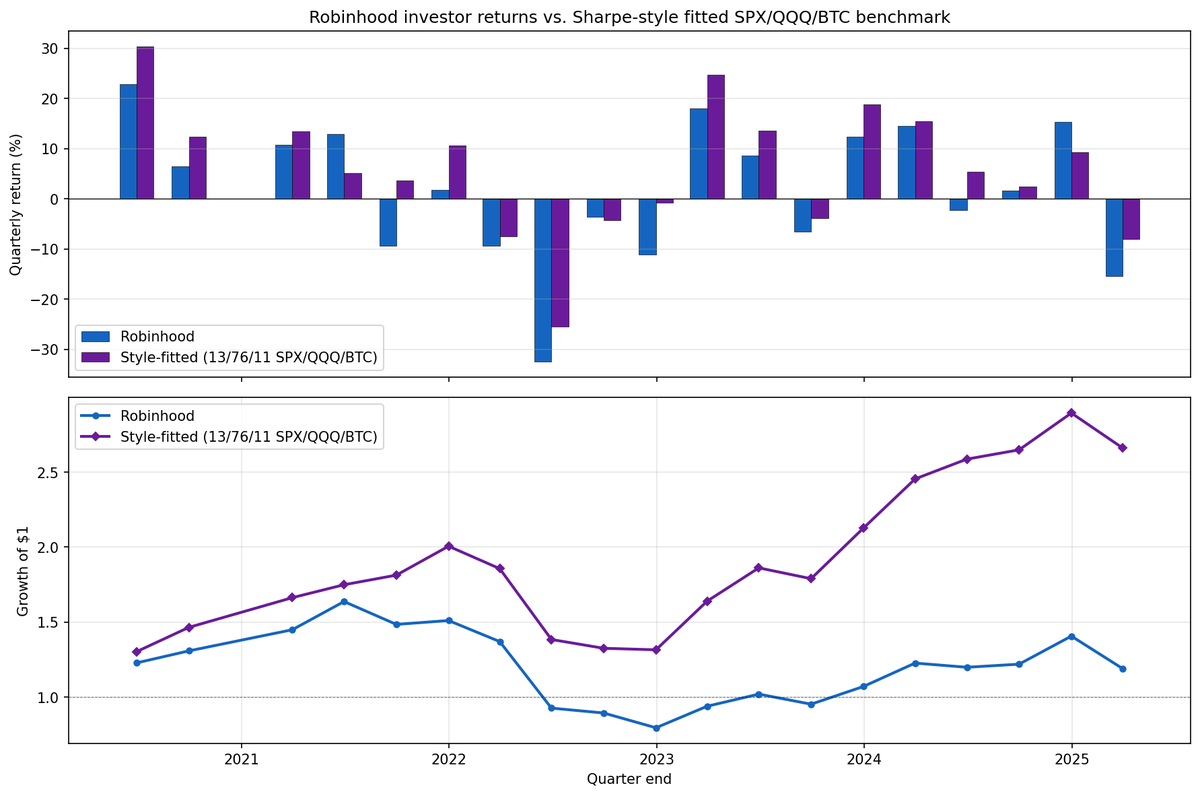
How do Robinhood investors do in aggregate? Not very well. They manufactured more than 15% in negative alpha per annum between 2020 and 2025 for more sophisticated investors to harvest. Plot below of aggregate Robinhood returns against a 13/76/11 SPX/QQQ/BTC fitted benchmark. The real cost of access to zero-commission platforms for retail investors is perhaps best understood as a behavioral one. These investors can’t help themselves, trade way too much and don’t seem to have market timing ability. Maybe they’re just having a bit of fun but this seems like an expensive pastime. thetwocents.substack.com/p/modern-day-r…
Hanno Lustig tweet media
English
4
25
132
21.8K
Max Miller
Max Miller@mjmill611·
Full transparency, I tend to be a bit more on @JesusFerna7026 side on where we should be focusing effort, but I just want to address the first point because I've seen a few people post it. I think it comes from a World Bank blog post from 2016. I had Perplexity Computer take a stab at figuring out how many recent NBER Dev Conference papers (2021-2025) were RCTs and it came out to around 45% not 10%. It's about 48% for Summer Institute and 40% in the DEV/BREAD meetings. I say this because I think its important that we agree on the basic facts. I'm not taking a stand on whether 45% is high or low, but it's certainly a lot larger than 10%.
Rachel Glennerster@rglenner

@JesusFerna7026 1. 10% of dev econ papers in top 14 journals are RCTs. 2. Picking 1 successful country & asking why it grew suffers from survivor bias. Almost all LMICs had industrial policy. 3. Good evid agriculture tech, demographics, edu (ie micro) led to structural trans, so we study them.

English
6
18
114
17.9K
Tim de Silva retweetledi
Annamaria Lusardi
Annamaria Lusardi@Dr_AnnaLusardi·
What Is Financial Literacy and Why Is It Important? Glad to see that our research is cited by the National Conference of State Legislatures ncsl.org/news/details/w…
English
0
4
11
629
Tim de Silva retweetledi
Aniket Panjwani
Aniket Panjwani@aniketapanjwani·
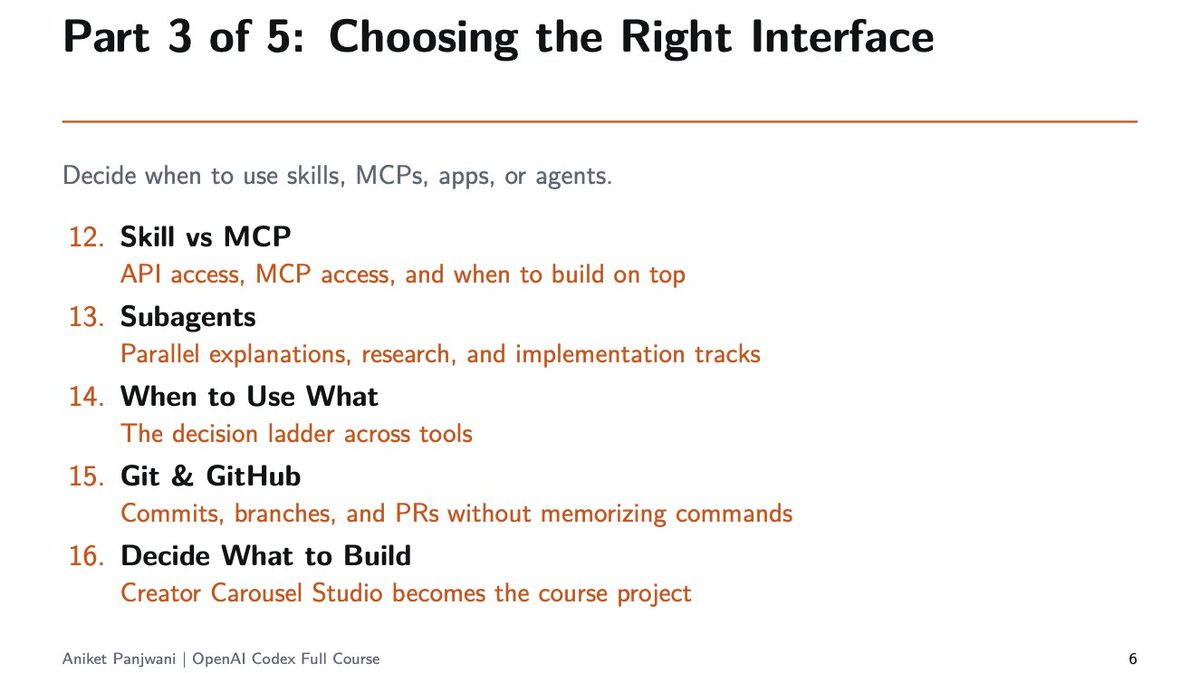
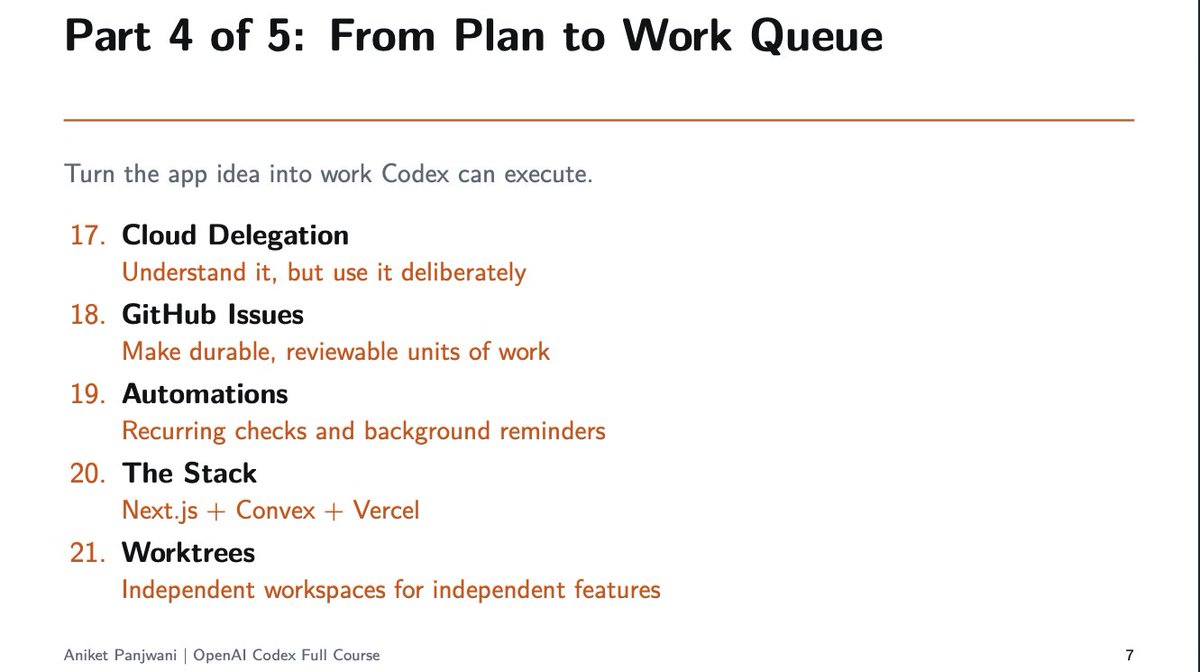
I just finished recording a free, 4+ hour course on the Codex Desktop App, with about 75% edited so far. 10 things I learned in the process of making the course: 1. OpenAI has killed it on interface - they're a clear level above Anthropic. It was such a pain in the ass to figure out how to add plugins in the Claude Desktop app's UI (wtf are "Connectors"), where as Codex makes them obvious and easy to install - just click on the button "Plugins". 2. gpt-5.5 xhigh can be overkill. I recommend xhigh for backend work, medium for frontend work and writing. Switch to xhigh/high if you find medium not doing enough for you. 3. Codex limits you to 6 subagents at a time. This is kind of limiting compared to Claude Code, which supports as many as 16 (?). I like having those parallel subagents for some code review workflows, and they don't work as well out of the box with Codex. 4. Codex subagents must be invoked explicitly by user request, where as Claude Code will frequently invoke subagents for you. 5. In Codex, plugins cannot include subagents. I hope this changes soon! Subagents do seem deemphasized overall in Codex relative to Claude Code. 6. If you're often hitting your weekly Codex limits, don't turn on fast mode early in the week. I was running 6-8 agents in parallel in a big burst of work on some 14 hour days on fast mode with gpt-5.5 xhigh, and I hit my weekly limits in 2.5 days! Instead, switch to fast mode toward the end of your week with the intention of ending it at close to 0. 7. Auto-review permission mode works pretty well! I still prefer Full Access + Destructive Command Guard for most of my work. But I'll teach it as default for most people, Claude Code's auto mode doesn't seem as good. 8. Cloud agents - at least according to the docs - are limited to gpt-5.3-codex as the latest available model. And there's no way to set up their environment in an infrastructure as code - type way. Doesn't seem to be an emphasis for OpenAI right now. 9. Codex skills come with an "openai.yaml" file which when configured, add some polish in the Codex desktop app, and also some optional dependencies. It confused me the first time I saw it! 10. It would be nice for Codex to have some built in skill for bootstrapping worktree environments - similar to Claude Code's "/update-config" for bootstrapping repo permissions. I made my own skill for this "/worktree-cli-boostrap", but I could see the nuisance of environment bootstrap as being enough of a hinderance to prevent many users from starting to work with worktrees. The course will be out on YouTube on Friday (if my editor is fast) or Monday (if my editor is slow). I've also created an accompanying 180 slide deck which I'll release once the course is out. Subscribe on my YouTube and you'll be the first to know @aniketapanjwani" target="_blank" rel="nofollow noopener">youtube.com/@aniketapanjwa… !
Aniket Panjwani tweet mediaAniket Panjwani tweet mediaAniket Panjwani tweet mediaAniket Panjwani tweet media
English
3
23
167
10.1K
Tim de Silva retweetledi
Annamaria Lusardi
Annamaria Lusardi@Dr_AnnaLusardi·
Three days left to apply for the Financial Literacy Research Boot Camp at @Stanford . If you're an early-career researcher in economics, finance, personal finance or a related field, I hope you'll consider applying. This five-day, full-immersion workshop is one of the ways the Stanford Initiative for Financial Decision-Making is working to build the next generation of financial literacy researchers. Space is limited. The application deadline is April 30, 2026. For full details and instructions, visit: ifdm.stanford.edu/events/financi…
Annamaria Lusardi tweet media
English
0
7
22
2.5K