TTM (Time The Markets)

923 posts

TTM (Time The Markets) banner
TTM (Time The Markets)

TTM (Time The Markets)

@ttm0369

Quant/ML researcher building systematic $SPX 0DTE models for 9 consecutive high-conviction trades. Hunt Like a Lion 🦁 | Enriching others with purpose.

USA - Not financial advice. Katılım Şubat 2024
14 Takip Edilen298 Takipçiler
TTM (Time The Markets)
TTM (Time The Markets)@ttm0369·
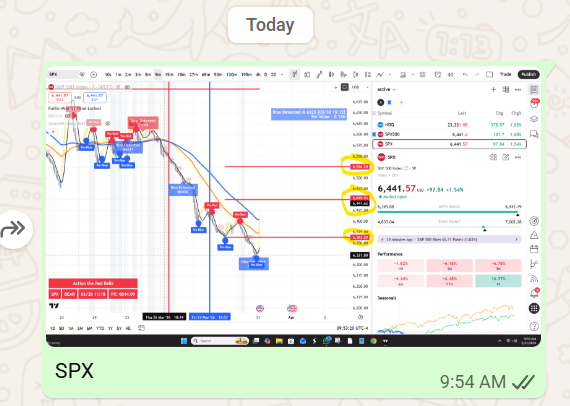
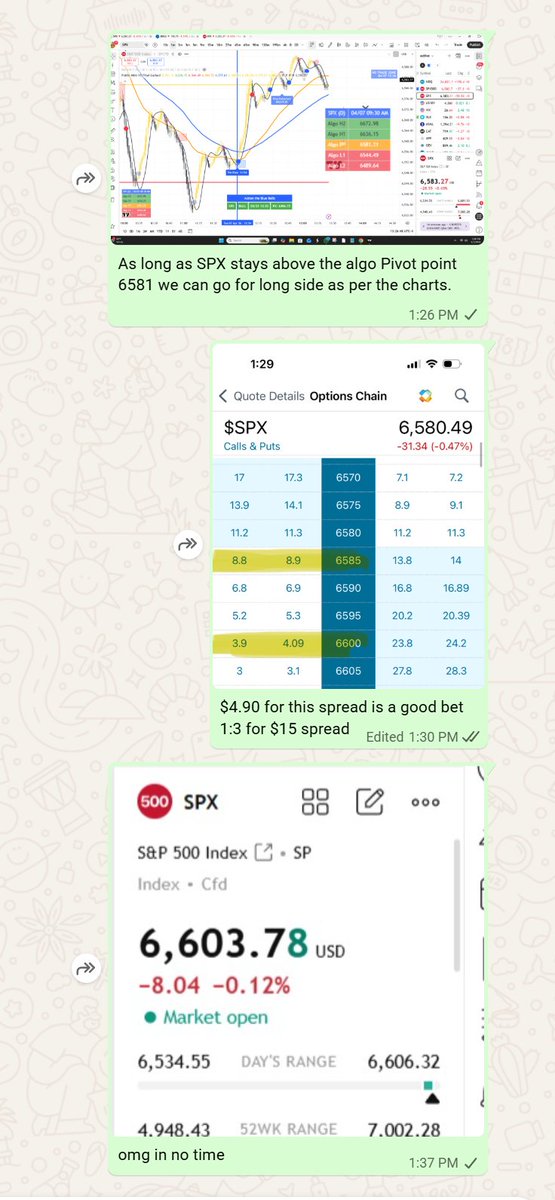
$SPX Rapid push from 6581 to 6603 in just 10 minutes 22 points up.
TTM (Time The Markets) tweet media
English
0
0
0
83
TTM (Time The Markets)
TTM (Time The Markets)@ttm0369·
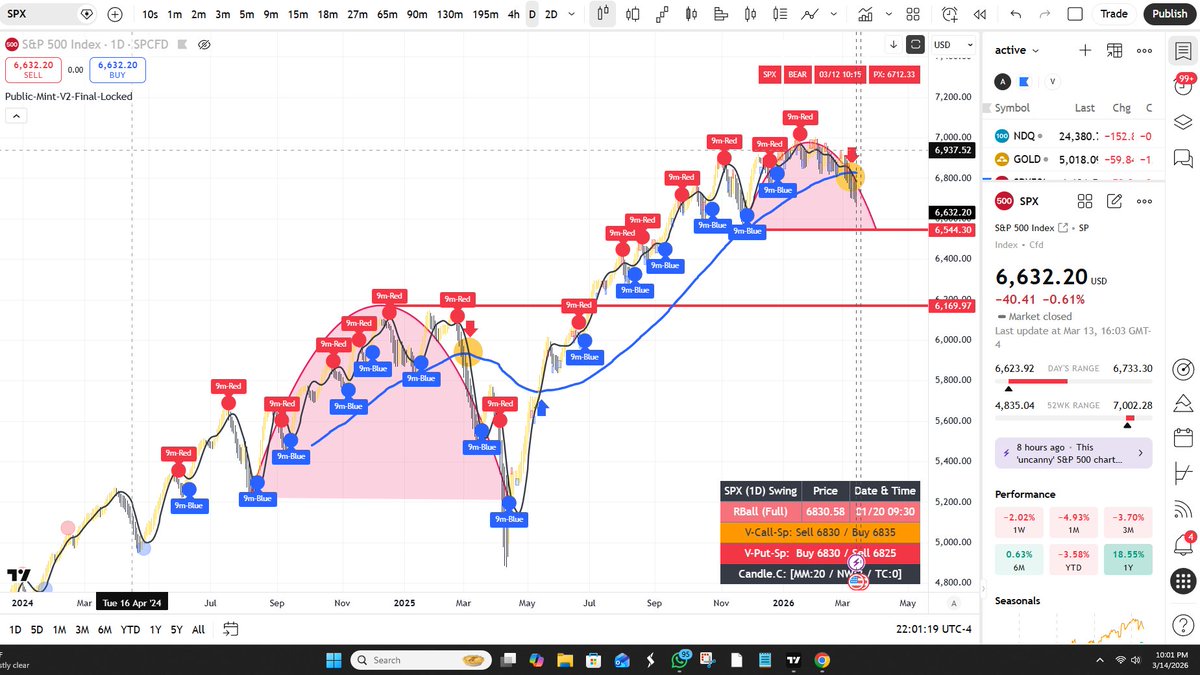
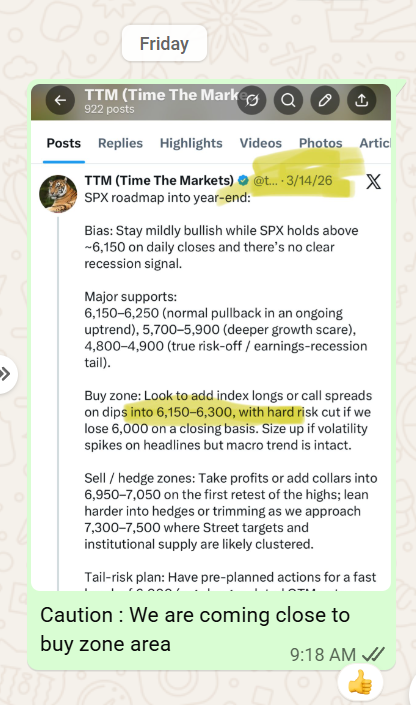
SPX roadmap into year‑end: Bias: Stay mildly bullish while SPX holds above ~6,150 on daily closes and there’s no clear recession signal. Major supports: 6,150–6,250 (normal pullback in an ongoing uptrend), 5,700–5,900 (deeper growth scare), 4,800–4,900 (true risk‑off / earnings‑recession tail). Buy zone: Look to add index longs or call spreads on dips into 6,150–6,300, with hard risk cut if we lose 6,000 on a closing basis. Size up if volatility spikes on headlines but macro trend is intact. Sell / hedge zones: Take profits or add collars into 6,950–7,050 on the first retest of the highs; lean harder into hedges or trimming as we approach 7,300–7,500 where Street targets and institutional supply are likely clustered. Tail‑risk plan: Have pre‑planned actions for a fast break of 6,000 (e.g., longer‑dated OTM puts or tactical short futures) plus rules for re‑deploying risk if price stabilizes back above 5,700–5,900. #SPX #SP500 #ES_F #SPX500 #SP500Index #SPXCharts #SPXOptions #SPXTrading #SPXTechnical #SPXAnalysis #SPXSupport #SPXResistance #SPXBulls #SPXBears #USStocks #USEquities #IndexFutures #MarketOutlook #Macro #Geopolitics
TTM (Time The Markets) tweet media
English
1
0
0
209
*Walter Bloomberg
*Walter Bloomberg@DeItaone·
📈RECESSION FEARS RISE AGAIN Recession odds have jumped to 36.9%, rebounding sharply after months of decline. Markets are signaling rising uncertainty—potentially driven by geopolitical tensions and a broader risk-off mood. kalshi.com/markets/kxrecs…
*Walter Bloomberg tweet media
English
98
129
825
301K
TTM (Time The Markets)
TTM (Time The Markets)@ttm0369·
SPX is heading towards 6850 area (potenital) I share real-time SPX chart observations and directional alerts based on my system. These are not trade signals or financial advice. I do not manage accounts or execute trades for anyone. Use proper risk management and make your own decisions.
TTM (Time The Markets) tweet mediaTTM (Time The Markets) tweet mediaTTM (Time The Markets) tweet media
English
1
0
0
92
TTM (Time The Markets)
TTM (Time The Markets)@ttm0369·
Please limit each trade to $200–$500 maximum. The maximum daily drawdown should be $500. Start with $200 per trade, and only increase up to $500 if you are already in profit for the day..
TTM (Time The Markets) tweet media
English
1
0
0
45
TTM (Time The Markets)
TTM (Time The Markets)@ttm0369·
Friday March 6th 2026 **SPX Ball Playbook – Today’s Summary** • **Open:** SPX opened nearly **100 points down**, so the market started very weak. **1️⃣ First Ball – 9-Min Red Ball** • **9:48 AM:** First **9-min red ball (6730)** → switched to **1-min chart** to track entries. • **10:10 AM:** A **1-min red ball appeared**, but we **ignored it** since the market was already too extended to the downside. **2️⃣ Second Ball – 9-Min Blue Ball** • **11:00 AM:** **9-min blue ball** appeared → focus shifted to **calls**. • **11:24 AM:** Setup was forming and being monitored. • **11:38 AM:** Entered **6760 calls around $6.20**. • **11:55 AM:** **Opposite ball appeared → exit with profit.** • **12:47 PM:** A **faded blue ball trade** after the pullback **6772 → 6735 → bounce back toward 6772**. • Exit again when **red ball appeared**. • **2:00 PM:** Another **faded blue ball push** took SPX near **6773**. • **3:07 PM:** **Red ball signal → exit.** **3️⃣ Third Ball – 9-Min Red Ball** • **3:30 PM:** New **9-min red ball**, but **no clean setup
TTM (Time The Markets) tweet media
English
0
0
0
26
TTM (Time The Markets)
TTM (Time The Markets)@ttm0369·
SPX: The playbook for this setup begins with identifying the higher timeframe signal, which in this case is the 9-minute Red Ball that appeared on 03/04 at 15:12 around 6875.8. Once this signal appears, it establishes a bearish directional bias, meaning traders should focus only on PUT-side opportunities. From that moment forward, the strategy is to watch the 1-minute chart and consume only the same-color Red Ball signals, ignoring any Blue Balls since they represent temporary counter-trend bounces. In this example, the valid execution opportunities appeared when the 1-minute Red Balls printed at 15:50 (03/04), 10:05 (03/05), and 11:03 (03/05), each occurring near resistance or after weak upward pushes. By following this rule—9-minute Red Ball for direction and 1-minute Red Balls for entries—the trader aligns with the dominant market flow and avoids low-probability trades against the trend.
TTM (Time The Markets) tweet media
English
1
0
1
115
TTM (Time The Markets)
TTM (Time The Markets)@ttm0369·
Trade Setup Recognition – 9 Minute + 1 Minute Alignment (SPX) ### Trade Setup Recognition – 9 Minute + 1 Minute Alignment (SPX) Thank you for the observation on the 9-minute and 1-minute setup. Below is the clear process we follow. ************************************************************** ## Step 1: Start With the 9-Minute Chart (Main Chart) ## Step 2: Mirror the Setup on the 1-Minute Chart ## Step 3: Enter and Ride the Wave ## Step 4: Exit Strategy ### Core Principle ************************************************************ ## Step 1: Start With the 9-Minute Chart (Main Chart) * The **9-minute chart** is our directional guide. * Our trade preparation begins when we see a **Red Ball or Blue Ball**. * These balls act mainly as **entry reference points**. * Exits depend on: * Appetite (risk comfort) * Chart reading skills * Formation of transition candles Example: * On the **9-minute SPX chart at 12:39 PM**, a signal appeared. * At that time, spreads were suggested. * Mark that exact time on the chart by drawing a vertical line. --- ## Step 2: Mirror the Setup on the 1-Minute Chart After marking the 9-minute signal: 1. Open the **1-minute chart**. 2. Draw a vertical line at the same time as the 9-minute ball. 3. Wait patiently for the **first Red Ball or Blue Ball** on the 1-minute chart. 4. That first 1-minute ball becomes your execution trigger. ## Step 3: Enter and Ride the Wave * Take the position when the first 1-minute ball confirms. * Ride the move in the direction of the 9-minute structure. * Continue holding while the 9-minute candles support the move. * Monitor: * 9-minute candle structure * Footer candles (momentum support) ## Step 4: Exit Strategy Exit when: * A **transition candle** forms on the 9-minute chart, OR * Structure changes clearly, OR * Momentum weakens in footer candles. ## Special Case: If 9-Minute Shows a Blue Ball * Draw a line at the Blue Ball time. * On the 1-minute chart, mark the same time. * Look for the **first Blue signal** forming near that time (before or after). * That becomes your execution trigger. ### Core Principle * 9-Minute = Direction * 1-Minute = Execution * Footer = Momentum Support * Transition Candle = Exit Warning Simple structure. No guessing. Just alignment and confirmation.
TTM (Time The Markets) tweet media
English
0
0
0
151
TTM (Time The Markets)
TTM (Time The Markets)@ttm0369·
On the 65-minute structure of SPX, price is forming a rounded higher low with support holding near the 6,806–6,820 zone and momentum curling up. If structure continues to respect higher lows, we could see one more push toward a fresh ATH into next week starting from Monday (Feb 23) — likely with controlled pullbacks rather than straight-line expansion. Pros for upside continuation: • Higher low formation on 65m • Reaction off demand zone with momentum curl • Short-term reclaim of key moving averages • Volatility compression → potential expansion Risks / Cons: • Still below recent supply zone — overhead liquidity not cleared • Failure above 6,900 area could trap late longs • If 9m structure breaks (lower high + lower low), upside thesis weakens • Extended move without pullback increases reversal probability Plan remains simple: Respect the 9-minute rule for entries & exits. No deviation. Wait for structure → enter on confirmation → exit on rule violation. Bias is conditional, not emotional. Do your own research. This is not financial advice. what is the confidance level ? ~70–75% conviction on the bullish cup completion leading to a new ATH by Next week starting form Feb 23 (or very soon after), with gentle pullbacks fitting the pattern's typical shallow dips. #SPX #SPX500 #OptionsTrading #PriceAction #0DTE #MarketStructure #RiskManagement #TradingPlan
TTM (Time The Markets) tweet media
English
0
0
0
114
TTM (Time The Markets)
TTM (Time The Markets)@ttm0369·
Trading made simple with Public-Mint-V2 🚀 This 1-min SPX chart (Zero-DTE focus) shows exactly how Public-Mint-V2 works in real time.Just two guiding lines — no indicator overload, no predictions.• Angled crossovers = clear directional bias • Flat crossovers = skip, no edge These lines aren’t random. They reflect real money flow + price action, with market behavior indirectly shaped by volatility (VIX). We don’t predict — we let the market show its hand. The lines become our guides, not signals to chase.Key examples from today: 📷Call-side entry → upward blue-orange crossover with slope → first confirmation near the lines → happened ~2:03 PM around 6860 area → strong move followed 📷 Put-side entry → downward crossover → occurred ~10:53 AM near 6914 → downside followed Simple pattern recognition. Visual. Repeatable.📷 Entries guided by the cross + confirmation. 📷 Exits = 100% trader’s responsibility.Disclaimer: For educational purposes only. Not financial advice. Trading Zero-DTE options is extremely high risk and not suitable for everyone. Always manage risk and trade your own plan.Simple. Visual. Repeatable. 📷#SPX #0DTE #ZeroDTE #OptionsTrading #DayTrading #PriceAction #PatternRecognition #TradingStrategy #TradeResponsibly
TTM (Time The Markets) tweet media
English
0
0
1
139
TTM (Time The Markets)
TTM (Time The Markets)@ttm0369·
Power Hour SPX Trade Plan — Precision moves in the final hour. Educational content based on our observations and findings (DYOR). Noticed a pattern: When SPX turns decisively upside or downside between 3:00–4:00 PM ET, it often runs precisely to the expected move (check 0dtespx.com post-close for confirmation). Example: Yesterday upside flag at ~2:50 PM with SPX ~6886. Expected move ~26 pts → targeted close ~6912 area. Planned 0DTE calls: - Strike at 50% of expected move (~14 pts) from low → 6900 strike - Very reasonable premiums, strong success rate $3 turned into $17. Backtested on 9-min timeframe data — encouraging results across samples. Strategy: - Direction from 9-min chart for planning - Entry on 1-min (if expected move >25 pts) or 30-sec (if <25 pts) - Footer histogram for final confirmation/decisions Hunt like a lion in Power Hour. Consistent edge when the tape confirms. Red dot puts blue dot calls. #SPX #OptionsTrading #0DTE #PowerHour #DayTrading #SP500 #TradingStrategy #Options
TTM (Time The Markets) tweet mediaTTM (Time The Markets) tweet media
English
0
0
1
68