Tweet fixado
Behrad
514 posts


Behrad retweetou

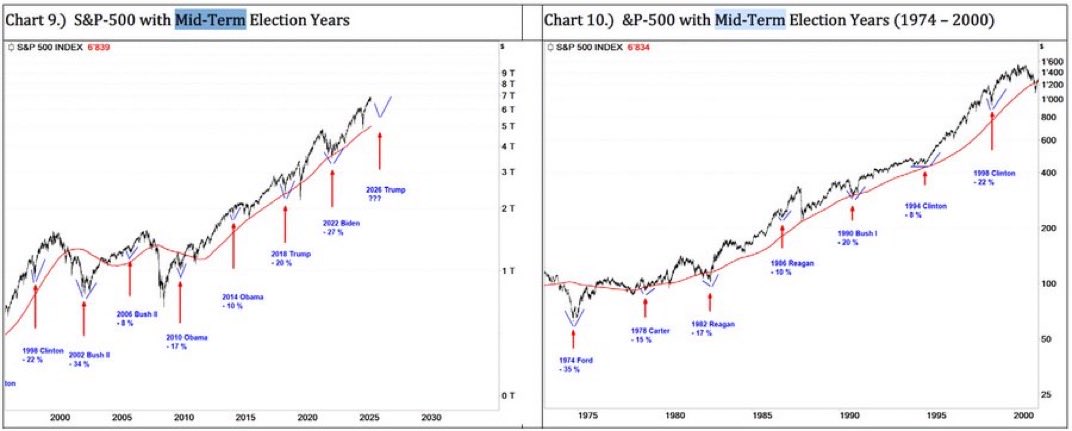
Every single midterm year since 1974.
Same pattern.
1974 Ford: −35%
1978 Carter: −15%
1982 Reagan: −17%
1986 Reagan: −10%
1990 Bush: −20%
1994 Clinton: −8%
1998 Clinton: −22%
2002 Bush: −34%
2006 Bush: −8%
2010 Obama: −17%
2014 Obama: −10%
2018 Trump: −20%
2022 Biden: −27%
2026 Trump: ???
Every single one had a significant drawdown.
Every single one recovered.
The long-term chart kept going up.
The question for 2026 is not if it recovers.
The question is whether you will still be invested when it does.
Thierry from arvy 🇨🇭@ThierryBorgeat
Today is the DAY. April 17, 2026. The intermediate top before the most difficult time of the presidential cycle. THE BAD NEWS We're entering the mid-term correction phase. Historically, markets correct an average of 16% during this period. It's the weakest part of the 4-year presidential cycle. And it starts NOW. THE CHART SPX Seasonal Composite 4-Year Presidential Cycle (99 years of data): Election Year → Post-Election Year → Mid-Election Year → Pre-Election Year Red line (current cycle): Peaked April 17, 2026 Black line (historical average): Shows consistent mid-term weakness The pattern is clear. Mid-election years are brutal. THE HISTORICAL PATTERN Out of the last 20 presidential cycles, we've witnessed 19 sharp mid-term corrections. Average decline: 16% Timing: Mid-election year (Year 2 of the cycle) This is where markets reset. THE GOOD NEWS After 19 out of 19 sharp mid-term corrections, we've seen a new bull market. Duration: 2 years Phase: Pre-election year + election year (Year 3 and Year 4) This is the most bullish part of the cycle. THE SETUP We're at the top of Year 2. The correction is coming. But the 2-year bull market follows. THE MESSAGE Buy any dip in the coming months. Not now. Not at the top. But when the market corrects 10%, 15%, 20% — that's your entry. Because history says: Mid-term corrections are buying opportunities for the pre-election rally. THE PLAYBOOK 1. We're at the intermediate top (April 17, 2026) 2. Expect a 16% correction over the next 6-9 months 3. Layer in during weakness (-10%, -15%, -20%) 4. Hold through the pre-election year rally (Year 3) 5. Ride the election year momentum (Year 4) THE PATTERN NEVER FAILS 19 out of 19 times, the mid-term correction was followed by a 2-year bull market. That's 100%. THE LESSON Don't panic during the correction. Don't fight the cycle. Buy the dip. Hold for 2 years. That's the presidential cycle playbook. Today is the DAY. The top is in. The correction starts now. The opportunity is coming.
English

Behrad retweetou

@CIVolatility Yeah I've heard that argument many times, I don't trade based on it but I think It can give you hints about the general market movement.
English

@BehradEb Chart-based technical analysis doesn't work on $UVXY. Every candle is based on a different combination of $VIX futures contracts.
civolatility.com/faq/volatility…
English


I’m off for the day because it’s my birthday. I’ll be spending it with a loved one. I’ll see you all tonight or tomorrow. Nothing changed regarding my positions and my early morning market analysis. Have a good one and thank you in advance for the birthday wishes ❤️
English

Behrad retweetou

I can’t recall a day when the $SPX made a new all-time high with only 11 of its components making new 52-week highs.
English
Behrad retweetou

Since the start of the Iran war...
Sulfur: +67%
Jet Fuel: +66%
Urea: +51%
Diesel: +50%
Heating Oil: +40%
WTI Crude Oil: +37%
European Natural Gas: +34%
Gasoline: +32%
Fertilizer: +31%
Brent Crude Oil: +31%
Coal: +14%
Palm Oil: +10%
Iron Ore: +7%
Rice: +4%
S&P 500: +1%
$VIX: -8%
English

This is another alternative since we have $VIX OpEx tmrw and after a huge crush we might see some expansion ...

Behrad@BehradEb
$NDX hope you all make some greens...
English
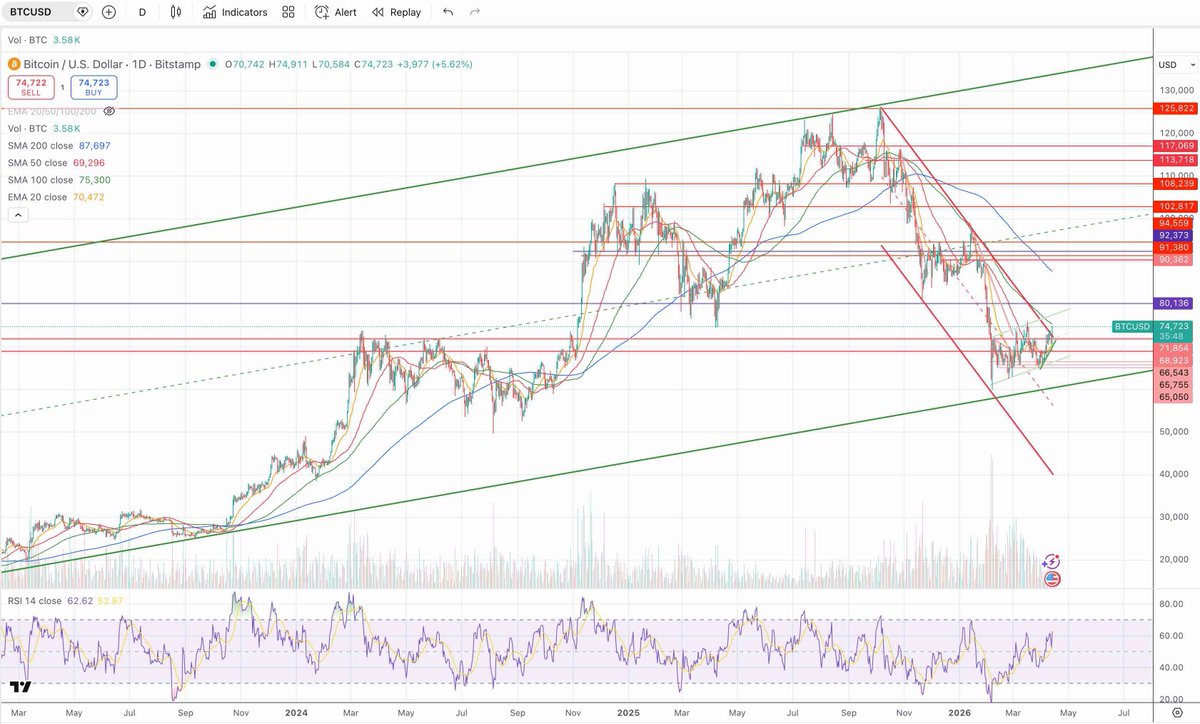
$BTC just broke out above a multi month downward trend... next stop 90K
Behrad@BehradEb
$BTC next resistance to watch is 79k - 80k
English
👌👌
AK@1769_alex
DeMark TD Sequential is a counter-trend momentum indicator created by Tom DeMark. It is designed to spot trend exhaustion and potential reversals by measuring when buying or selling pressure is running out of steam. $SPY is currently on TD 7 on Daily and traded at 38M vol. today, very low and shows less conviction from buyers + exhaustion IMO. It's not a guaranteed, but it's a warning sign as we also have a big gap below it. Can it continues for few more days next week, absolutely but it's getting close. $VIX is also 5% away from the major support at 18 and 200MA on daily. The R/R to long from here isn't as good, NFA. @Mr_Derivatives @JohnLoc18 @Basssem666 @MichaelPBento @A_Najumi $SPX $QQQ $VIX
ART
Behrad retweetou

Even during the GFC Consumer Sentiment was never this low. It’s an indicator of the massive disparity gap. The divide has never been larger from a wealth perspective.
The Kobeissi Letter@KobeissiLetter
BREAKING: The UMich Consumer Sentiment index officials falls to a record low of 47.6 for the month of April amid the Iran War. Not even March 2020 or 2008 saw consumer sentiment levels remotely near as low as they are right now.
English
