These are the current results for Boulder's first RCV election. These results are unofficial as they wait for more ballots to be counted.
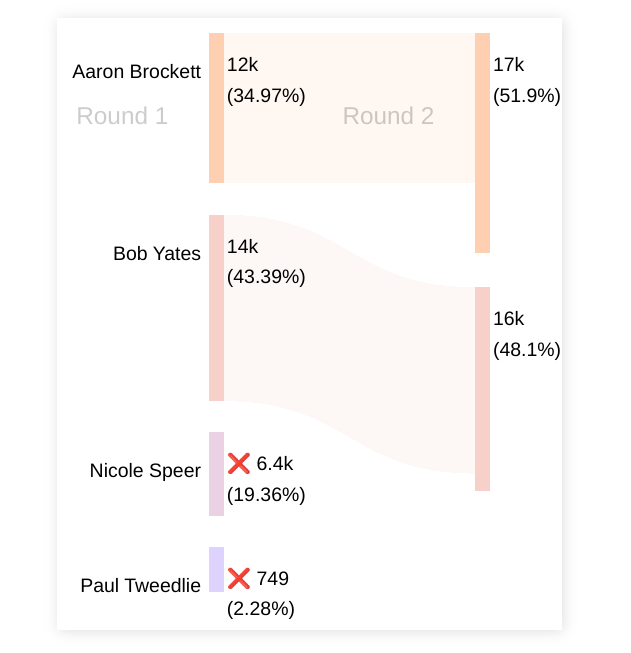
After two rounds, Bob Yates is currently in the lead. rcvis.com/v/city-of-boul…
@rcvisdotcom I now see a more obvious problem with the use of batch elimination: the Sankey diagram doesn't show any flow at all from the eliminated candidates. And the bar for Paul with only 2.28% is out-of-proportion. #sankey" target="_blank" rel="nofollow noopener">rcvis.com/v/city-of-boul…
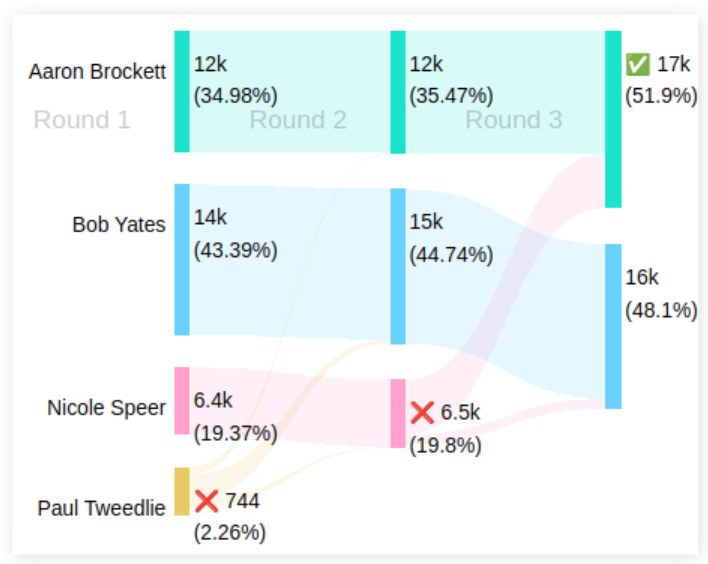
@nealmcb This is caused by missing information in the data source (in this case, Dominion). There’s no reason batch elimination inherently wouldn’t show the transfers.
For example, you can see a Sankey here where batch elimination shows transfer data: #sankey" target="_blank" rel="nofollow noopener">rcvis.com/v/2023-ward-3-…
@nealmcb There is also a minimum height for each candidate in the sankey. Below a certain size, they are not proportional. We understand the concern and if it’s causing confusion, can look into explaining that on the page.
@rcvisdotcom Very helpful. I think it's very misleading to have a minimum size, especially with missing data like this. I tried to download the raw data for your example, but got "Login to create visualizations or download raw data". How is it different? Is this a known Dominion Issue?
@nealmcb You do need to create an account and log in to view raw data — this is a measure to prevent bots from scraping everything.
Here’s what the raw data looks like:
github.com/artoonie/rcvfo…
@nealmcb I’m not sure I’d call it an “issue” with Dominion’s data. It’s a bit of data that’s not needed for most visualizations: during batch elimination, the transfer data is presented as a batch. This only is relevant in our Sankey and Table By Round.
@rcvisdotcom Thanks again. I logged in and downloaded the data for that Minnetonka batch-elimination-with-transfers example, which is in json format. Most surprising is that the transfer counts aren't integers, e.g. "Paula Ramaley": 119.5166163141994
What does that mean?
@nealmcb It's the flip side of what you noted earlier: when batch elimination only shows the total results of the round, and not the per-candidate distributions, you either (1) guess at the transfers by assuming proportionality, or (2) hide the transfer data during any batch elimination.
@nealmcb In this case, the transfers were guessed at by assuming proportionality.
Note that anybody can upload data to RCVis. You should look for a [source] link to reference the original data source. In this case, here are the official results: minnetonkamn.gov/home/showpubli…
@nealmcb Note that vote totals are always correct -- this only affects how "wide" the lines are in the Sankey, and some of the text in the Table-by-Candidate.
I do agree that in this case, we shouldn't be guessing at the transfers. I have created an Issue here: github.com/artoonie/rcvis…
@rcvisdotcom Thanks! I've now got the CVR data, figured out how they interpreted the ballots (including a very strange approach to ballots with duplicated rankings) and did my own sequential-elimination tabulation, which agrees with theirs. #sankey" target="_blank" rel="nofollow noopener">rcvis.com/v/boulder-mayo…