Oflow Trading

141 posts

Oflow Trading banner
Oflow Trading

Oflow Trading

@OflowTrading

https://t.co/jfoquBtT3z

Присоединился Ocak 2026
342 Подписки628 Подписчики
Oflow Trading
Oflow Trading@OflowTrading·
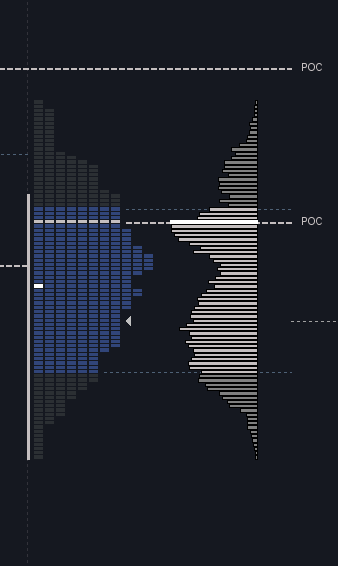
ES. 1,000+ lot bid at 6640. Front runners pile in one tick above. Three big trades. 33, 20, 57 contracts. Price bounces 22 ticks. Then the bid disappears. It was a spoof. You only see this on the order book. oflowtrading.com
English
0
2
16
755
Oflow Trading
Oflow Trading@OflowTrading·
Same level. Different day. Yesterday it bounced, today it breaks. The chart shows the price. The order book shows you what's behind it. oflowtrading.com
English
1
0
19
834
Oflow Trading
Oflow Trading@OflowTrading·
The speed at which orders hit the market tells you more than the orders themselves. You see the aggression building before the candle even forms. oflowtrading.com
English
0
1
30
1.6K
Mango
Mango@sky_xbt74·
@OflowTrading Honestly saying mate, your teaching style is one of the best .💯🙌
English
1
0
1
7
Oflow Trading
Oflow Trading@OflowTrading·
Trump claims productive Iran talks. Iran denies it, calls it a ploy. Strait of Hormuz. Oil crashes. What happened in the ES orderbook AFTER was insane. Thousand lot spoofs. Front runners. Fake bids pulled and replaced. The game behind the candle. oflowtrading.com
English
7
13
164
23.1K
Oflow Trading ретвитнул
josh
josh@XennialTrader·
Example of How to Read and Trade the Auction Last night: start with a blank chart. 15m bars, showing 3-4 weeks. Use SPX or cash-only back-adjusted ES (SPY not recommended due to Friday's ex-div gap). Mentally draw boxes/ranges. If you do that, you will notice that March 9, 13, and 18 had similar lows, and the gap down on the 19th (last Thurs) was a clear break away from those prices. Next, follow the auction since then (see pic). The pop at the EOD Thursday was sold and the Friday explored lower. Monday's gap up was sold back into Thursday's range, and Tuesday's gap down was bought back into Thursday's range. At this point, a pattern begins to emerge. A profile really helps to visualize but you don't necessarily need it. We started multiple excursions from ~6638 ES (~6585 SPX) and returned to it every time. It has been a magnet. Integrating Narrative This morning - with a well established 4-day balance, my thesis is that we are gapping up here for a reason: the market wants to be higher. On Monday I proposed this. It's looking ahead to the resolution of the war. Part of this is just experience, I've seen it a lot. Not just in "what usually happens" but that it's just not going down as easily; again, it takes some experience to recognize this. So that's my mindset going in. Willing to short but I'd rather be a buyer. The magnet effect of 24-38 kept me from wanting to buy on the gap up this morning. However, the sell on "nuclear power plant attacked" right into that area was met with very strong buying. Find a way to get into that long, and it's a good opportunity. Review Overlooked from many reviews is the most important thing: I was not so eager to buy that I bought a news-induced falling knife. I did not buy 6650, then 40, then puke out at 35 and watch it go higher without me. I waited for buyers. I bought 11 handles off the low, after the low, averaging into 6643. You don't have to catch the turn exactly. There was an unmistakable buying impulse there, at the price I expected buyers, and that's all you need. I got flat at 6658 and while not ideal, was in line with my thesis that simply rotating above the 6624-38 area was the market's goal today. The structure was not ideal for immediate continuation higher. I'll post the "why" some other time. Anyway, that's all. This was a very simple analysis, and just involves walking through the structure and arriving at some context in which to execute. Every day is not like this. Some days the picture is muddy and I have no good bigger picture zones/levels to execute at, and I focus exclusively on very short term references made during the session. Some of my best days are those. Monday was far better and I had no such plan. But when the structure speaks to you at an intuitive level, utilize that and some good opportunities will often emerge. #ES_F #NQ_F $SPY $QQQ
josh tweet mediajosh tweet media
English
0
9
128
16.1K
Oflow Trading
Oflow Trading@OflowTrading·
@sky_xbt74 Yeah, haven't had time to post much yet, stay tuned tho
English
1
0
0
21
Oflow Trading
Oflow Trading@OflowTrading·
Pulling and stacking. One side steps away, the other steps in. That's how you read direction on the order book. oflowtrading.com
English
1
0
49
2.9K
rpx
rpx@rpxtrades·
25/03/2026 - HOD short
English
4
0
25
1.5K
Ice
Ice@trade_with_Ice·
🤔
Ice tweet media
QME
2
0
9
544
Chief
Chief@ChiefTrader14·
@OflowTrading Would be awesome if you could do some educational DOM series so more traders could give it a chance since at first it’s really tricky and scary to watch.
English
1
0
1
68
Oflow Trading
Oflow Trading@OflowTrading·
First time watching a DOM it looks like chaos. After a few sessions you start seeing things no chart can show you. Once it clicks, you never go back. OflowDOM. Native to NinjaTrader 8. oflowtrading.com
English
3
2
48
4.3K
Oflow Trading ретвитнул
NERV
NERV@NERV_flow·
Alright guys here is another DOM video. This goes through a bit of my thought process and what I am looking for. This was from the 3/23 ES high. If you enjoy or think it may help others, dont hesitate to repost. Always if you got questions leave em in the comments and I'll try to get back to you.
English
4
17
150
13.8K
Bernard
Bernard@probernard_02·
If you're given a $50k @GoatFunded account how will you trade and eventually get a payout on it? I'll be in the comments
English
52
2
144
3.9K
Ice
Ice@trade_with_Ice·
@OflowTrading @SierraChart Great, I want to play with your Dom. Hmmm... that doesn't sound right 🤣
GIF
English
1
0
3
128
JhonSnow
JhonSnow@ofJhonSnow·
@probernard_02 @GoatFunded Simple. 1:2RR I trade orderflow, specifically the Depth of Market, whereby I see all limit orders and market orders. Maximum of 3 trades per day, risk 1% of the account. I trade only the ES, target 10 points, while SL is 5 points. Key levels involves PDH and PDL.
English
1
0
1
23
Oflow Trading ретвитнул
josh
josh@XennialTrader·
Speaking of replay.. If you want to see what actual support looks like, in real time, go back and replay the sequence starting just before 13:05 ET (through 13:30). It does not get clearer than that. Not sure if replay will capture the feel of it, but give it a go. That doesn't mean it was easy to buy or that it couldn't have just as easily tanked (I got shaken out at first). Had buyers gotten their fill and more sellers pressed, of course we would have flushed. But there was a "pushing the beach ball underwater" feel about it. On the 13:45 ET last test lower, I had zero hesitation to buy, and would have been genuinely shocked if we had dropped hard there. If you bought there, you were demonstrably being helped by a very conspicuous contingent of buyers who have announced their intent. Contrast that with buying a "level" because you have it marked on your chart, without any demonstration of actual support in real time. Speaking of "levels", ES 6600 is SPX 6550. Check out a daily chart and mark that back in Sep, Oct, Nov. #ES_F #NQ_F $SPX $QQQ
Boltz@EsBoltoise

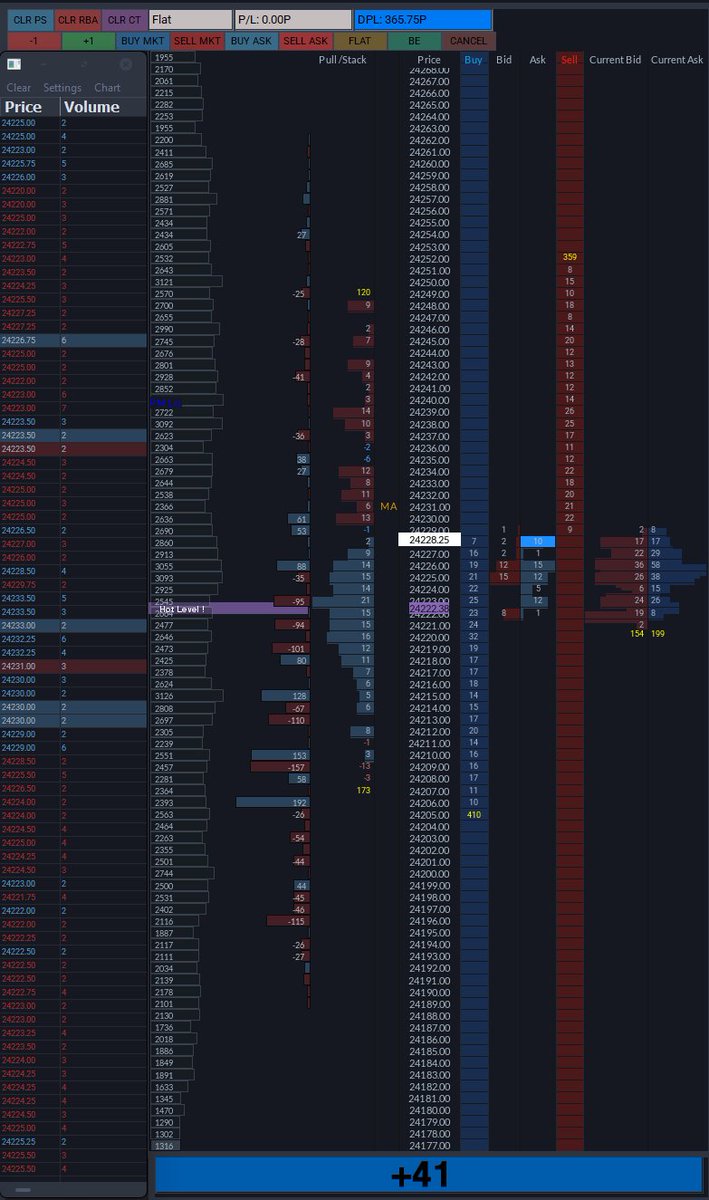
Wanna learn the DOM? Go back and replayed HOD. This was such a clean sequence and engrave it in your head. Cc:@XennialTrader for the pic and post

English
2
3
47
5.1K