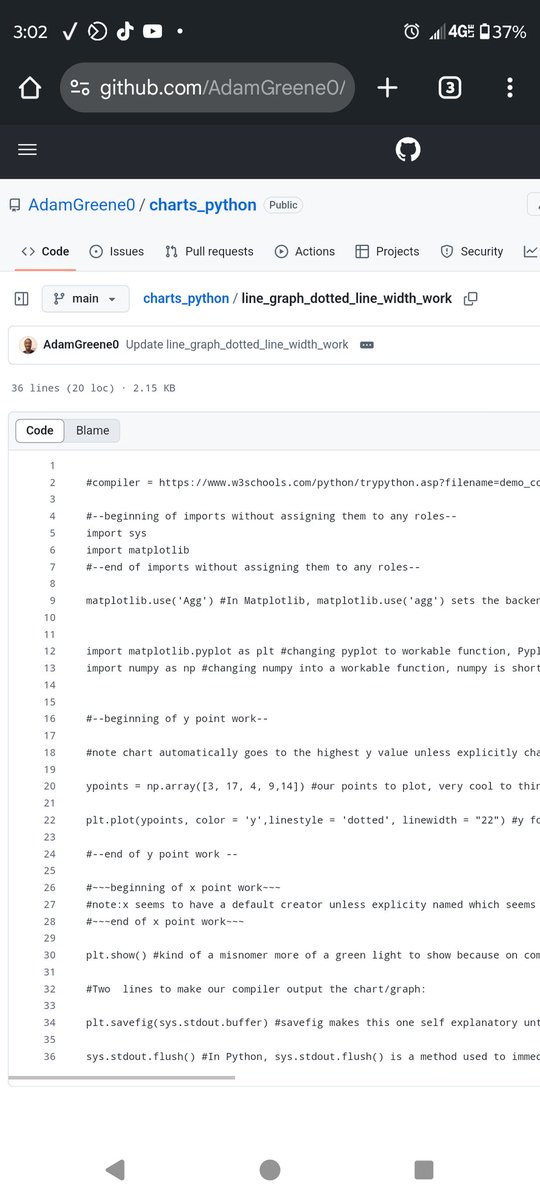
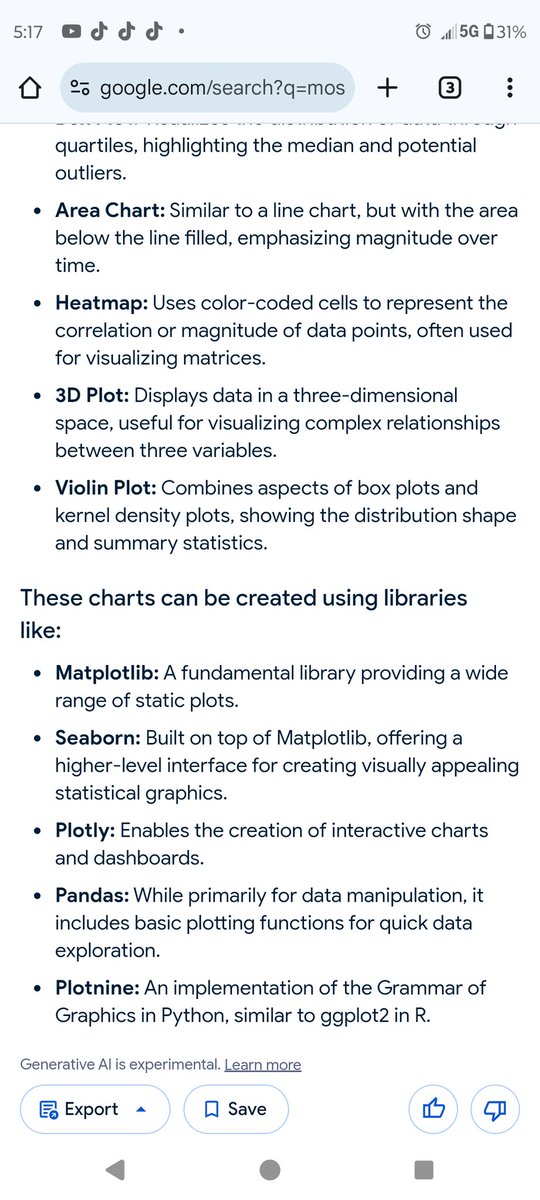
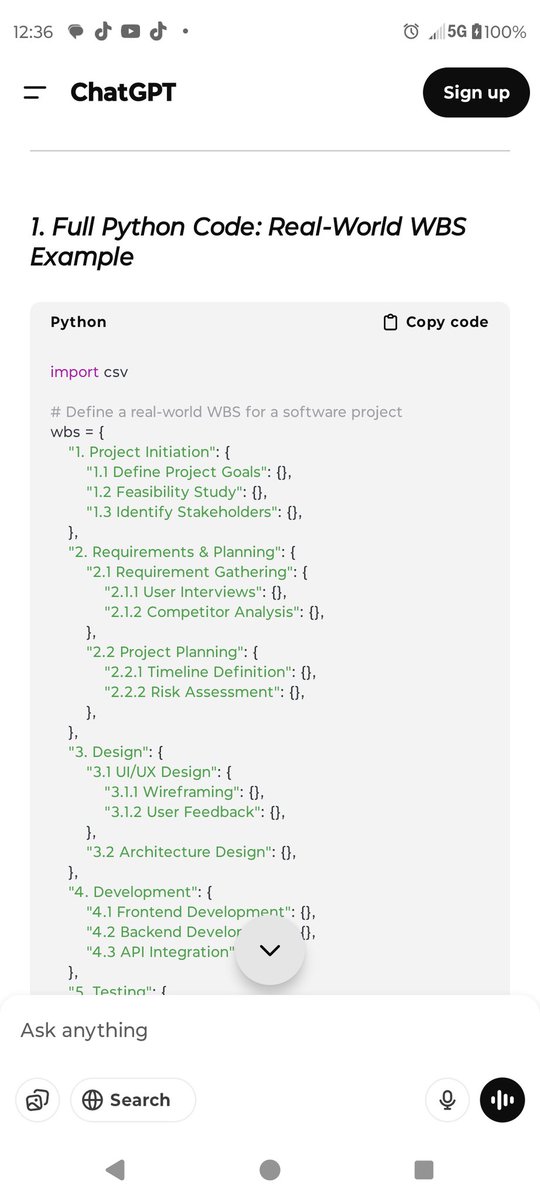
Arama Sonuçları: "#pythoncharts"

11 sonuç
QuantInsti
QuantInsti@QuantInsti·
4/ 📊 Visualization Magic: Python's #Matplotlib and Seaborn enable traders to create stunning visualizations of market data. Clear and intuitive graphs help in identifying patterns and trends, aiding decision-making processes. 📉📊 #DataVisualization #PythonCharts
English
1
0
1
33
Developers Today
Developers Today@dev_today99·
9/ 📊 Data Visualization: Use libraries like Matplotlib or Seaborn to visualize data. Create simple bar charts, line graphs, or scatter plots with sample datasets. 📈📊 #DataViz #PythonCharts
English
1
0
0
17