ทวีตที่ปักหมุด

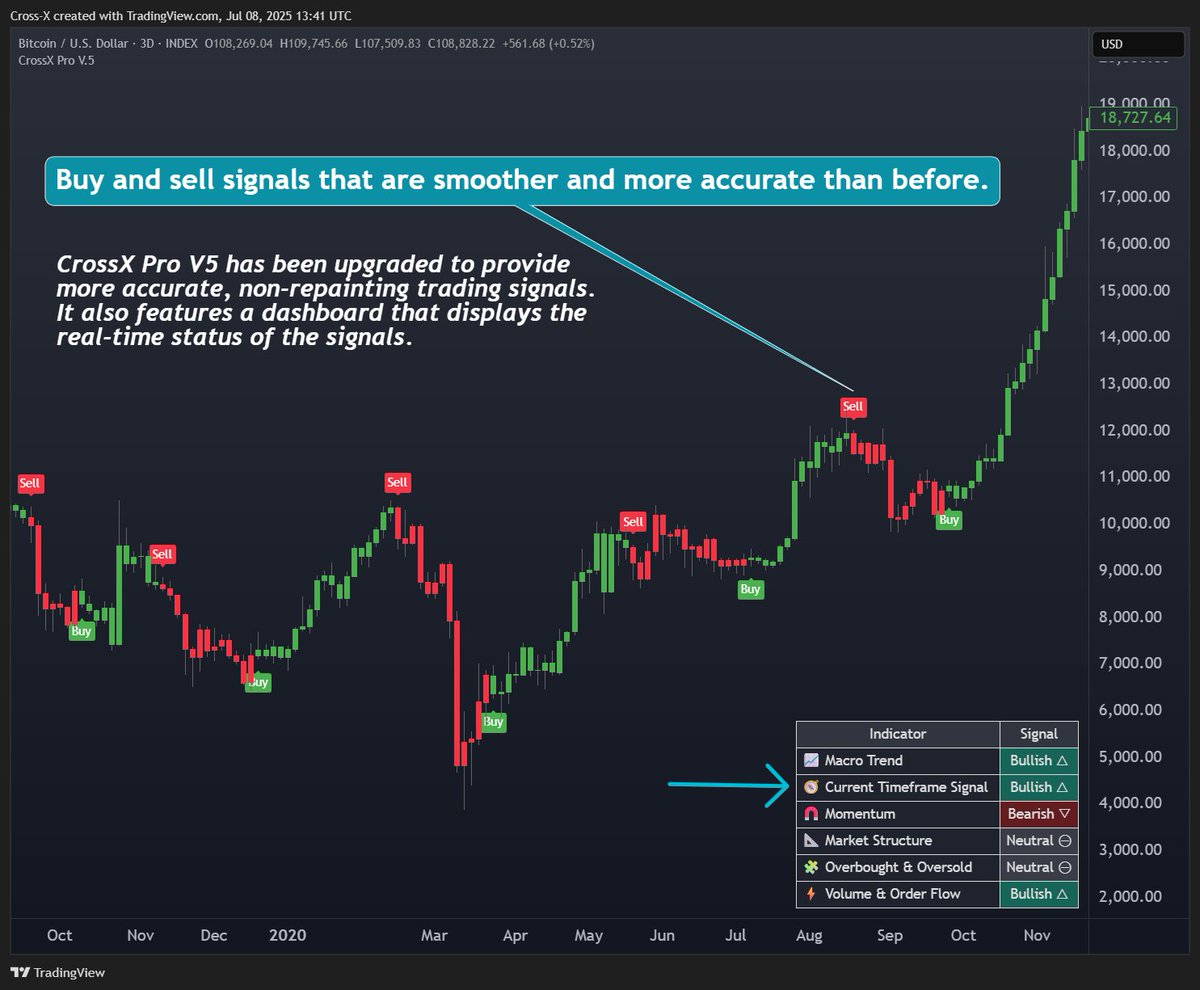
CrossX Pro V5 has been released today! 🔥
More than 1,000 existing users will receive a free update.
You need to:
1. Refresh your browser or mobile app
2. Remove CrossX V4 from your chart
3. Re-add CrossX V5 from your invite-only indicators.
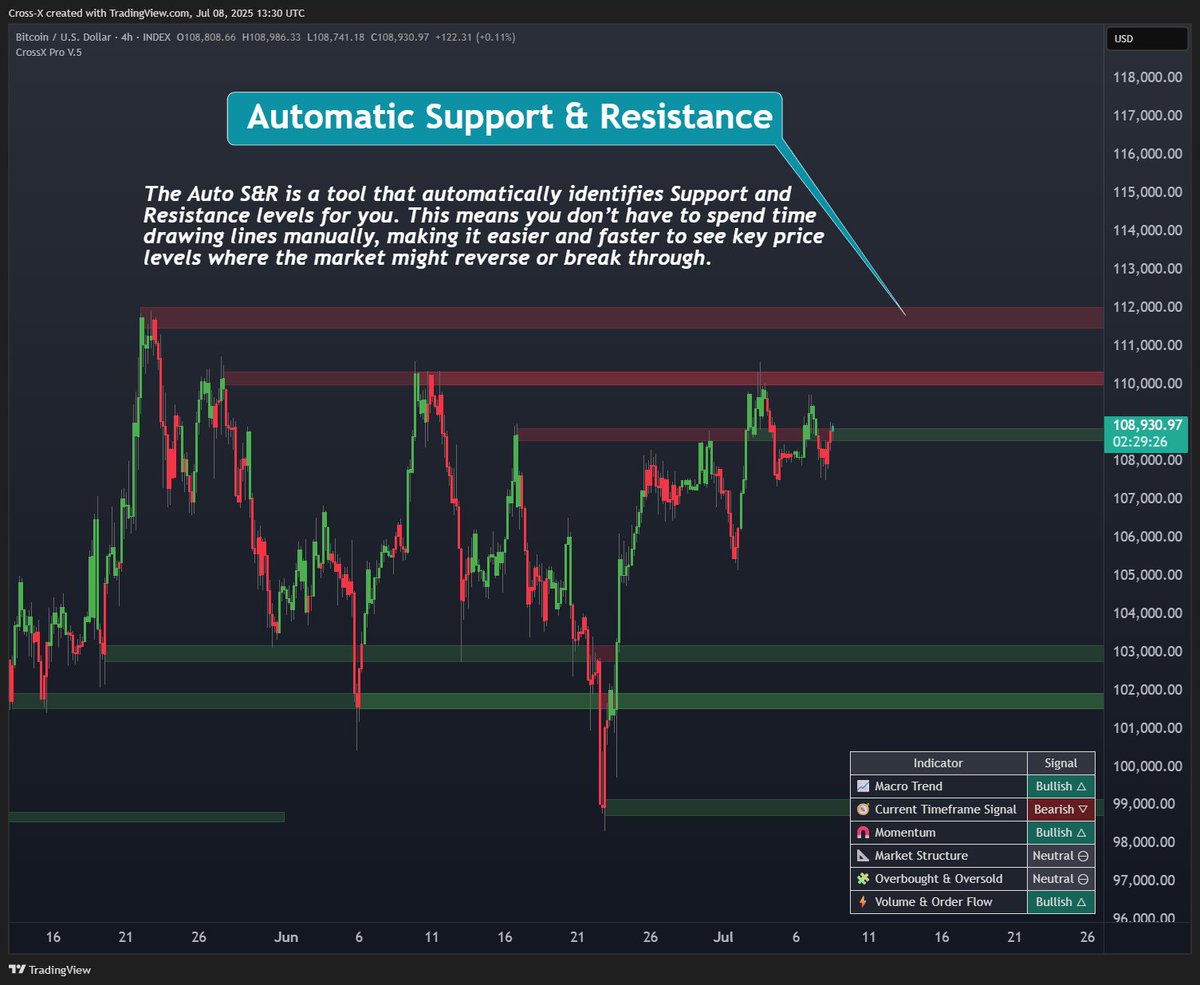
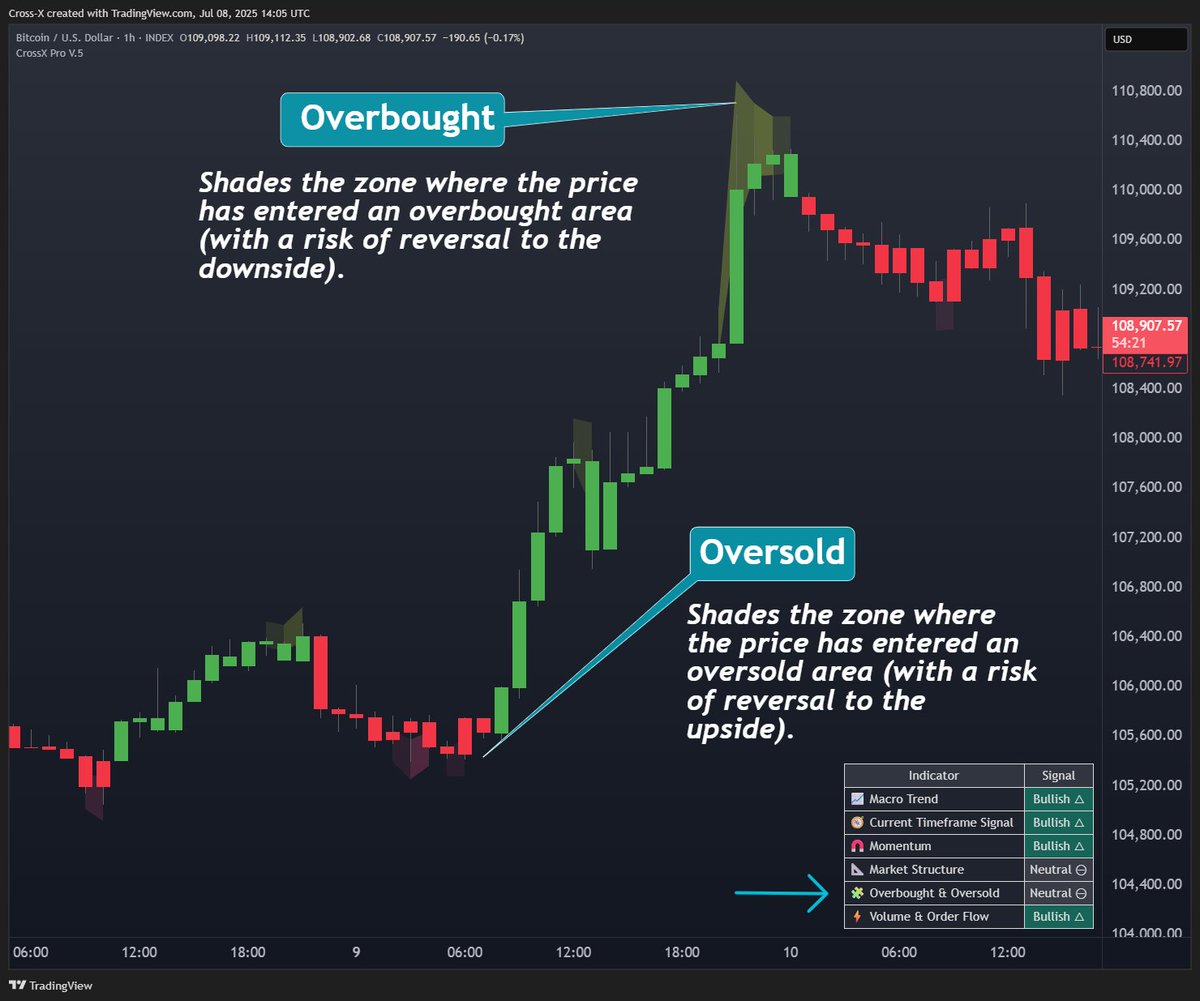
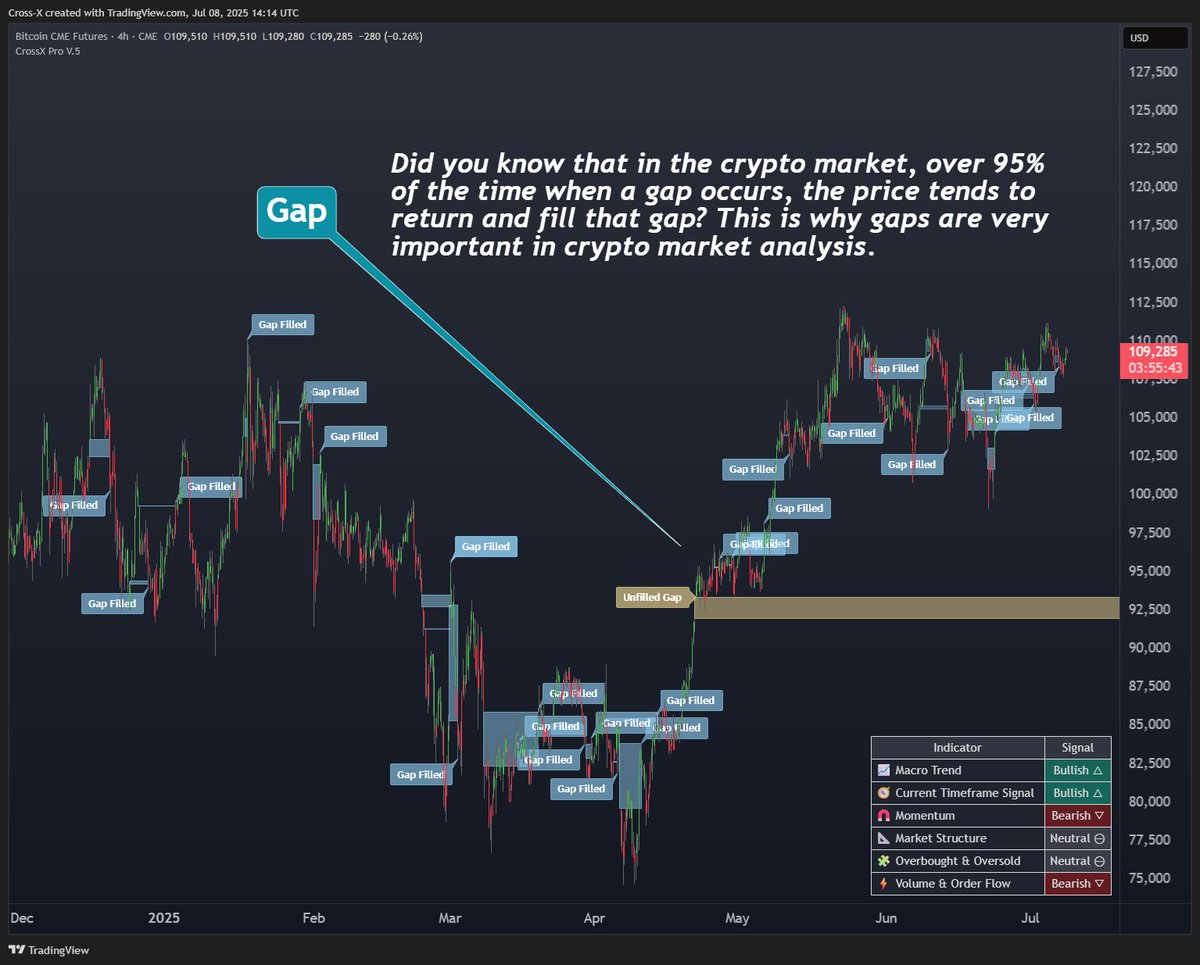
All previous features remain, plus many new trading features—the image below shows just a small part of them!
User guide 👉 mycrossx.com/howitworks/
Get access 👉 mycrossx.com/accessing/ for just $160 before the price jumps to $500 tomorrow. Don’t miss out!
Happy trading 🚀
English