ทวีตที่ปักหมุด

90% traders lose because they chase predictions.
10% win because they follow systems.
If you want to build wealth with discipline,
not dopamine—
You’re in the right place.

English
Krishna Thakur
10K posts

@KrishAlpha7
🫡 Soldier 🇮🇳 Mindset |📉Swing & Long-term Investor | 20-40-40 (Gold, Momentum, Midcap) | Psychology & System over Prediction | Avoid FNO |Not SEBI Registered


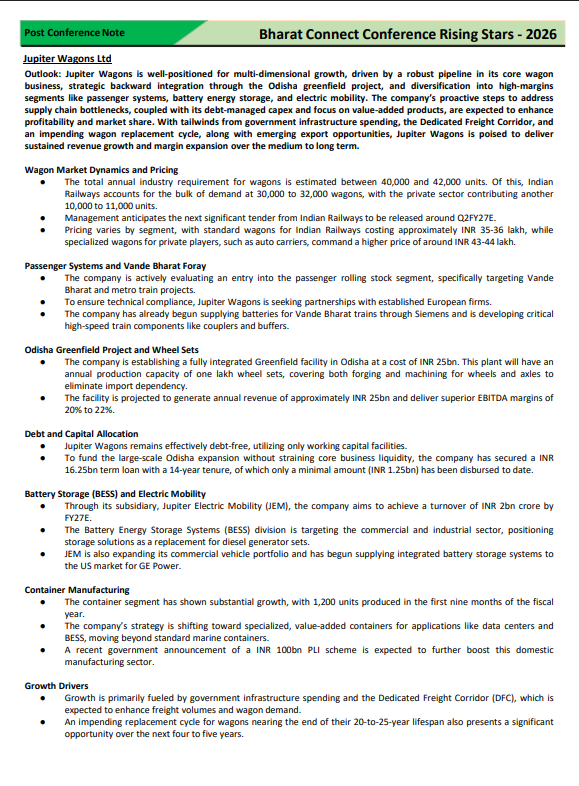
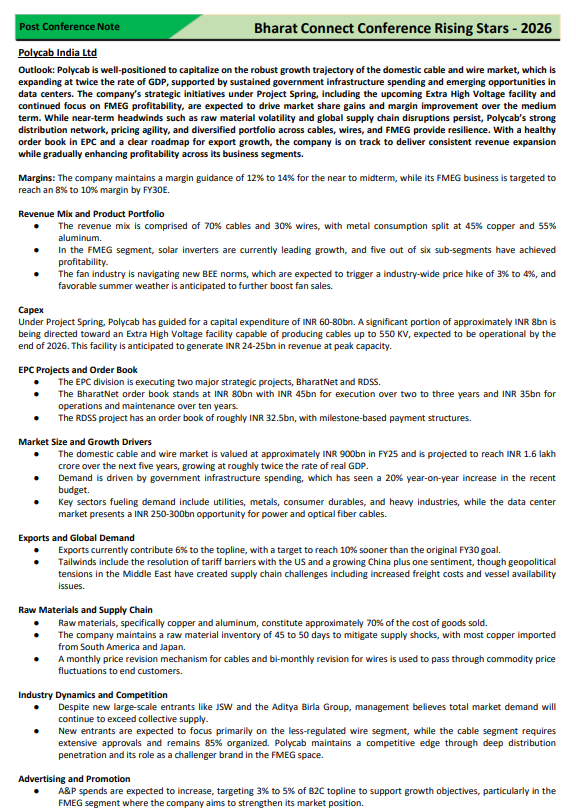
Bharat Connect Conference – Rising Stars | Part 4 Key Management Insights from: 1. Bondada Engineering 2. KPI Green Energy 3. Interarch Building Solutions 4. Parag Milk Foods Key strategic takeaways from management commentary, highlighting growth strategy, expansion plans, positioning, and future triggers 👇 1⃣ Bondada Engineering ⚙️ Bondada Engineering operates across telecom infra, solar EPC, railway infra, and now BESS (Battery Energy Storage Systems), positioning itself as a diversified infra EPC player. Industry Positioning The company has transitioned from telecom EPC to a solar-dominated EPC player, aligning with India’s renewable capex cycle. Growth Strategy Solar EPC has become the core growth engine, with projects ranging from 50 MW to 800+ MW scale. The company is also expanding into BESS, railways, and telecom hybrid models, creating multiple revenue engines. Order Book & Visibility Current order book stands at ₹7,400–7,500 Cr, with potential upside to ~₹8,300 Cr if L1 orders are confirmed - giving strong multi-year revenue visibility. Revenue Mix Shift Solar EPC contributes ~78% of revenue, telecom infra ~10%, product manufacturing ~10%, railways ~2% — a complete shift from earlier telecom-heavy model. BESS Expansion & Capex Entered BESS with projects: ▪️ Tamil Nadu: 200 MW / 400 MWh ▪️ Andhra Pradesh: 225 MW / 450 MWh Capex per project: ~₹500 Cr Expected IRR: ▪️ Tamil Nadu: 14–15% ▪️ Andhra: 10–11% These projects provide annuity-style revenue over 12–13 years. New Growth Triggers 1. Exploring the conversion of ~5,000 telecom towers to solar 2. Entry into railway communication infra (towers + fiber) 3. Strong telecom O&M base: 60,000–65,000 km fiber network maintained Backward Integration Through Bondada Green Engineering, the company manufactures towers, modules, and structures - improving margins and execution speed. Key Clues ◾️ Shift from telecom → solar EPC (78%) = structural re-rating trigger ◾️ BESS projects (₹500 Cr each) indicate move toward long-term annuity cash flows ◾️ 5,000 tower solar conversion can unlock a large hidden order pipeline 2⃣ KPI Green Energy ☀️ KPI Green Energy is evolving beyond a solar IPP into a multi-segment clean energy platform, expanding into data centers, green hydrogen, BESS, and hybrid energy solutions. Industry Positioning The company is positioning itself not just as a solar player but as an integrated energy solutions provider, with exposure to: Solar (IPP + CPP) BESS Green Hydrogen Data center power solutions (high future demand segment) Order Book & Capacity Pipeline Total portfolio: 4.74 GW (as of 2025) ▪️ IPP: 2.17 GW ▪️ CPP: 2.57 GW Expanded portfolio: ~7.9 to 8 GW Long-term target: 10 GW before 2030 Operational capacity: 1.12 GW Under development: 3.61 GW IPP Scale-Up & Revenue Visibility IPP portfolio expected to reach 1.6 GW by early 2027 This ramp-up is expected to significantly improve cash flows from FY27–28 onwards Margins IPP business EBITDA margins: ~85% This is driven by: 1. High-margin IPP model 2. Combined IPP + CPP execution 3. Ability to command premium pricing BESS (Battery Energy Storage Systems) Project size: 445 MW / 890 MWh Project value: ₹900 Cr Viability Gap Funding (VGF): ₹160 Cr Revenue: ➤ ₹99 Cr annually (₹990 million) starting H2 FY27 IRR: ~10–11% (initial) → expected to improve with scale Khavda Execution & Land Bank Advantage Operational project: 240 MW (Khavda region) Additional execution: ~0.6 GW by March 2027 Strategic advantage: ▪️ Land bank: 7,000+ acres (Khavda) ▪️ Power evacuation capacity: 3.57 GW → Enables fast execution cycle (15–18 months) Green Hydrogen & New Energy Secured a 1 TPD (ton per day) green hydrogen project from NTPC Signed MOU with the Gujarat Government: ➤ ₹8,000 Cr (₹80 billion) Also developing: ▪️ 142 MW hybrid (solar + wind) project Global Expansion Signed $4 billion (~₹33,000 Cr) MOU for 5 GW capacity Target geographies: ▪️ Middle East ▪️ Africa ▪️ South Korea Technology & Operational Efficiency 1. Automated solar cleaning robots ▪️ Reduce water usage and manpower 2. Centralized NOC system (with IBM) ▪️ Real-time monitoring ▪️ Improves plant efficiency Growth Drivers 1. Data center demand (24/7 clean power requirement) 2. Entry into energy trading 3. Offshore wind pipeline under development Key Clues ◾️ Transition from solar → integrated energy platform (solar + BESS + hydrogen + data centers) ◾️ Khavda land bank + 3.57 GW evacuation = execution moat + faster scaling ◾️ ₹8,000 Cr hydrogen MOU + 8 GW pipeline = next leg of exponential growth setup 3⃣ Interarch Building Solutions 🏗️ Interarch operates in the Pre-Engineered Buildings (PEB) segment, driven by rising demand from industrial infrastructure, manufacturing, and steel-based construction. Industry Positioning Steel is increasingly preferred due to faster construction, flexibility, and structural strength Demand supported by: ▪️ PLI schemes ▪️ Manufacturing push toward 25% GDP contribution ▪️ New-age sectors: semiconductors, data centers, EV, lithium batteries Business Model & Execution 1. Fully integrated PEB player: ▪️ Design → Engineering → Manufacturing → Supply → Installation 2. Works on fixed pricing and defined delivery timelines 3. Capable of executing complex industrial structures like: ▪️ Microchip plants ▪️ Paint plants ▪️ Large process structures Order Book & Revenue Visibility 1. Order book: ₹1,650 Cr 2. Management revenue target: ~₹2,100 Cr (next year) 3. Execution momentum: 📌📌 ▪️ ₹500 Cr+ revenue achieved in December quarter ▪️ Similar execution expected in March Order intake aligned with execution capacity to maintain delivery commitments Operational Strength Workforce: ~2,000+ employees Pan-India execution, including Assam, Odisha, Kashmir, and South India Workforce mix: ▪️ ~50% direct ▪️ ~50% contract / job-work based Critical functions handled in-house for control Strategic Expansion Post 2004–08, strategy shifted to: ▪️ Diversification across industries ▪️ Larger project focus ▪️ Geographic expansion beyond key cities New initiatives: ▪️ Entry into heavy structures ▪️ Expansion into export markets Cost & Margin Dynamics (As Stated) 1. Steel prices follow a cyclical annual trend (increase Dec–Mar, soften later) 2. Management factors the steel price movement while bidding Key point: ➤ Margin impact from steel fluctuations balances out over the full year ➤ High-cost periods are offset by lower commodity phases 3. Profitability driven by cost control across: ▪️ Steel ▪️ Freight ▪️ Fuel ▪️ Labour ▪️ Consumables Key Clues ◾️ ₹1,650 Cr order book + strong execution run-rate → clear near-term revenue visibility ◾️ Exposure to semiconductor, EV, data center infra → aligned with next industrial capex cycle ◾️ Ability to execute complex projects → strong competitive positioning vs smaller EPC players 4⃣ Parag Milk Foods 🥛 Parag Milk Foods operates a diversified dairy + nutrition portfolio, with a clear shift toward value-added and premium products across both B2B and B2C segments. Business Model & Portfolio Portfolio mix: ▪️ Core dairy: ghee, cheese, paneer, liquid milk ▪️ B2B premium ingredients (clients like Mondelez, Abbott) ▪️ New-age nutrition (Avvatar – whey protein, sports nutrition) ~90% revenue comes from value-added products (non-liquid milk) Strategy focus: ➤ Integrated value chain: cheese → whey → Avvatar → premium ingredients ➤ Avoid disruption of this chain by isolating B2B Margin Profile & Profitability EBITDA margin improved: ▪️ ~5.7% → ~8.5% EBITDA (before ASP – ad & sales promotion): ▪️ ~4–4.5% of sales → ~12.5% Management direction: ➤ Targeting sustained improvement toward double-digit EBITDA Return Ratios ROCE: ~14% ROE: ~12.3% ➤ Consistent improvement post FY22 despite inflation cycles Growth Outlook & Financial Targets Medium-term revenue target: ₹10,000 Cr PAT guidance: ▪️ ₹50 Cr → ₹120 Cr (pre-exceptional) High-Growth Segment – Nutrition Avvatar business: ▪️ ~9% of total revenue ▪️ Crossed ₹100 Cr quarterly run-rate (~₹400 Cr annualized) Positioned as: ➤ Primary long-term growth + margin driver ➤ Supported by rising protein demand among younger consumers Distribution Expansion Depots expanded: ▪️ 12 → 29 (+ Dubai subsidiary) Outlet reach target: ▪️ 4 lakh → 10 lakh+ outlets Ongoing investments in: ▪️ Cold-chain infrastructure ▪️ Distribution scale Product Positioning Cheese: ▪️ #2 position ▪️ ~35% share in organized segment Ghee: ▪️ Strong premium positioning Milk (Pride of Cows): ▪️ Ultra-premium expansion into 8+ cities Cost Environment & Pricing Seasonal pattern: ▪️ Flush season: Oct–Feb ▪️ Lean/inflation phase: Mar–Jun Inflation outlook: ▪️ Expected for 3–6 months ▪️ Risks from fuel, logistics, agri inputs, plastics Pricing action: ▪️ Milk price increased ₹120 → ₹135/litre Key observation: ➤ No significant elasticity → premium pricing intact Margins: ➤ Gross margins held resilient ➤ No major deterioration expected near term Other Strategic Points Tax rate: ▪️ ~11% (due to carried-forward losses) ▪️ Expected to normalize toward 25% HoReCa exposure: ▪️ Cheese-driven ▪️ Impact linked to fuel/LPG costs Innovation: ▪️ Focus on whey-based nutrition products No immediate plans: ▪️ Ice cream ▪️ High-protein RTD variants Key Clues ◾️ 90% value-added mix + margin improvement → clear shift toward premium profitability model ◾️ Avvatar (~₹400 Cr run-rate) → emerging high-margin growth engine ◾️ ₹10,000 Cr target + distribution expansion → scale + brand-led growth phase ahead Source: Bharat Connect Conference – Rising Stars | Arihant Capital Markets Ltd Disclaimer: This post is for informational and educational purposes only.