ทวีตที่ปักหมุด

#MSTR stock price will be at the edge of the observable Universe; and that's not bullish enough.
English
₿Strategy 🟧
14.3K posts

@MarsSTRonaut
Investor of the future. Don't get left behind on Earth. Not Financial Advice.


Trump: The war in Iran has been won.


. My Prediction that Bitcoin Would Take out the 100 week MA & Drop Below $80k and Move to $60k, Toward the 200 week MA was Correct x.com/King0ftheChart… My bear market crash scenario continues to make more sense than anything else out there being said. I've made slight changes now that Bitcoin has reached my minimum objective target of $60k (which I predicted back up at the Oct. top), I think BTC likely reaches the 300 week MA (red line) and bottoms near $51k to $53k, moving beyond the 200 week MA, bottoming below my minimum objective target of $60k. I've also fined tuned my longer term bear market target to approx $12k to $13k. It is possible that BTC takes out the $51k area and reaches $44k before getting the bigger bear market rally I've been predicting but I think the low $50k area is more likely. A less severe selloff could allow BTC to bottom near $54k to $56k. Lastly, I've been predicting an 80% to 90% drop for Bitcoin to the $12k to $25k area. I think BTC will crash into the summer of 2027 and bottom, around May, June, July or August of 2027. I'm leaning toward June or July of 2027. I think it will crash due to a dot com style bust in the stock market, a very bad recession and a banking crisis. The fractal below is from the last bear market from 2021 to 2022. . $BTC #BTC $BTCUSD #BTCUSD #Bitcoin #BTCNews $IBIT $HOLD $BTC_F $MBT $MBT_F $SBIT $BITU $BITI

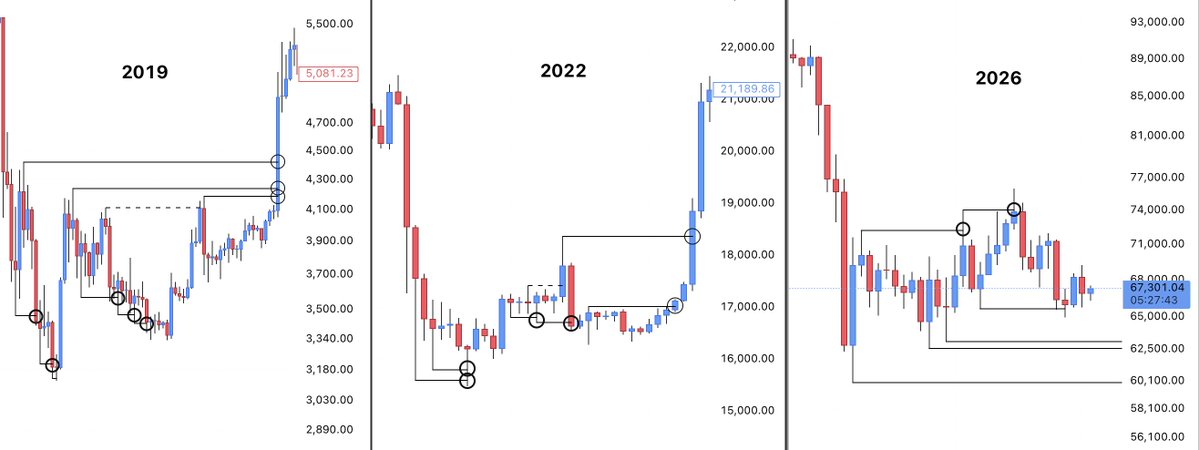
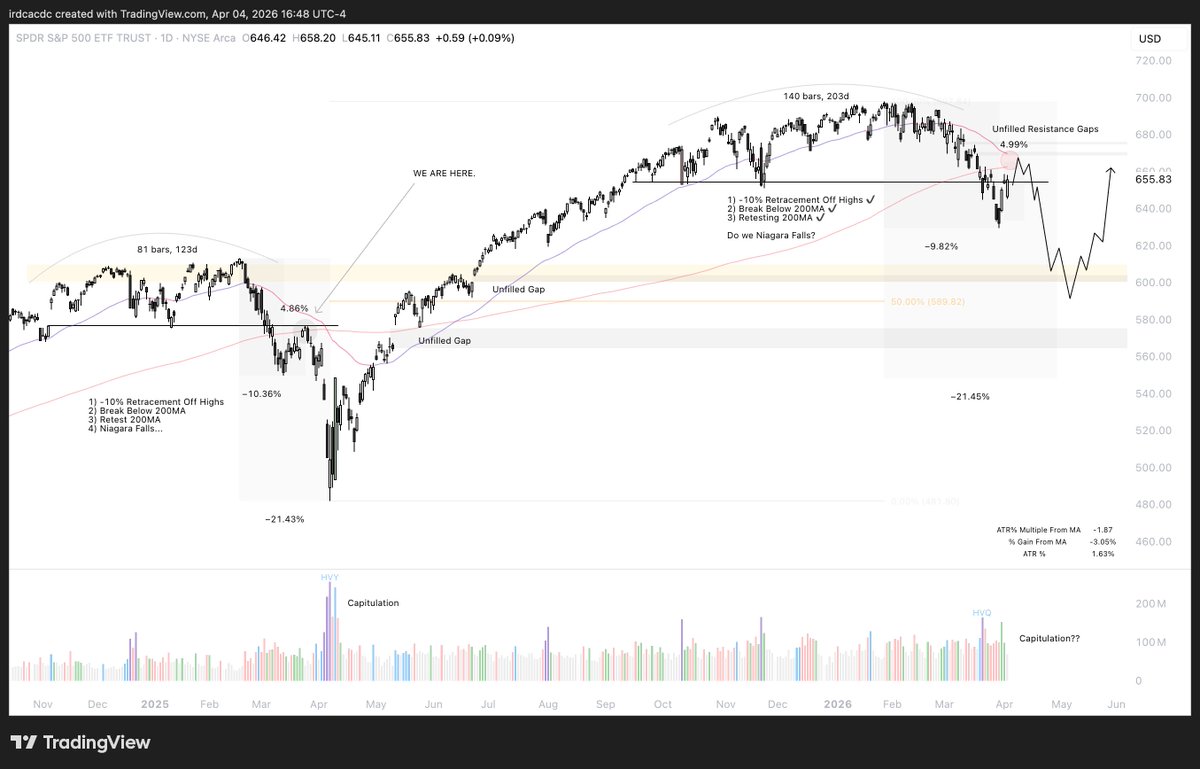
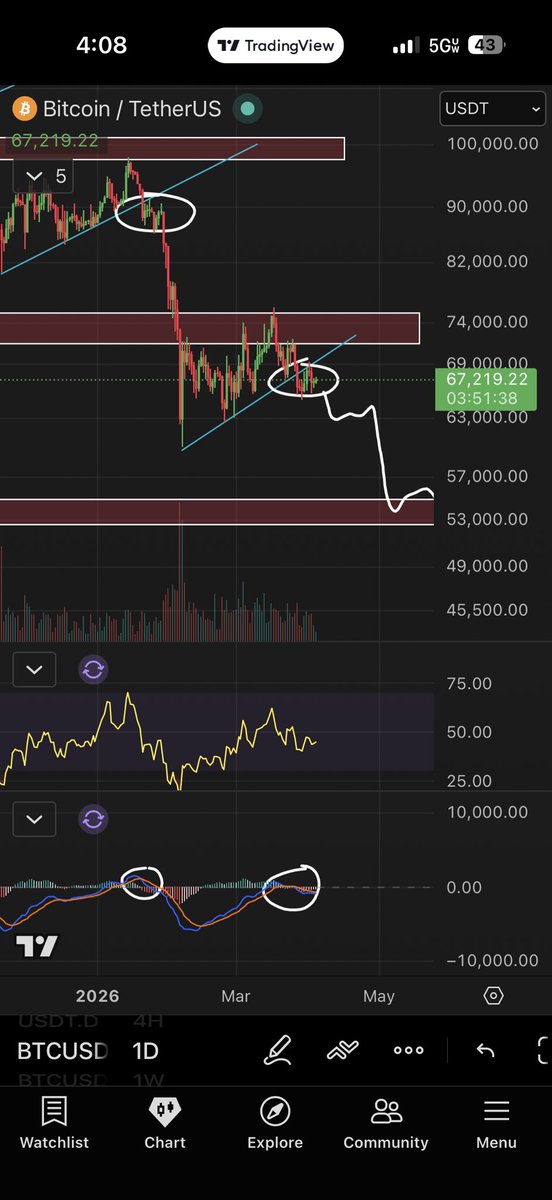
$BTC When comparing the 2019 and 2022 bear market bottoms to current price action, one key difference stands out. At major bottoms, price tends to repeatedly sweep downside liquidity, making it psychologically difficult to enter long positions. In 2019, multiple downside wicks were taken before price eventually broke out, while most upside liquidity remained untouched until the trend reversal was ready to unfold. The same behaviour was seen in 2022, where price continued clearing lows, only taking upside liquidity once accumulation was complete and the breakout began. The current structure looks different. Instead of consistently sweeping the lows, price has been repeatedly taking the highs, making it increasingly difficult to position short while leaving much of the downside liquidity untouched. This is typically not how durable bottoms are formed. Rather, it suggests liquidity is being engineered below, increasing the probability that those lower levels are eventually targeted over the coming weeks or months.
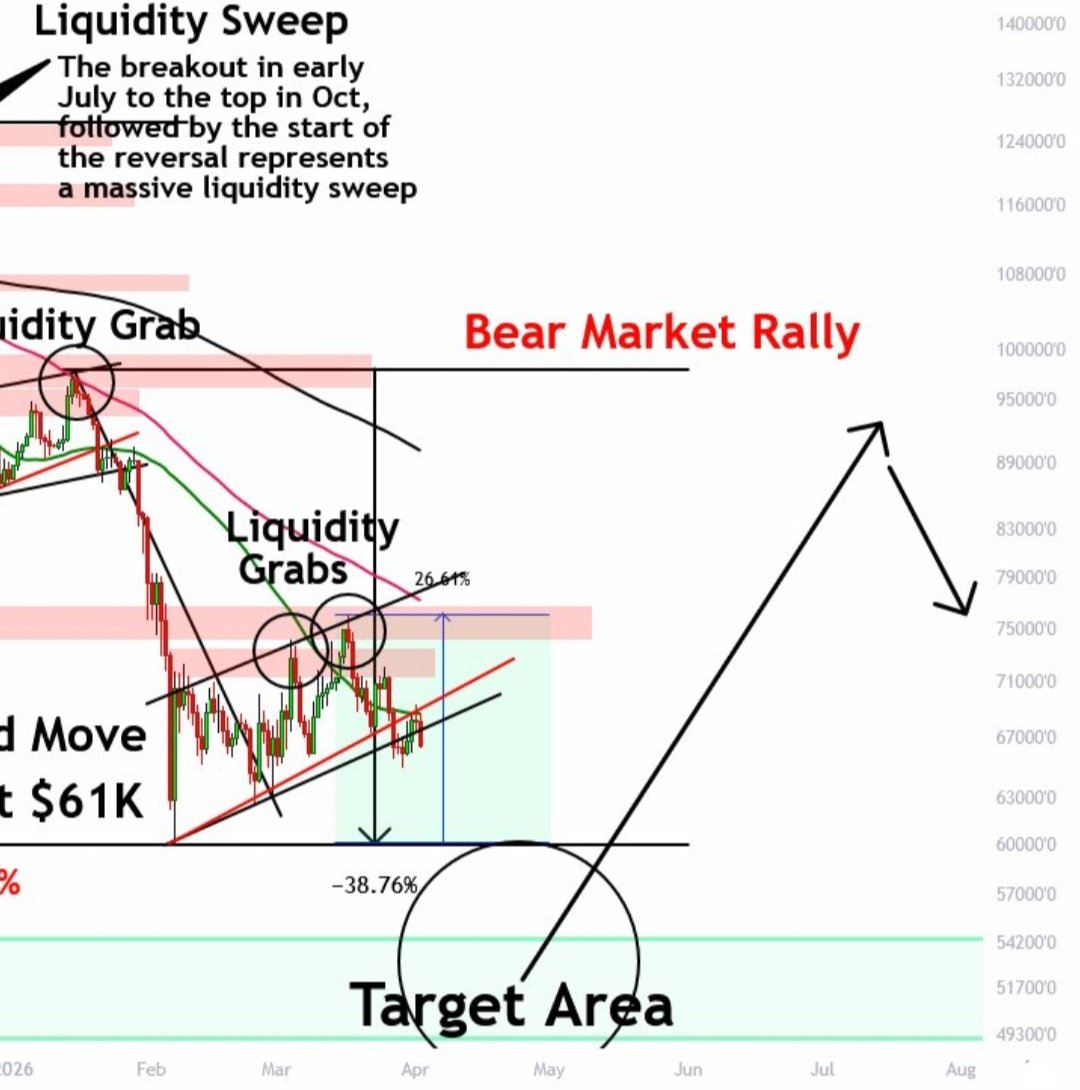

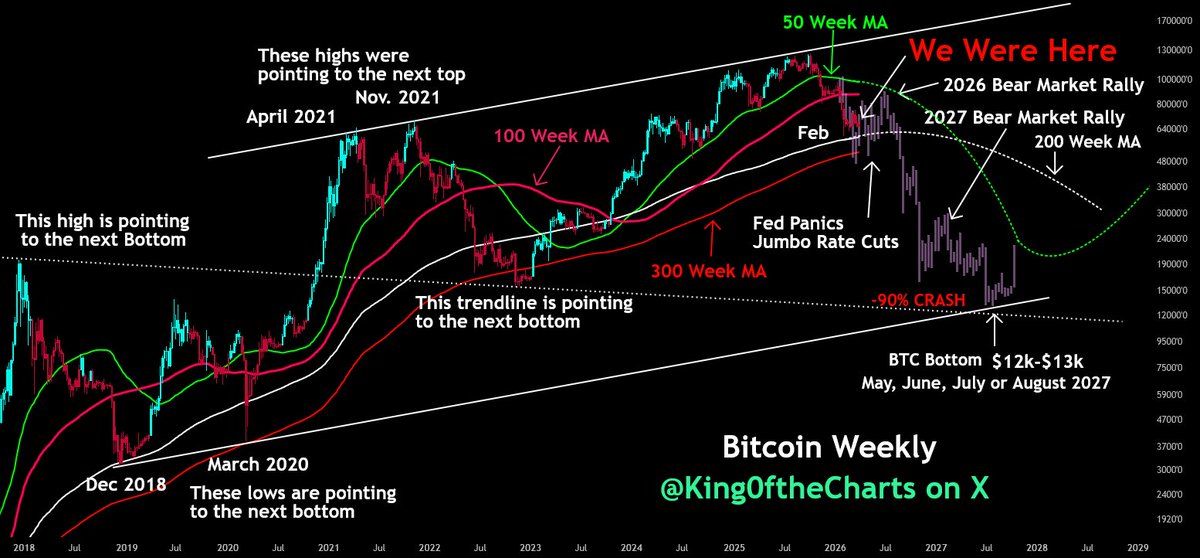
. How would you feel about an 80% to 90% Bitcoin CRASH? The "so called" experts like Tom Lee, who never saw the BTC top or this crash coming continue to tell us that BTC is going to make new highs. Just as Tom Lee & others told us BTC would be at $200K to $250K by the end of 2025. Now they are moving their predictions into 2026, just as I predicted they would do. Tom Lee did this at the last Bitcoin top, the last time he predicted BTC would reach $200K by the end of 2022. BTC ended up crashing to $15K by the end of 2022, not rising to $200K. So far, I've called the day of the Bitcoin top on October 6, 2025. I predicted a 40% to 50% crash to kick off the bear market (which isn't done yet) as BTC has done in the past. I was correct about the top & the crash. BTC has crash 36% so far. BTC will drop to the 200 week moving average (MA) before bottoming, then rally up in a bear market rally back to the 50 week MA for bear market rally. After that the bottom will fall out of BTC and it will drop 80% to 90% from the top. All the bear markets for BTC have been around 80% to 90%. The previous lows in 2018 & 2020 could be pointing to the next bottom, just as the previous two peaks in 2021 were pointing to the next top. I think that is likely to happen given a recession is about to start and soon we will have another banking crisis. They scoffed at me when I posted similar charts like this at the top, but I was right, Bitcoin crashed 36%. If you think BTC has bottom and is now going to new highs, you're wrong. BTC has confirmed a bear market by getting two consecutive closes below the 50 week MA. BTC has never moved to new highs after confirming a bear market without first moving back to the 200 week MA. The 200 week MA is currently at around 57K, so I think BTC drops 50% to 53% before bottoming and getting a big bear market rally back up to the 50 week MA for a test. The red bar images are a clone of the last bear market, a 78% crash, with the tail end of the 2018 bear market added to it for an extended bear market that goes into 2027 for a whopping 90% crash. Lastly, the long term timeframes have confirmed a bear market, but the herd's hopes continue to run high as the experts move their new all time high targets for BTC into 2026 after they failed to materialize by the end of 2025. After the next big drop to the 200 week MA, we will have a massive bear market rally that will convince everyone that the crash is over. It's not! It will only be a bear market rally. $BTC #BTC #BTCNews #Bitcoin $BTCUSD #BTCUSD


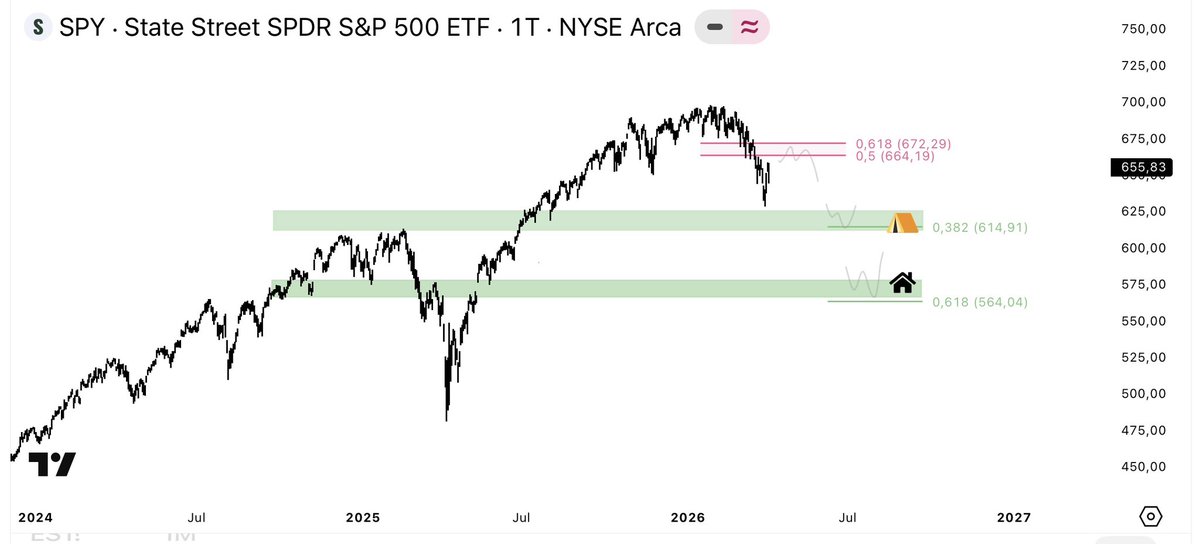
6300, 6150 and 6000. See chart for the importance of these long term trend lines

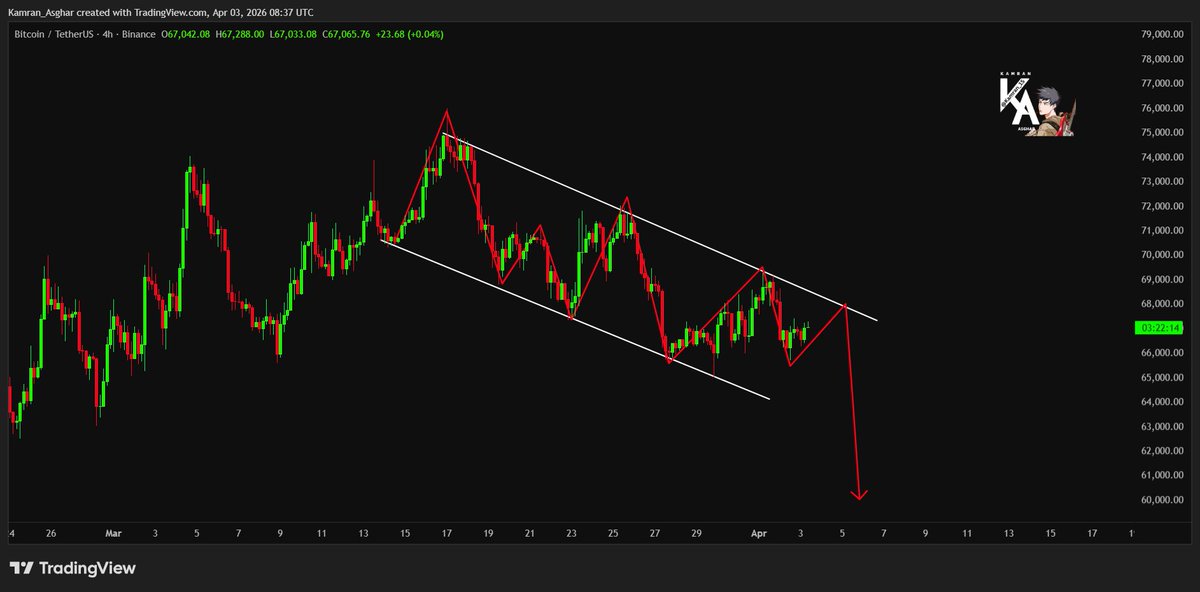
$BTC 1D Repeating the exact same bear flag breakdown like we saw in January. Stay safe out there.