Python Maps

2.3K posts

Python Maps banner
Python Maps

Python Maps

@PythonMaps

Mapping the world with Python. Contact [email protected] Buy my book here - https://t.co/hAaaAxtaYB

Planet Earth เข้าร่วม Ocak 2021
605 กำลังติดตาม77.7K ผู้ติดตาม
ทวีตที่ปักหมุด
Python Maps
Python Maps@PythonMaps·
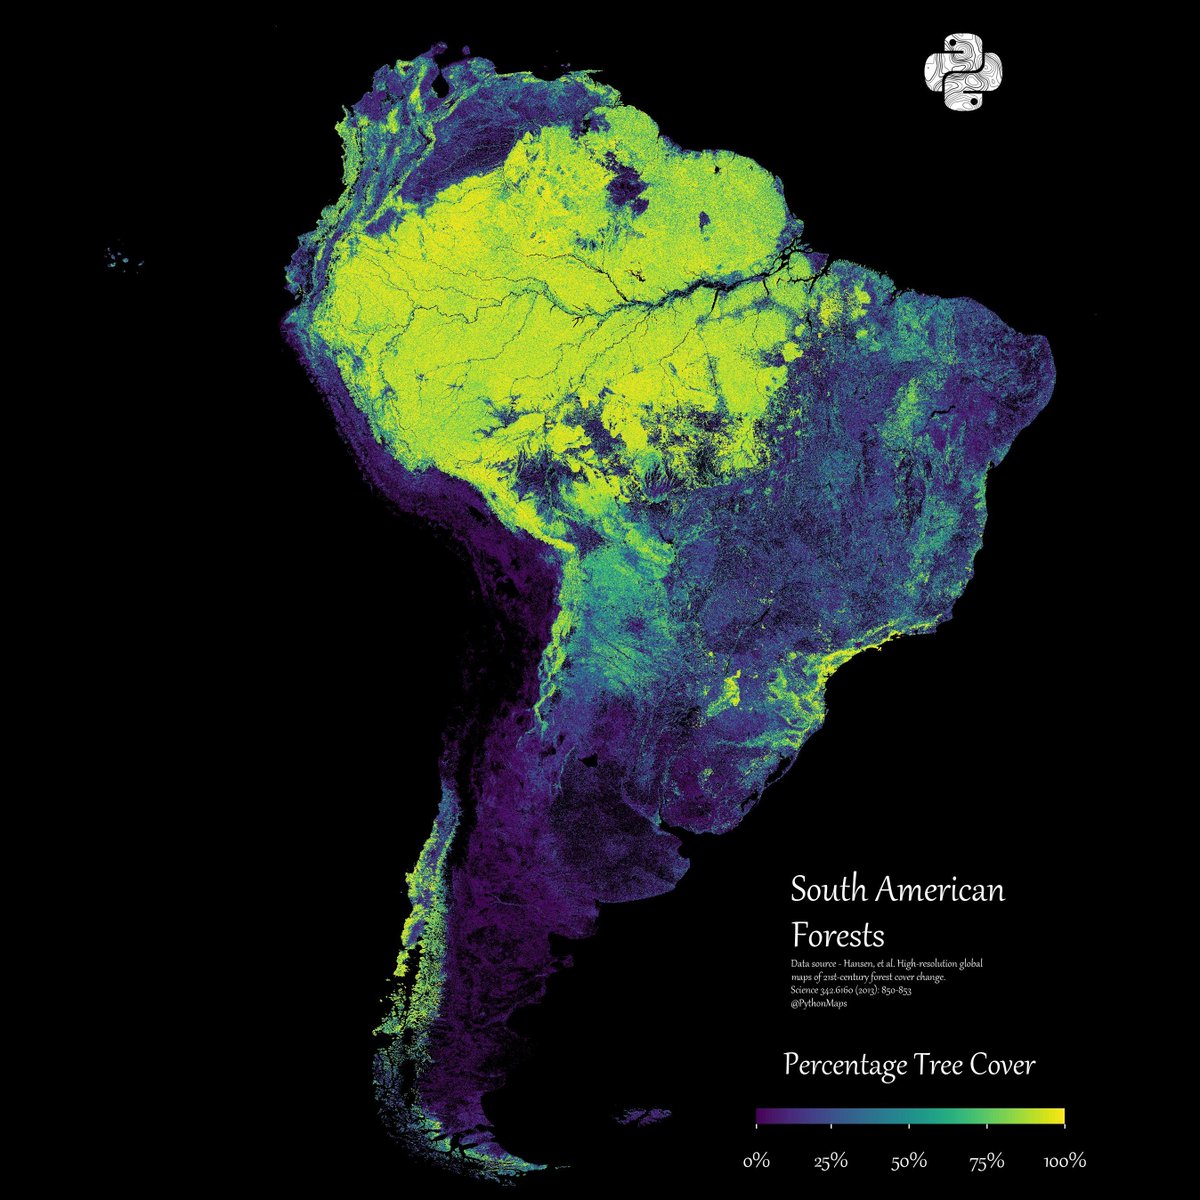
Ending 2023 with my favourite map. South American forests. See you next year!
Python Maps tweet media
English
16
429
2.7K
221.6K
Python Maps รีทวีตแล้ว
VizArt
VizArt@hellovizart·
Like a Cotton candy, the elevation tint "irid" of Ireland.
VizArt tweet media
English
1
2
32
2.9K
Python Maps รีทวีตแล้ว
terence
terence@researchremora·
Power lines (OSM and derived) of Romania. #rayshader adventures, an #rstats tale
terence tweet media
English
0
2
40
4.6K
Python Maps
Python Maps@PythonMaps·
@claudeai Did 95% of the work on this. I've been resistant to the AI hype but it does certainly have its uses. Here is a map showing the status of the death penalty around the world
Python Maps tweet media
English
4
1
33
4K
Python Maps
Python Maps@PythonMaps·
Made a roads map for another project. Thought I would share.
Python Maps tweet media
English
3
10
56
5.3K
Python Maps
Python Maps@PythonMaps·
I created a global forest map showing how forests vary by climate zone - Added twist, 90% of the code + the following post was generated by @claudeai How it was made: Started with Hansen et al. global forest cover raster (% tree cover per pixel) Loaded climate zone shapefile with boreal, temperate, subtropical & tropical regions Masked the forest raster with each climate zone to extract forest cover for that zone only Assigned distinct colormaps: Blues (boreal), Oranges (temperate), PuRd (subtropical), Greens (tropical) Overlaid all four masked layers to show global forest distribution by climate type The overlapping colors reveal where different forest biomes meet across the planet. Built with Python (GeoPandas, Rasterio, Matplotlib) Data: Hansen et al. Science 2013 #Python #GIS #DataViz #Cartography #Forests
Python Maps tweet media
English
9
68
366
22.7K
Python Maps
Python Maps@PythonMaps·
Running a little bit behind. Day 25 of the #30DayMapChallenge - Hexagons - I have used the @KonturInc population density hexagons to generate this population density map of Southern Asia
Python Maps tweet media
English
1
19
112
10.3K
terence
terence@researchremora·
#30DayMapChallenge · Day 26 · Transport. Yet another visualisation of global shipping density. But it's engraved on metal with realistic light and shadow. Because we can do that in R. #rayshader adventures, an #rstats tale
terence tweet media
English
1
7
33
3.1K
Python Maps
Python Maps@PythonMaps·
Day 24 of the #30DayMapChallenge - Places and their names - Here are the World's rivers with labels on some of the major ones.
Python Maps tweet media
English
0
15
73
5.3K
Python Maps
Python Maps@PythonMaps·
Day 22 of the #30DayMapChallenge - Natural Earth Data. I used the Ocean Bottom layer to make a Bathymetry map of Northern Europe.
Python Maps tweet media
English
1
15
83
10.5K
Python Maps
Python Maps@PythonMaps·
Day 21 of the #30DayMapChallenge - Icons - Use icons to highlight points of interest. Here are lighthouses of the Caribbean and Gulf of America. I used a few tricks to make the points look like they are shining out to sea.
Python Maps tweet media
English
2
1
19
3.7K
Python Maps รีทวีตแล้ว
Simon Kuestenmacher
Simon Kuestenmacher@simongerman600·
This visualization by @pythonmaps (a must follow account) shows global shipping lanes in the gorgeous ocean-centered Spillhaus projection. Extremely pleasing to look at!
Simon Kuestenmacher tweet media
English
1
25
104
10.9K
Arrrghonaut
Arrrghonaut@Arrrghonaut·
@PythonMaps Now do venus! I've seen it before and 70% ocean venus would be a great fantasy world
English
1
0
1
62
Python Maps
Python Maps@PythonMaps·
Day 18 of the #30DayMapChallenge - Out of this World. Here is a topographical map of Mars. I have added some hill shading and used a colourmap that simulates an ocean, proportionally equal in size to Earths.
Python Maps tweet media
English
3
6
63
4.7K