Andrei Sota

3.2K posts

Andrei Sota banner
Andrei Sota

Andrei Sota

@Signal_Sigma

Invest Smarter with Signal Sigma: Professional-grade strategies, automated insights, and risk tools. Try free at https://t.co/Ng2smTsc6F No card required.
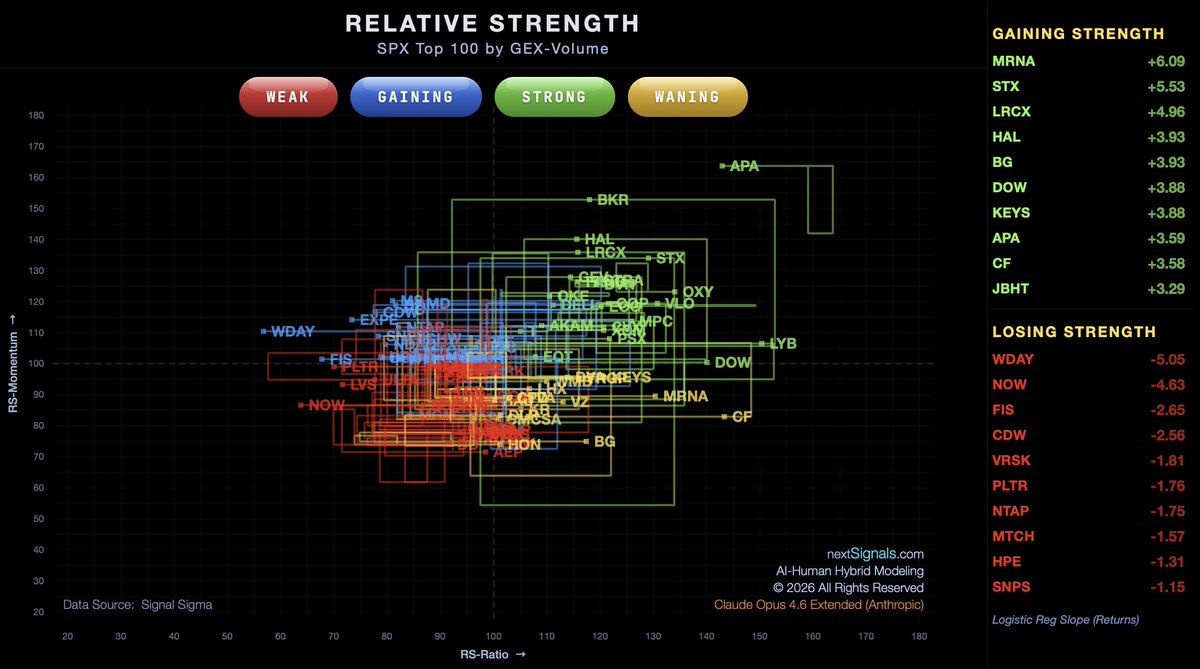
Bucharest, Romania เข้าร่วม Ocak 2013
255 กำลังติดตาม5.3K ผู้ติดตาม
ทวีตที่ปักหมุด
Andrei Sota
Andrei Sota@Signal_Sigma·
API Functionality is live! Claim your API KEY and access the full documentation here: signal-sigma.com/api-docs More to come soon :)
English
1
1
2
496
Andrei Sota
Andrei Sota@Signal_Sigma·
Addendum: retail also heavily trade the $SPY ETF, around 25%-35% of total volume. But high-frequency and professional traders fill much of the order book on a day to day basis.
English
1
0
1
223
Andrei Sota
Andrei Sota@Signal_Sigma·
Oftentimes, institutions also sell the bottom. Plotted on the subgraph is the daily Dark Pools selling volume for the $SPY ETF. Note the very high value reached recently on March 20, almost equal to the April 2025 bottom. Could this be one of the first turnaround signs?
Andrei Sota tweet media
English
1
0
6
641
Andrei Sota
Andrei Sota@Signal_Sigma·
Is Tech suddenly the safe haven? In an atypical move during market stress, $QQQ has outperformed $SPY, as Tech is seen as less vulnerable to energy shocks than your average mid-cap. Plus, given the software rout early in the year, valuations in the sector have cooled off enough to offer a certain margin of safety.
Andrei Sota tweet mediaAndrei Sota tweet media
English
1
0
2
424
Andrei Sota
Andrei Sota@Signal_Sigma·
For the first time since 2016, $NVDA has dropped out of the Millennium Alpha top 15. Our system will take profits on the position at today's rebalance after a 3486 days holding period and 2181% CAGR. Out with the old, in with the new. Cycle of life and investing.
Andrei Sota tweet media
English
1
0
7
454
Andrei Sota
Andrei Sota@Signal_Sigma·
New Trade Alert is up! For those of you who have been following along, nothing here will be a surprise ;)
Andrei Sota tweet media
English
0
0
2
279
Andrei Sota รีทวีตแล้ว
The Tail That Wags The Dog
The Tail That Wags The Dog@TailThatWagsDog·
Signal Sigma Data AI-Integration 1. Signal Sigma, give me the top 100 assets within the S&P 500 that possess price supportive/vol dampening GEX values. 2. Claude, take that data, over a six month time frame and calculate evolving trend strength using a linear regression slope function. 3. Claude, put the 100 stocks into relative positions based on those measures ... and give us a bunch of buttons, zooms, and rollover tooltips to play with and get smart. Interactive Link charming-cuchufli-119884.netlify.app
The Tail That Wags The Dog tweet media
English
6
13
94
24.6K
Andrei Sota
Andrei Sota@Signal_Sigma·
1. Finance and the stock market are as much part of the battlefield as cruise missiles and aircraft carriers. 2. The retail crowd has zero edge in day trading minute candles. By the time the market was open, all of the gains had already been made.
unusual_whales@unusual_whales

BREAKING: Just five minutes before Trump's announcement to halt the attacks on Iran, massive trades reportedly hit the market. In one move, $1.5 billion in S&P 500 (ES) futures was bought while $192 million in oil (CL) futures was sold. These orders were 4–6x larger than anything else at the time. The trader seemingly made huge gains. Unusual.

English
2
0
2
2K
Andrei Sota
Andrei Sota@Signal_Sigma·
Breaks of the 200-DMA and subsequent returns. Not a good signal for bulls right now. If $SPY can't hold the key average by today's close, history tells us that short term performance tends to be negative. 1-Month after a 200-DMA break, only 35% of times $SPY closed higher, with the median return at -2.8% Max upside: +9% Max Downside: -15% Study since 2012: live.signal-sigma.com/invitation/mea…
Andrei Sota tweet media
English
0
1
4
564
Andrei Sota
Andrei Sota@Signal_Sigma·
Year-to-Date, 3 major investing themes emerge: Energy, the clear winner. A mid-market bracket consisting of Industrials, Utilities, Materials and Real Estate -- palpable stuff. The losers: Tech, Financials, Healthcare, Discretionary -- services oriented, ephemeral, less palpable.
Andrei Sota tweet media
English
0
0
3
312
Andrei Sota
Andrei Sota@Signal_Sigma·
Oh wow 🔥 just wow! Have to experiment with this myself! (Believe it or not, as a developer, I struggle to find the time to fully take advantage of the system that we’ve built!)
The Tail That Wags The Dog@TailThatWagsDog

DEMONSTRATION - How to Exploit Signal Sigma Data to Identify Stocks with Near-term Outperformance Potential MACRO THEME: Geopolitical Tension and AI Integration 4 Simple Steps: 1. Identify subsectors and players likely to be resilient in a stagflationary economy impacted by war and AI integration. (65 stock universe, subsectors: Defense and Aerospace, Energy, Critical Minerals and Semis, Cybersecurity and Data Infrastructure, Onshoring and Industrials, Biotech/Pharma) 2. Identify 20 @Signal_Sigma performance metrics with prospective predictive value. Chart the metrics in descending order and report study FINDINGS. Result - Interactive Link: steady-sopapillas-25994f.netlify.app 3. Select and plot momentum stocks whose 20-Day returns exceed regression predicted value. Provide Risk/Return Metrics for the selects. Result - Interactive Link: …traordinary-bonbon-09fbff.netlify.app 4. Create a @Signal_Sigma portfolio to enable monthly rebalancing, the creation of risk-related Alerts, performance tracking and more. @Signal_Sigma ... signal-sigma.com/main-nxt ____________ Notes • At R² = 0.578, The Signal Sigma (proprietary) 20D Score explained nearly 6× more variance in 1-month returns than the next-best metric. Nothing else in this dataset came close. • This demonstration project synthesizes @Signal_Sigma's rich metrics data and employs AI-assisted decision support and renders raw data in visually impactful presentations. • If you are at all interested in AI-assisted portfolio development, I urge you to read the FINDINGS section below the table (highlighted in the static image below but fully interactive in the link above).

English
0
1
5
811
Andrei Sota
Andrei Sota@Signal_Sigma·
Early idea for an intra-market correlations regime indicator. When 90D correlations are high (green bars), it usually means stocks have moved in an "indiscriminate" way during the previous period. This usually tells us that a decline has occurred, since that's when "all correlations go to 1). Conversely, there are periods of price return dispersion, like we are seeing now. This tends to align more with market topping processes, as stocks begin to move independently of each other and the market. Longer periods of dispersion are also when our stock picking systems generate most of thier alpha. In progress: live.signal-sigma.com/invitation/mea…
Andrei Sota tweet media
English
0
1
1
387
Andrei Sota
Andrei Sota@Signal_Sigma·
Institutional dip buying until a certain point: Accumulation patterns in Dark Pools during the last 6 months show that whenever equities declined, large traders bought the dip. This has repeatedly occurred during the late November and mid December drops from last year. Right now, there's been ample buying on weakness between March 05-10, with $SPY priced at around $670-$680. As the decline continued, accumulation flows receded from their peaks. This tells us that below $660, the market can temporarily turn into a "falling knife" rather than a clear buying opportunity.
Andrei Sota tweet media
English
0
2
11
772
Andrei Sota
Andrei Sota@Signal_Sigma·
Technically speaking, the market has completed a consolidation / correction phase between two key support and resistance levels. What comes next entirely depends on which of these levels is breached. A break above $694 means that geopolitics / inflation have been largely resolved. A break below $656 will most likely translate into further weakness. One thing is clear - the trading environment has transitioned from trending into range-bound.
Andrei Sota tweet media
English
0
0
5
350
The Tail That Wags The Dog
The Tail That Wags The Dog@TailThatWagsDog·
A BIG STEP BACKWARD Deliberately. Awakened. A serious change of heart. For the past two months, I’ve taken what little domain expertise I have … and fed data and prompts into Claude. Sort of a deep dive, fueled by my own curiosity. First impression: H o l y s h I t. Second impression: Caveat emptor (buyer beware). Hey, I love shiny new toys but … pause … this whole AI infatuation FinTwit has come to manifest … might be just that … infatuation. Say what? 1. Claude lacks real-time market awareness. Human experts are far superior at following order flow. (Take, for example, @VolSignals … a seasoned trader and analyst capable of identifying subtle shifts in tone as they relate to dealer re-positioning. (Again, I have zero affiliation with Dan.). And Dan’s one of a healthy number of experts ... who show up here each day, motivated by a genuine interest in teaching and in enjoying discourse. Here's another: @SamanthaLaDuc . I've watched Samantha pull together geopolitical events and changes in order flows ... into these stunning and incredibly accurate market timing calls ... for ... like the past 15 years. Claude ... you wannabe. 2. Claude has no skin in the game. The pressure exerted by the weight of the consequences of a person’s financial decisions … over time … sharpens one’s judgment. Not seeing that in these Claude-based options analyses. Not seeing anything remotely close to responsibility. 3. Fact, Claude is unconscious ... thus, has no intuition. Claude has no gut instinct. We do. Precious gift. 4. Portfolio managers who manage money for others … who have lived through prior market crashes … will have a level of pattern recognition that no LLM is likely to ever possess. Don't bother arguing that; you'll embarrass yourself. 5. Claude cannot build ongoing client relationships … especially those with a sensitivity to a person’s risk tolerance. Is Claude re-shaping FinTwit? Are you kidding? 1. Undeniably. For professionals who have spent years building their expertise … I can’t imagine how it must feel to see this *wave* of faith … of unfounded trust … in an algorithm … that is striking at the core of their livelihood. That has got to hurt. 2. Claude … as a substitute for those financial professionals that show up here … sharing deep financial sector knowledge … proprietary data sources they’ve invested so much in developing … seriously? How insulting this all must feel. I feel horrible that I've posted my initial enthusiasm with this. My sincere apologies. So sorry. No more hyping Claude. 3. We (myself included) are the herd, folks … this irresponsible crowd … devoid of independent thought … chasing this notion that AI tools can replace human judgments and finally give us the edge we’ve been waiting for. Haven’t we been here … done that? Robo-advisors; how’d that work out? So … I’m pulling back. Way back. No more public display of Claude analyzing the market. I don’t want to risk promoting the machine over the human … nor risk offending those who’ve taught me so much and have worked so hard to figure out WTF is going on in this wild and crazy market. My byline has long been AI-Human Portfolio Construction. Removed. Claude … yeah, okay, I get you … you’re a helper bee. Good helper bee. But just a tool. Nothing more.
English
11
3
76
14.4K
Andrei Sota
Andrei Sota@Signal_Sigma·
A sharp rally in the US Dollar, coinciding with rising equity market cross correlations and two different signals of waning momentum. When 3 / 4 of these align, outcomes are usually not pleasant. A historical perspective here: live.signal-sigma.com/invitation/mea… (and more color on the study in our Weekly Preview Article)
Andrei Sota tweet media
English
0
0
4
371
Andrei Sota
Andrei Sota@Signal_Sigma·
A historical perspective on today's oil crisis, which is orders of magnitude higher than anything seen previously. This is unfolding against a backdrop of high valuations and a massive equity market rally, none of which were pricing in any kind of shock.
Andrei Sota tweet media
English
0
0
4
309
Andrei Sota
Andrei Sota@Signal_Sigma·
Spent a good chunk of my weekend studying the current market environment and historical precedent regarding oil shocks. Where we are now and where we might end up. Everything I concluded from the analysis is in our latest newsletter.
Andrei Sota tweet media
English
0
0
2
249
Andrei Sota
Andrei Sota@Signal_Sigma·
Couple of observations: A 2-day oil spike is different from 20 days (or potentially longer) +20% is different from +60% a 1 year returns horizon is different from 1-3 months In general, when one creates a signal with a low enough trigger threshold, 12-month returns are better because that's just the nature of the market. However, when you single out fewer instances, especially in the right historical context, a different reality emerges.
Andrei Sota tweet media
English
0
0
1
295
The Kobeissi Letter
The Kobeissi Letter@KobeissiLetter·
History suggests oil shocks are buying opportunties: Over the last 40 years, the S&P 500's 12-month return following a 2-day oil spike of +20% has been +24%. In 6 out of 7 instances since 1986, the S&P 500 has been higher 1 year after such an oil spike. The strongest recovery was +54% following the 2020 pandemic crash, driven by a massive stimulus response from central banks and governments. The only negative outcome was -11% during the 2008 Financial Crisis. Put differently, every oil shock over the last 40 years that did not lead to a prolonged recession was followed by a strong rally. Oil shocks are historically brief and provide long-term buying opportunities.
The Kobeissi Letter tweet media
English
163
400
2.6K
395.1K