VynthraQuant

264 posts

VynthraQuant banner
VynthraQuant

VynthraQuant

@VynthraQuant

Quantitative crypto & macro intelligence · Regime detection, liquidity models & proprietary signals · Free dashboard → https://t.co/iHX2MqNj0K

เข้าร่วม Nisan 2025
100 กำลังติดตาม134 ผู้ติดตาม
ทวีตที่ปักหมุด
VynthraQuant
VynthraQuant@VynthraQuant·
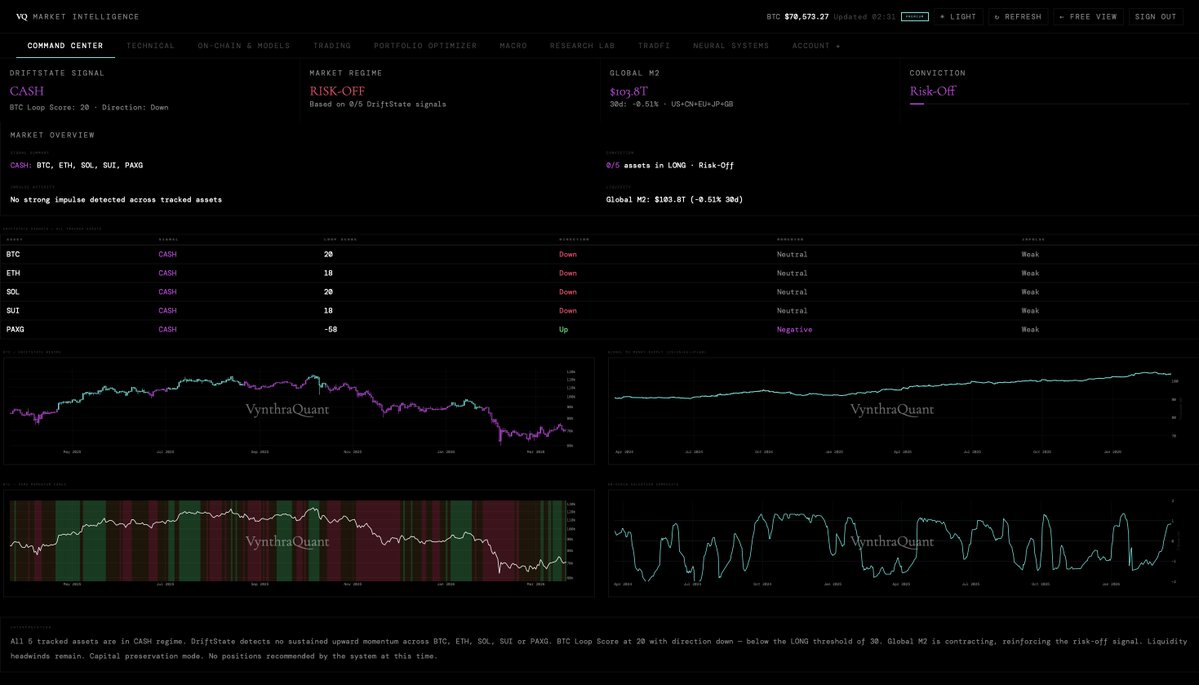
VynthraQuant is live. 
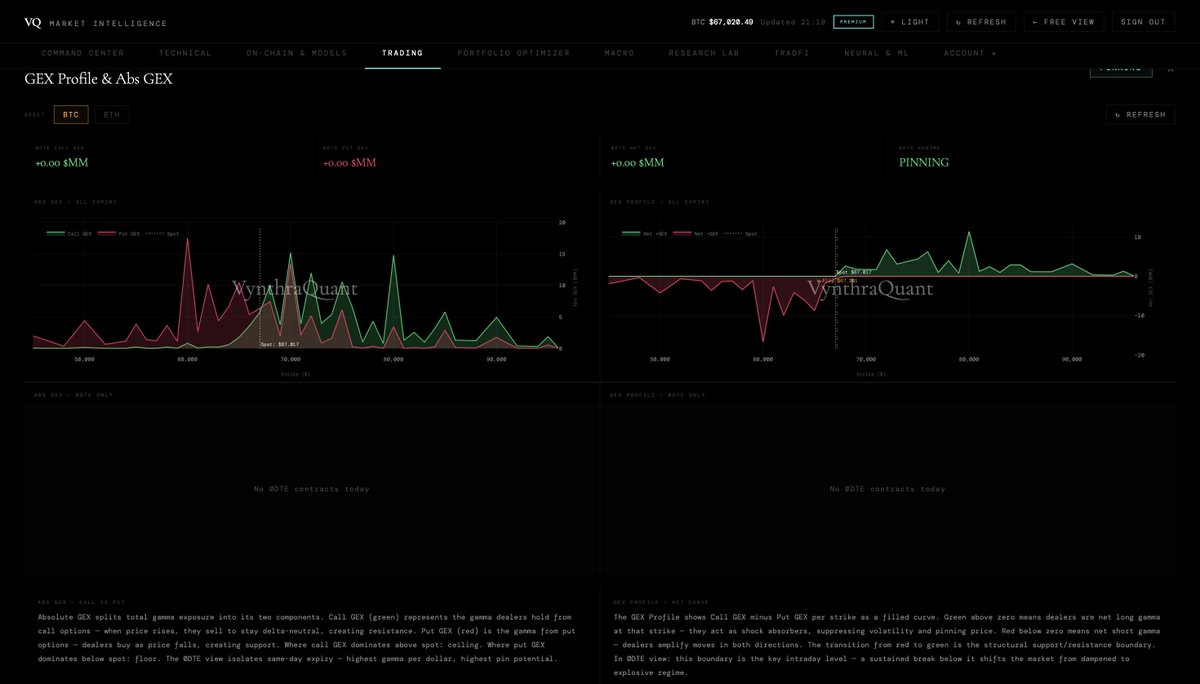
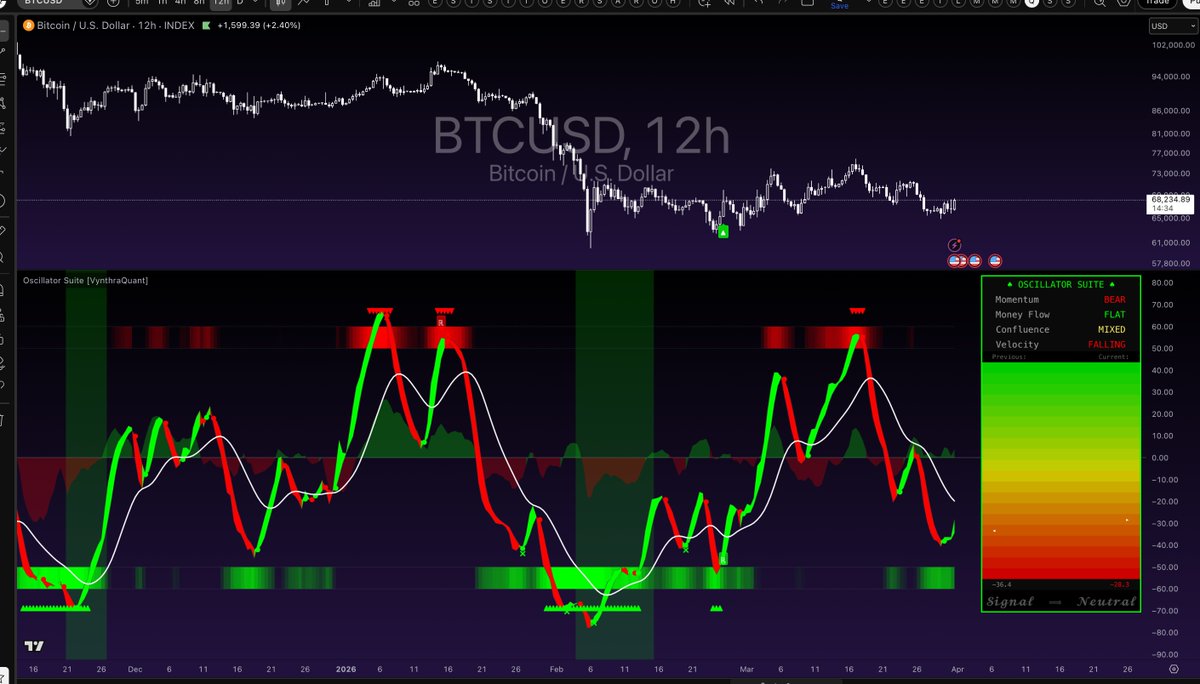
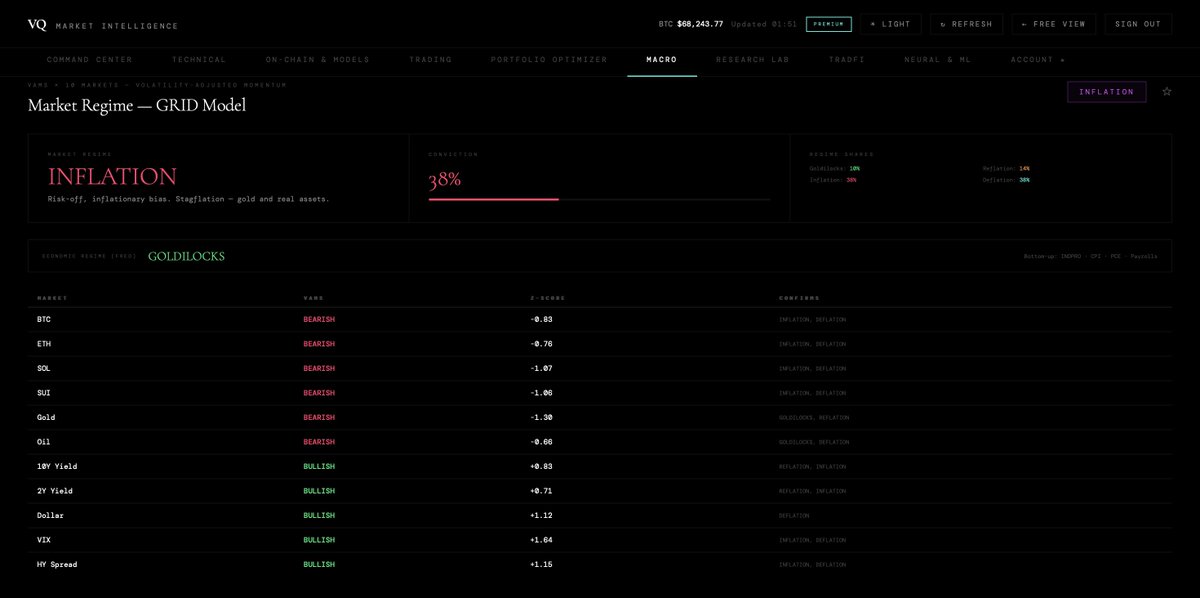
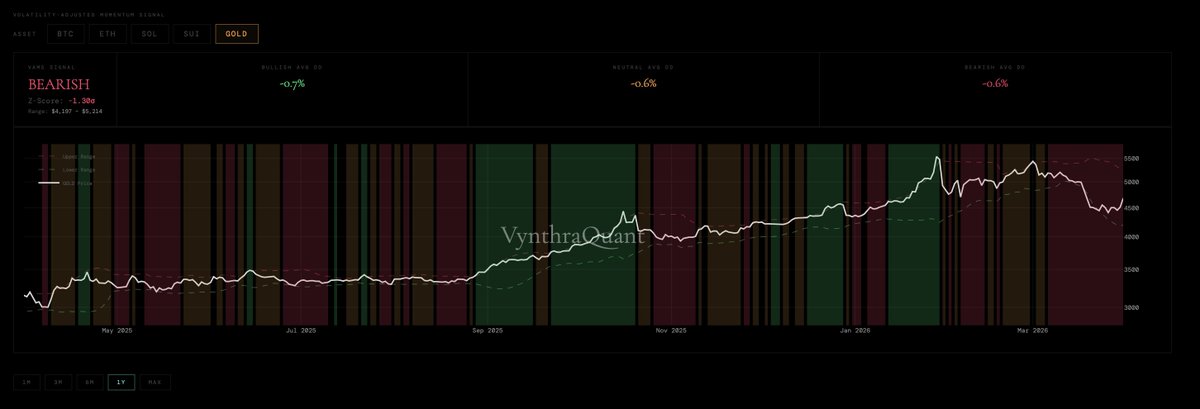
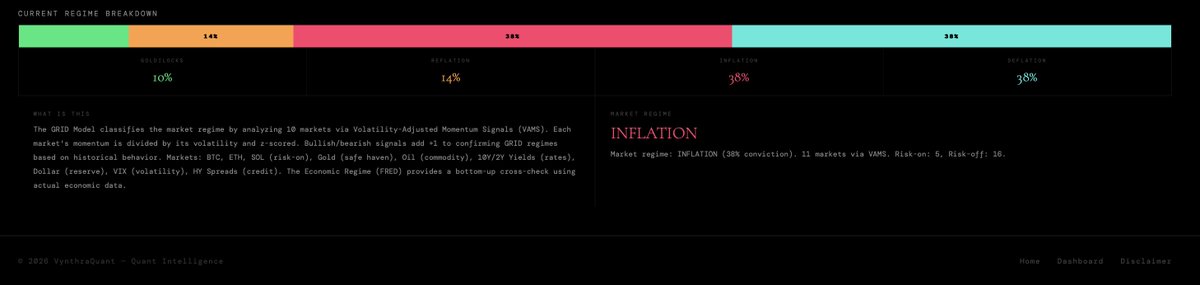
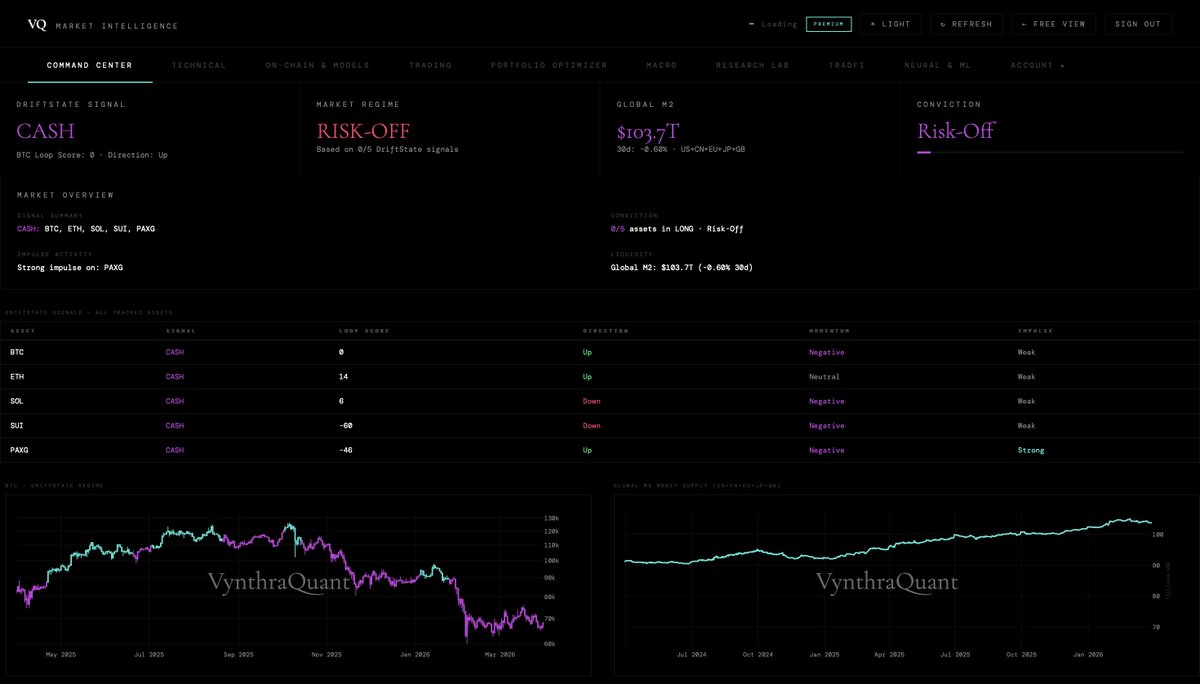
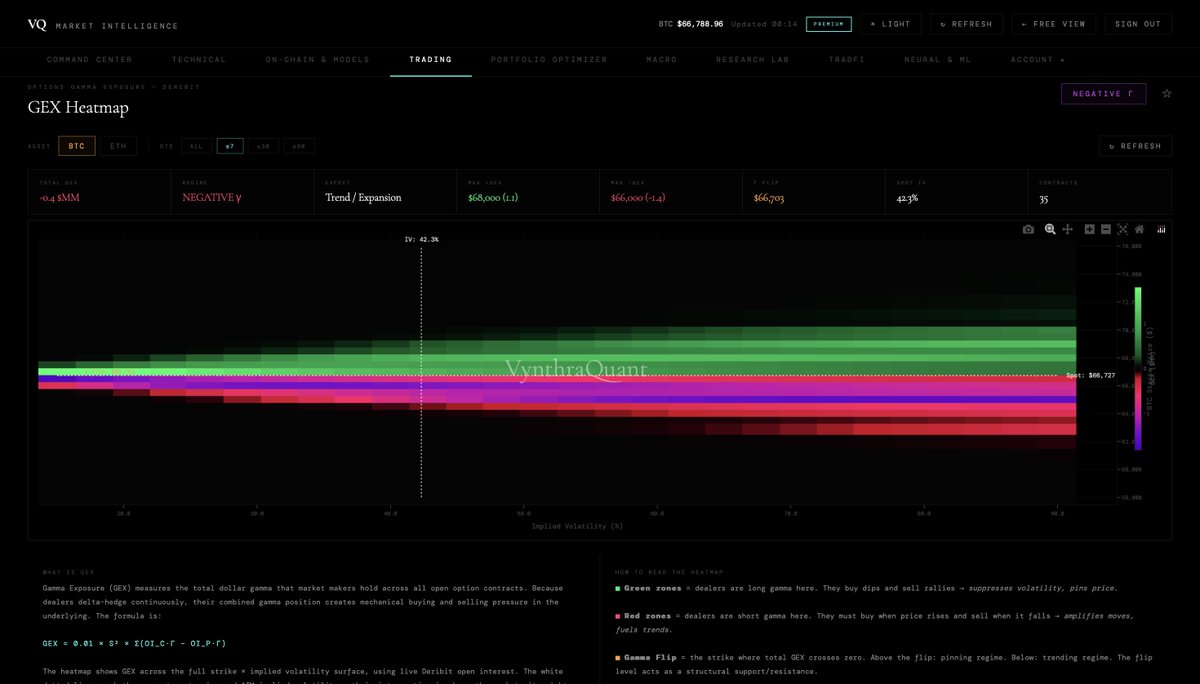
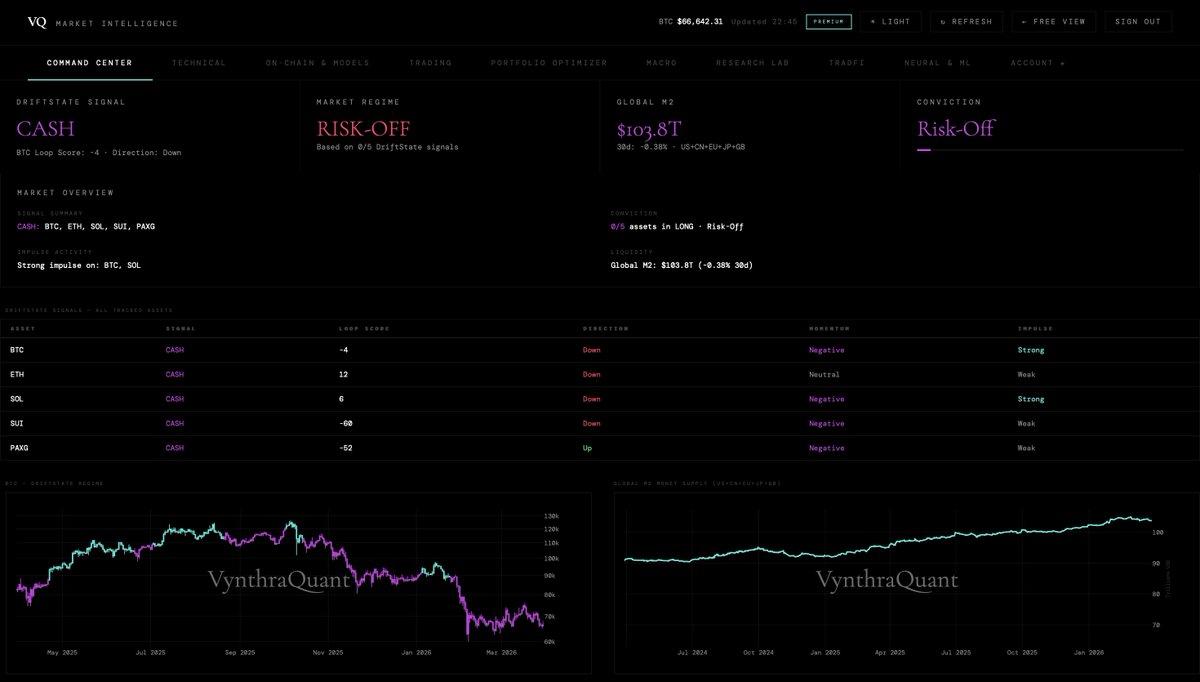
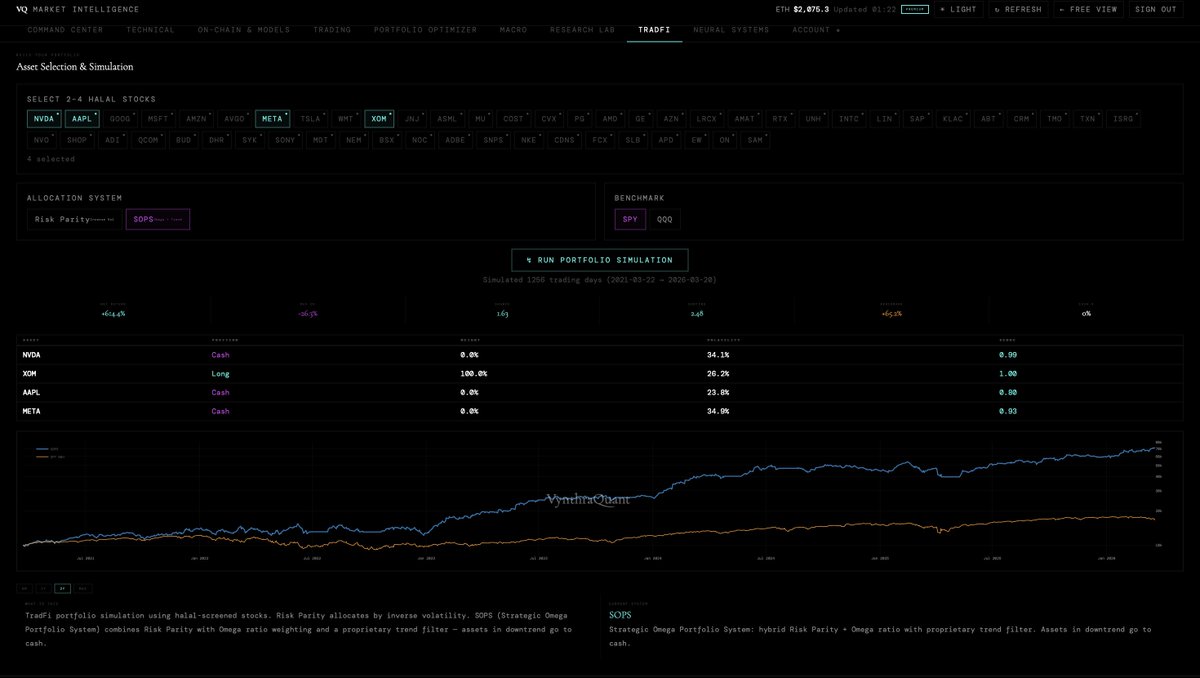
Institutional-grade crypto & macro intelligence, built for serious capital allocators. 
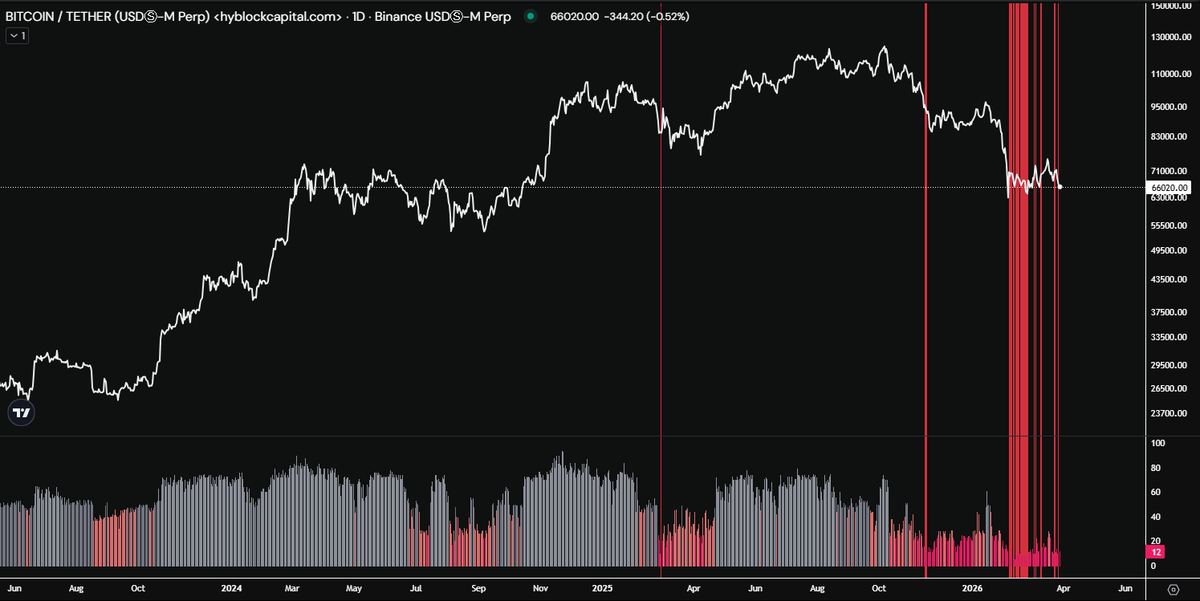
3 tiers. 40+ proprietary models. Real-time regime detection. Free to start. No card required. 🔗vynthraquant.com Here's what you get ↓
VynthraQuant tweet media
English
5
1
12
518
VynthraQuant
VynthraQuant@VynthraQuant·
Mechanical friction determines the velocity of price. If you aren't tracking Gamma Exposure (GEX), you are trading blind. We have officially deployed four new institutional-grade GEX models to the VynthraQuant dashboard. These charts map the "invisible" buy and sell pressure generated by options dealer hedging, the primary force behind modern market structure. 1. Absolute GEX (Top Left): Identifying the Floor and Ceiling The Data: Splits total gamma into Call GEX (Green) and Put GEX (Red) magnitudes. BTC Context: We see a major Call GEX peak between $70K–$80K. This creates a "Gamma Ceiling", dealers must sell into price strength to remain delta-neutral, suppressing rallies. Conversely, the Put GEX concentration at $60K–$65K acts as a structural floor where dealers are forced to buy. 2. GEX Profile (Top Right): The Volatility Regime The Data: Net Call GEX minus Put GEX. Green (above zero) indicates a Pinning Zone where dealers dampen volatility. Red (below zero) indicates an expansionary regime where dealers amplify moves. BTC Context: Price is currently at $67K within the green zone. Dealers are acting as shock absorbers, compressing realized volatility. A break below the "Gamma Flip" (the red/green transition) would signal a regime shift toward explosive downside. 3. 0DTE Modules (Bottom): Intraday Precision The Data: High-fidelity view of Same-Day Expiries (0 Days to Expiration). The Edge: 0DTE contracts represent the most explosive gamma positions due to terminal time decay. While currently inactive (standard for Thursday volume cycles), these modules identify the strikes most likely to trigger a "gamma squeeze" during Friday expiries or high-impact events. Strategic Execution: When your trend models signal a move, the GEX Profile acts as the final filter. A long signal in a "Pinning Zone" (Green) lacks mechanical fuel; a long signal passing into a "Negative Gamma" (Red) zone has the wind at its back. vynthraquant.com Free trials available
VynthraQuant tweet media
English
0
0
3
69
VynthraQuant
VynthraQuant@VynthraQuant·
@CryptoSwingSys Thanks man. A major infrastructure update is hitting the dash soon. We’re moving beyond standard execution towards full-scale systematic risk management. Stay tuned👀
English
0
0
1
36
VynthraQuant
VynthraQuant@VynthraQuant·
Deriving the market's "True" expectations through the Breeden-Litzenberger lens. We have officially released the Probability Surface on the VynthraQuant dashboard. This tool moves beyond simple price charts by deriving the Risk-Neutral Probability Density Function (PDF) directly from live Deribit options chain data. By applying the Breeden-Litzenberger formula, calculating the second derivative of call prices with respect to strike, we reveal the market's implied probability distribution for any given expiry. Key Intelligence Metrics: Most Likely Price (Mode): The price the options market is most heavily pinning. Expected Value (EV): The probability-weighted mean of all outcomes. Skewness & Kurtosis: Quantifying the asymmetry of upside potential vs. the thickness of the "crash" tails. Multi-Expiry Slices: View the evolution of market conviction across various time horizons. Stop guessing where the market might go. Start measuring what the market is actually pricing. vynthraquant.com Free trials available
VynthraQuant tweet mediaVynthraQuant tweet media
English
1
0
8
165
VynthraQuant
VynthraQuant@VynthraQuant·
The VynthraQuant Oscillator Suite is currently signaling a transition into a Neutral state for $BTC on the 12h timeframe. Despite the recent price consolidation, the underlying momentum remains structurally weak, preventing a high-conviction "Buy" signal. Current Internal Metrics: Momentum: Bear Velocity: Falling Money Flow: Flat Confluence: Mixed The system identifies "falling velocity" as a primary risk factor; entering long while momentum is decaying leads to unfavorable R/R. We wait for the green "Accumulation" clusters to return before re-engaging with size.
VynthraQuant tweet media
English
1
0
7
183
VynthraQuant
VynthraQuant@VynthraQuant·
Macro-regime shifts dictate asset expectancy. Trading against the "Inflation" GRID is a statistical uphill battle. The VynthraQuant GRID Model has shifted into an INFLATION regime (38% conviction). By analyzing Volatility-Adjusted Momentum Signals (VAMS) across 11 diverse markets, from core crypto and safe havens to credit spreads and yields, the system identifies a clear "Risk-Off" bias with an inflationary tilt. GRID Analysis Breakdown: Regime: Inflation (Stagflationary bias) Risk-Off Signals: 16 vs. Risk-On Signals: 5 Asset Z-Scores: BTC (-0.83), ETH (-0.78), and SOL (-1.07) are all displaying bearish momentum. Macro Drivers: Bullish Z-scores in the Dollar (+1.12), VIX (+1.84), and HY Spreads (+1.15) confirm systemic stress. When the GRID identifies an Inflation/Deflation tie (38% each), but the underlying VAMS are overwhelmingly bearish for risk assets, capital preservation becomes the highest-alpha trade.
VynthraQuant tweet mediaVynthraQuant tweet mediaVynthraQuant tweet media
English
0
0
4
106
VynthraQuant
VynthraQuant@VynthraQuant·
Regime identification is the only signal that matters in a volatile market. The VynthraQuant Command Center remains in a 100% CASH posture across BTC, ETH, SOL, and SUI. While the retail market seeks "value" in a downtrend, the DriftState model confirms a structural Risk-Off regime with zero assets currently meeting long-entry criteria. Current Portfolio State: DriftState Signal: 100% CASH Conviction: 0/5 Assets in LONG (Risk-Off) Impulse Activity: Strong downside bias (Neutralized) BTC Loop Score: 8 (Sub-threshold for entry) We are not "timing the bottom." We are waiting for a verified shift in regime impulse before re-deploying capital. Until then, preservation is the priority.
VynthraQuant tweet media
English
0
0
4
102
VynthraQuant
VynthraQuant@VynthraQuant·
M2 is a lazy way to track Global Liquidity. It completely ignores the Shadow Monetary Base and the friction in how capital actually moves through the system. If money is stuck in the TGA or Reverse Repo, it doesn't matter how high M2 goes, it’s not reaching risk assets. Liquidity is a pipeline, not a binary switch. Our dashboard tracks the transmission across these stages: 1. TGA (Government spending) 2. Bank Reserves 3. Repo/RRP Dynamics 4. Commercial Lending If the flow bottlenecks at any of these points, M2 is just noise. Stop trading a single line on a chart and start looking at the plumbing.
VynthraQuant tweet media
English
0
0
0
88
VynthraQuant
VynthraQuant@VynthraQuant·
Gamma exposure (GEX) dictates the mechanical environment of the market. The VynthraQuant GEX Heatmap reveals a stark divergence in dealer positioning between BTC and ETH. Understanding the "Gamma Flip" and strike-level concentration is essential for quantifying whether price action will be suppressed or amplified by dealer hedging. BTC: Negative Gamma Regime Total GEX: -$0.4MM (Negative γ) Market Regime: Trend / Expansion Mechanical Bias: High volatility. Dealers are forced to sell into weakness and buy into strength, accelerating price moves. ETH: Positive Gamma Regime Total GEX: +$0.4MM (Positive γ) Market Regime: Pin / Mean Reversion Mechanical Bias: Volatility suppression. Dealer hedging acts as a stabilizer, pinning price near the $2,031 Gamma Flip. Successful execution requires trading the environment, not just the chart. BTC is currently positioned for high-velocity expansion, while ETH remains in a mean-reverting "gravity" well.
VynthraQuant tweet mediaVynthraQuant tweet media
English
0
0
1
119
VynthraQuant
VynthraQuant@VynthraQuant·
Probabilistic risk estimation is a prerequisite for effective capital preservation. On January 21, 2026, the VynthraQuant ML engine flagged a positive Rate of Change (RoC) in drawdown probability. This shift signaled a structural breakdown in the volatility regime long before the price action confirmed the trend. The data since the RoC inflection: BTC Drawdown: -25.55% Model State: High Risk Current 30-Day Outlook: 62.7% probability of a >10% drawdown; 30.4% probability of a >20% drawdown. Systematic trading isn't about predicting the future, it’s about quantifying the current risk distribution. When the probability of tail risk spikes, exposure must be rationalized.
VynthraQuant tweet mediaVynthraQuant tweet media
English
0
0
3
117
VynthraQuant
VynthraQuant@VynthraQuant·
Capital preservation is the first step to outperformance. The VynthraQuant Command Center rotated to a 100% CASH position across BTC, ETH, SOL, and SUI ahead of the current regime shift. By identifying a "Risk-Off" market regime with strong downside impulse, the system successfully neutralized beta exposure. The result: Sidestepping a -25.25% drawdown in BTC/USD over the last 64 days. Current Signal: Cash (Risk-Off) Bear Conviction: 57.63% Impulse: Strong Downside Performance Metric: 2.98 Profit Factor While the retail crowd holds through volatility, systematic rotation preserves the dry powder necessary for the next high-conviction entry.
VynthraQuant tweet mediaVynthraQuant tweet media
English
0
0
3
120
VynthraQuant
VynthraQuant@VynthraQuant·
The moment alpha becomes common knowledge, it's already dead. Correlation breaks precisely when everyone starts positioning for it. Alpha is a moving target. By the time a narrative like "global liquidity correlation" is 100% believed by the masses, the edge has decayed into noise. If everyone sees the same signal, there is no signal left.
English
0
0
6
1.5K
Quinten | 048.eth
Quinten | 048.eth@QuintenFrancois·
Remember when we all 100% believed the Bitcoin - global liquidity correlation?
Quinten | 048.eth tweet media
English
617
589
6.3K
859.2K
VynthraQuant
VynthraQuant@VynthraQuant·
GM! ☀️ We are officially up nearly 10% since our last TradFi portfolio update. 🚀 While the broader market was shaking, the Strategic Omega Portfolio System (SOPS) remained focused on the strength of XOM while keeping the volatile growth names in cash. This is the power of quantitative allocation, capturing the vertical moves while the benchmark stays sideways. Don't trade on hope. Trade on the system. 🏛️📈 Get on the Dash vynthraquant.com Free Trials Available
VynthraQuant tweet media
English
0
0
1
64
VynthraQuant
VynthraQuant@VynthraQuant·
Precision in TradFi: Building the Strategic Portfolio 📈 Our Asset Selection & Simulation engine goes beyond crypto. We’ve integrated a specialized TradFi suite, focusing on Halal-screened stocks and sophisticated allocation models. The power of the SOPS (Strategic Omega Portfolio System) is on full display here. It combines Risk Parity with Omega ratio weighting and a proprietary trend filter. If an asset enters a downtrend, the system doesn't hope, it moves to CASH. Simulation Insight: Assets selected: NVDA, AAPL, META, XOM. Current Allocation: While growth giants like NVDA, AAPL, and META are currently in CASH to protect against downside, the system is 100% LONG on XOM. Result: The equity curve shows clear outperformance against the benchmark through disciplined trend-following. We don't just pick stocks; we manage risk through math. Whether it's Crypto or Halal TradFi, the logic remains the same: Follow the trend, protect the capital. Get on the Dash 🛠️(Free trials available) Stop manual guessing. Run your own simulations and see the data before you enter the trade. vynthraquant.com
VynthraQuant tweet media
English
1
0
9
218
VynthraQuant รีทวีตแล้ว
Hikaru
Hikaru@oneforthewish·
《 Chart: $BTC + Fear & Greed Index < 10 》 Market stuck in prolonged fear. Are you in that crowd? Could you have prevented it? That's how one grows. BTC is 47% below ATH+below the 200-day SMA Of 500 simulated paths over 1 year: 60% end 20%+ lower (by @VynthraQuant). DYOR
Hikaru tweet mediaHikaru tweet mediaHikaru tweet media
English
2
2
17
432
VynthraQuant
VynthraQuant@VynthraQuant·
If you were on the Dash, you would have seen this move coming a mile away. 📉 The data doesn't lie. Our GEX Heatmap was flashing a clear NEGATIVE GAMMA regime for both $BTC and $ETH well before the flush. What does this mean? In a Negative γ environment, market maker hedging mechanics change completely. Instead of suppressed volatility, every move is amplified. Dealers are forced to sell as price drops and buy as it rises, creating a "Trend/Expansion" effect that fuels aggressive price action. BTC GEX: Total GEX at -$173 MM with a Flip Level at $67,706. ETH GEX: Total GEX at -$61 MM with a Flip Level at $1,990. When you trade below the Gamma Flip, you are trading in the "danger zone" where volatility acceleration is the default. Stop guessing where the bottom is and start looking at the mechanical pressure driving the market. 🛠️📊 Get on the Dash Stop being exit liquidity. Understand the positioning of the players that actually move the tape. vynthraquant.com Free Trials Available
VynthraQuant tweet mediaVynthraQuant tweet mediaVynthraQuant tweet mediaVynthraQuant tweet media
English
1
1
10
278
VynthraQuant
VynthraQuant@VynthraQuant·
These results look strong, but a 5% max drawdown in backtests often raises some flags. Can you clarify whether slippage, fees, and execution latency were fully modeled? Also, was the strategy tested strictly out-of-sample, and are the signals free from repainting or lookahead bias? Backtests can look very clean without those factors, so it would be interesting to see how this holds up in real trading.
English
2
0
4
386
VynthraQuant
VynthraQuant@VynthraQuant·
@m_schouten Spot on. Live markets are the ultimate truth-teller. Backtests are just a map, it’s the robustness testing that tells you if the map actually matches the terrain. Respect for the work you're doing with Algo Studio! 🤝
English
0
0
0
8
Michael
Michael@m_schouten·
@VynthraQuant This. The industry needs more of this mindset. A beautiful backtest means nothing if it can't survive live markets. Built Algo Studio for exactly this — continuous validation of whether the edge holds in production.
English
1
0
1
17
VynthraQuant
VynthraQuant@VynthraQuant·
While other "quants" are busy selling you cherry-picked equity curves, we are tearing ours apart before they ever see the light of day. 🛠️📉 The industry is full of survivorship bias. A backtest can look like a straight line to heaven, but if the underlying engine isn't robust, it’s just a house of cards waiting for the first sign of real-market volatility. The Reality of Quantitative Testing: This specific indicator was "ready" according to the initial equity curve. But after running it through our Diagnostics, the truth came out. Despite the "pretty" chart and seemingly perfect entries, our stress tests confirmed it simply was not good enough. We don't ship "maybe." We don't ship "lucky." We refuse to release anything that doesn't maintain absolute robustness across every metric we track. We do the hard work of breaking our own systems so that the market doesn't do it for you. At VynthraQuant, perfection is the minimum standard. Get on the Dash Stop trading on hope. Start trading on statistically verified robustness. vynthraquant.com Free Trials Available
VynthraQuant tweet media
English
1
0
14
245