ทวีตที่ปักหมุด

Does the four-year $BTC cycle still exist?
I believe that history rhymes, but it doesn't simply repeat itself.
Based on the current macroeconomic environment and market data (as of early 2026),
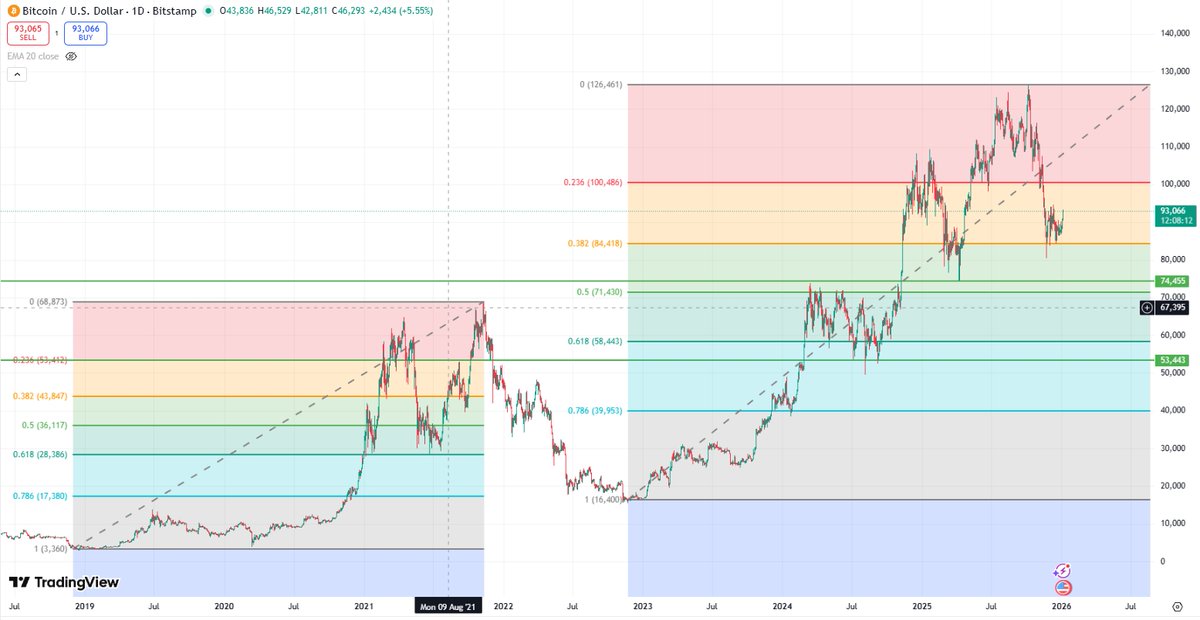
While this cycle and the previous one are highly similar in terms of Fibonacci time cycles, there are indeed significant differences in price behavior and structure.
I. Analysis of the Core Reasons for the "Differences" Between the Two Cycles
Although both cycles followed the "post-halving rally" script, the trend in (2023-2026) was clearly affected by the following three new variables, which are the main reasons for the differences in Fibonacci retracement patterns:
1⃣Qualitative Change in Market Participants: The "Smoothing Effect" Brought by ETFs
Previous cycle (19-22): This was a typical "retail investor + Grayscale" bull market. The nature of the funds was "fast in, fast out," and highly emotional. This led to the dramatic "double-top structure" in 2021 (April and November), interspersed with drops of over 50%.
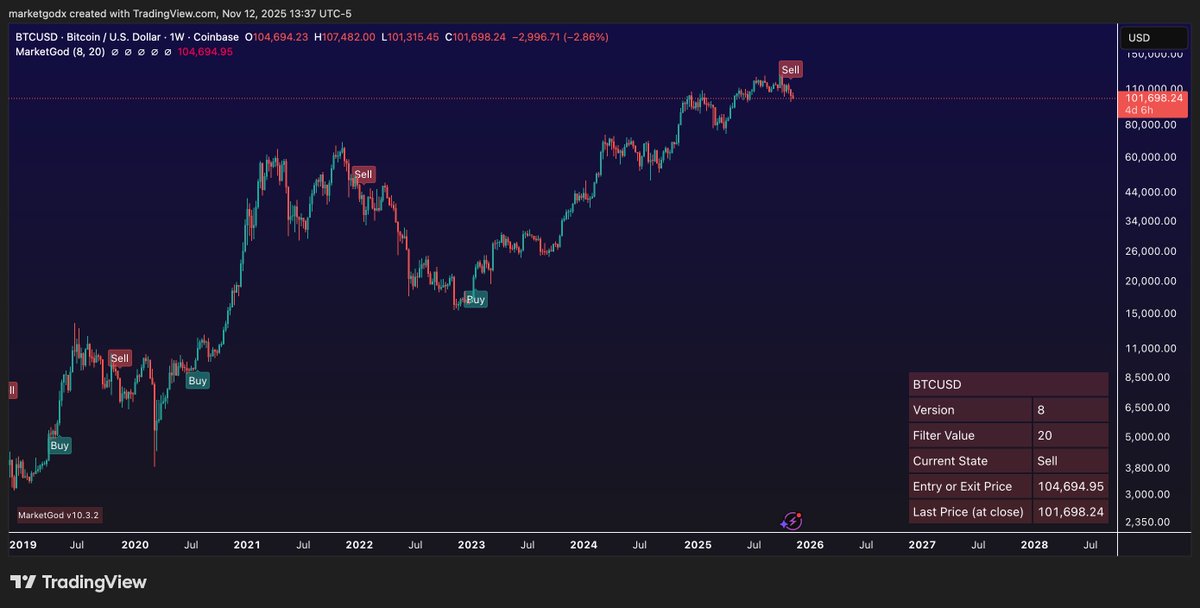
This cycle (23-26): This is a "spot ETF + sovereign nation" bull market.
ETF funds are "slow money," providing stronger buying pressure at key Fibonacci support levels (0.382 and 0.5), resulting in shallower pullbacks in this cycle compared to the previous one (it's unlikely to see a 50% drop in a single week again).
Difference: The candlestick chart within the blue box shows a more "continuous" trend, with fewer extreme fluctuations and fewer spikes, and the Fibonacci levels are advanced more steadily, but there is also less "crazy explosive power."
2⃣Differences in Macroeconomic Liquidity: From "Massive Monetary Easing" to a "High-Interest Rate Environment"
Previous cycle: In 2020-2021, global central banks engaged in massive monetary easing, with interest rates close to 0. Cheap money pushed up all risk assets, allowing BTC to easily break through the Fibonacci 2.618 and even 3.618 extension levels (relative to the bottom).
This cycle: In 2024-2025, the world is in the early stages of a rate-cutting cycle, but interest rates are still relatively high. High capital costs limit the use of leverage. Differences Observed: This led to Bitcoin, despite breaking its previous high in this cycle, showing a lack of momentum when it reached the high Fibonacci resistance zone (such as the 1.618 extension level near $120k-$130k), failing to experience the frenzied "bubble-like" surge seen in 2021. This is also known as "diminishing marginal returns."
3⃣"Solidification" of Chip Distribution
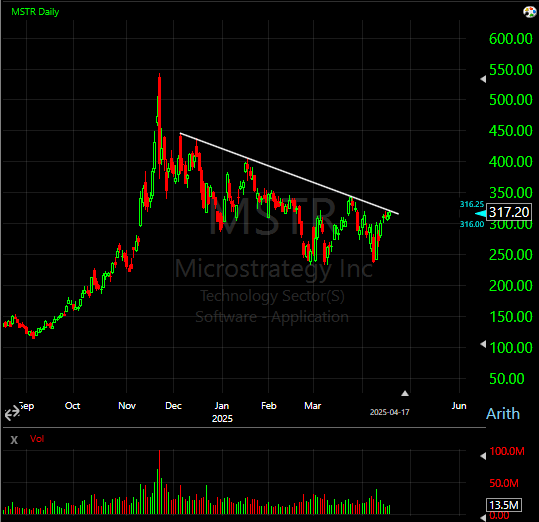
With MicroStrategy, various ETFs, and national teams (such as El Salvador, Bhutan, etc.) continuously buying and locking up holdings, the circulating supply in the market is decreasing.
Differences Observed: This creates a situation where "it's easy to rise but difficult to fall," but in the absence of large-scale FOMO from new retail investors, the price is more likely to fluctuate widely within the Fibonacci range rather than experiencing a unilateral straight-line surge.
II. So: Is the "BTC follows a 4-year cycle" still reliable?
Conclusion: The time cycle remains valid, but the price magnitude is not.
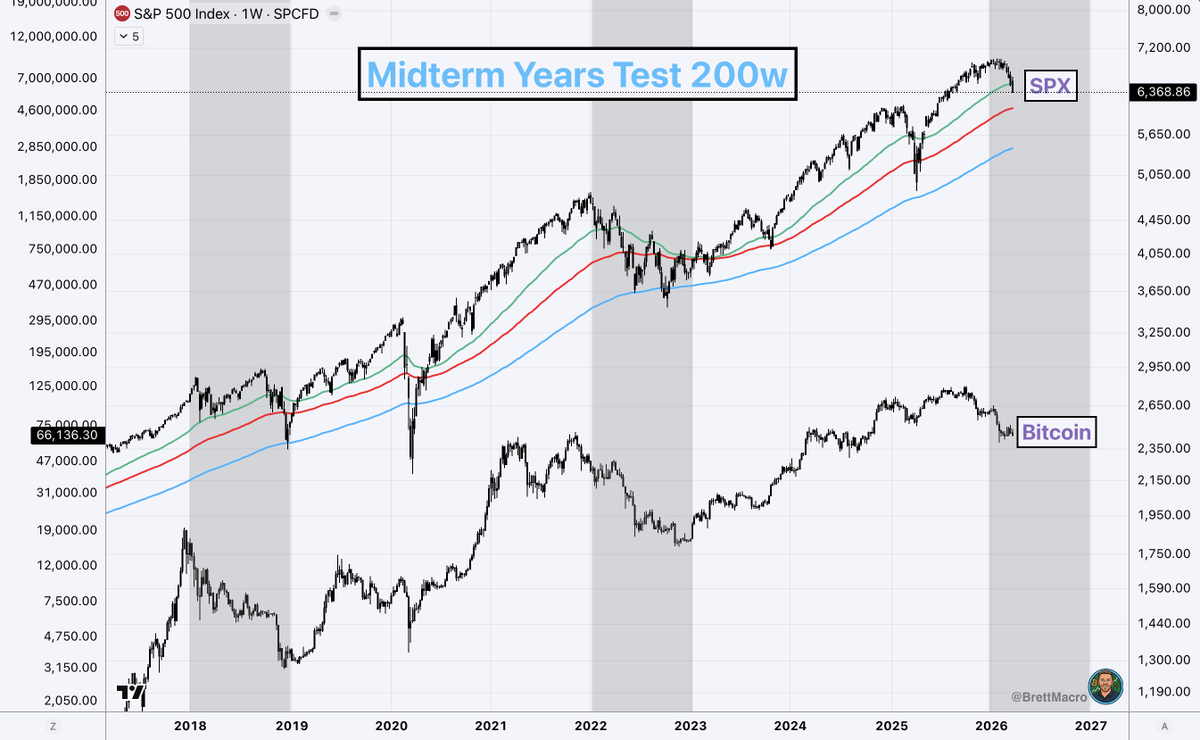
Based on the comparison chart and the current market state, we can draw the following conclusions:
1⃣Valid Part: Time Nodes
Bitcoin still perfectly aligns with the 4-year cycle rhythm:
Bottom: End of 2018 vs. End of 2022 (perfect correspondence).
Halving and Start of Rally: Takeoff after the 2020 halving vs. takeoff after the 2024 halving (consistent rhythm).
Peak: Peak in 2021 vs. Peak in 2025 (currently, a cyclical high point did appear in 2025).
This shows that: The firmly believed "time cycle" is still the strongest roadmap, and applying past patterns to the "time axis" is valid.
2⃣Invalid (or needs correction) Part: Price Magnitude
However, if you try to apply the Fibonacci price increase ratio from the previous cycle, you might be disappointed:
Magnitude Decay: It increased 100 times in 2013, 20 times in 2017, and 3-4 times in 2021 (calculated from the previous high). If this cycle perfectly replicates the Fibonacci ratios of the previous cycle, the price should reach over $180,000. However, in reality, the market is more likely to encounter significant resistance at the 1.272 - 1.618 levels.
Pattern Change: The bear market in 2026 may not experience an 80% crash like in 2022. Due to the support from ETFs, the correction might stop at the Fibonacci 0.5 or 0.618 levels (approximately $60k-$70k), instead of falling back to the starting point.
III. My Advice
Looking at these two charts, my advice is: "Trust the cycle, but don't blindly believe in specific price points."
Respect the Time: Since we are already at the end of the blue box (2026), according to the 4-year cycle, this is usually a "stagnant period" or "gradual decline period." Don't expect a major upward surge like in the early stages.
Adjust Expectations: Don't fixate on the highest price point ratio of the previous cycle. If the current price is stagnating at a high Fibonacci level and unable to break through the previous high, then the probability of the cycle peaking is very high.
Focus on Different Factors: Closely monitor the capital flows of ETFs. This is a "lifeline" that was not present in the previous cycle. If ETFs continue to experience net inflows during a downturn, then this cycle's "winter" will be much milder than the previous one.
English