Shay

21 posts

Shay banner
Shay

Shay

@TimingCharts

Trading Systems + Position Sizing + Money Management

Sumali Ocak 2023
581 Sinusundan221 Mga Tagasunod
Shay
Shay@TimingCharts·
@DumbleDax Done! Pull request: correct yfinance exchange code → display name mapping
English
0
0
1
32
Fred6724 🍥
Fred6724 🍥@DumbleDax·
@TimingCharts Great catch, thank you! Indeed some tickers get Yahoo Finance exchange codes (NYQ, NMS, ASE…) instead of the standard names, which breaks TradingView uploads. Please open a PR with your fix, happy to merge it. This will help everyone using the repo for watchlist imports 🙏
English
1
0
0
121
Fred6724 🍥
Fred6724 🍥@DumbleDax·
🧽The GitHub, RS Score project just got a major upgrade! 🧽 The output table now includes: Price, MarketCap, Float, Short Interest, 52Wk High/Low, and Avg Volume (10/30/50/60d) And will allow you to SCREEN by Rs Rating and filters the noise! 🐙 github.com/Fred6725/rs-log
Fred6724 🍥 tweet media
English
7
13
94
6.5K
Shay
Shay@TimingCharts·
$ASAN Breakout is over done on the Cycle Indicator - exiting long here.
Shay tweet media
English
0
0
1
147
Shay
Shay@TimingCharts·
$ASAN breaking out from a pullback that followed a recent 100% run
Shay tweet media
English
1
0
2
176
Shay
Shay@TimingCharts·
$TSLA Gap was filled - good place to take profits.
Shay tweet media
English
0
0
1
81
Shay
Shay@TimingCharts·
TSLA breaking out on 1H
Shay tweet media
English
2
0
1
56
Shay
Shay@TimingCharts·
$QQQ Looking for a strong Pivot Close on the Swing Cycle Indicator to confirm a new Pivot Low
Shay tweet media
English
0
0
0
29
Shay
Shay@TimingCharts·
@AnkurPatel59 Great post! What is the name of your volume indicator and how do you get it on the main chart? I have only been able to get the volume indicator written by the Tradingview team to plot on the main chart but it has little functionality.
English
0
0
0
2.4K
Ankur Patel
Ankur Patel@AnkurPatel59·
This is Dan Zanger. He set a world record with a 29,233% return in a single year. He turned $11,000 into $18 million in just 18 months. Here sharing few of his Trades .🧵
Ankur Patel tweet media
English
13
73
452
80.3K
Shay nag-retweet
Jeff Sun, CFTe
Jeff Sun, CFTe@jfsrev·
$KC - A Breakdown of My Trade on $KC's +180% Move in a Month (Scans, Watchlist Management, Entry Day Insights, and Systematic Risk Management for Holding) Rather than replying to individual DMs about my $KC position (ironically, my earlier post was about $FBTC), I decided it’s better to share this as part of the free educational content for everyone to benefit from. Here are a few key points about the share structure of $KC before the breakout, so you can adjust your screening parameters if needed. This is the type of stock profile that typically shows up in the 'Top 100 Performance% Stocks' annually. It's also why I tend to focus on small to mid-cap stocks most of the time. Share Structure Before Breakout at $3 i) Market Cap: $700M USD (Current: $2B USD) ii) ADR%: 5.7% (Current: 10.8%) iii) IPO Timer: 4.5 Years ago iv) Outstanding Share Float: 250M v) Avg (50) $ Vol: $35M USD/day vi) Avg (50) Share Volume: 4M/day 1. 1st move back above 200-MA after 1 year, +80% with RS during the 2 weeks. $KC will initially show up on your '1-Month Strongest Move' screener. I move the entire list (which includes $KC) to my watchlist, awaiting a higher low swing to confirm a character change. 2. Higher Low may be in place at this point with price contraction within a symmetrical triangle. I abolutely pay more attention to stocks when price contract along with ALL moving averages contracts together. (10, 20, 50, 100, 150, 200 DMA) $KC remains in watchlist, but will begin to keep appearing in my 'Screener within Watchlist' based on technical price compression. 3. Entry day on 5/11; here are some qualification i) it broke out of a 2 week technical triangle pattern and consolidated range ii) it broke out with high RVOL (RVOL was 40% in 10mins of open) iii) LoD was only 40% (i skip trade beyond 60%. I want high possibility of position ending the day with unrealized profit, not near entry price) Entry day is T. 3 stop set based on 33% stop level from entry to LoD. I do not consolidate and adjust my stops to breakeven (avg price) until T+3 days T+3 = 33% size down (immediate partial profit taking or shaving risk down on trade that did not follow through but still hovering above avg entry as I have tight stops (since I only do execution when price action presents entry to LoD below 60%). All stops are consolidated to breakeven level on 1 full singular size. Read more here on my detailed approach to risk management within a singular trade: x.com/jfsrevg/status… 4. Day 4 onwards is all mental stop on 10-MA. I do not mess with the trade if it doesn't close below 10-MA. 5. This trade did not close below 10-MA at all even at 13 x ATR% from 50-MA currently (highest ever). No reason to sell everything, but you have every reason to sell some pieces into strength at extension beyond 10 x ATR% beyond 50-MA. To be fair, nobody will know the outcome on the day their trade execution; but what I strongly advise is to adhere to the principle of law of large number and you need to have this few things right; i) make sure your screener gets u the setup before they MOVE, not after (i do not believe in high volume scan, you have already missed the most optimal entry day and the risk/reward is skewed after it. Try volume based high RVOL 'at time' scan instead during live market at minimum. High volume scan works best only as post continuation base setup, and the perfect entry spot often is a few weeks after that result appear) ii) have a entry rule that stack the odds of position ending the day with unrealized profit. LoD 60% rule, high RVOL etc are my 'secret' iii) ensure you have non-discretionary profit taking/stop loss rule. you cannot second guess the market, and u need to keep your emotion in check. you won't be able to hold a big runner if you like to second guess 'top' and 'bottom' in the market. the trades that can move needle in your annual performance % are trades that you never expect to do what they are doing. they make moves against basic human instinct. iv) you need to know when to go 'heavy' vs 'light' in terms of trade frequency and activity. $KC trade was taken right on the day market bounce off it's rising 50-MA, before subsequent market gap up to reclaim 10 & 20-MA. Market index chart eg. $SPY $RSP $QQQ are great to cushion you when to layer your risk or release the pedal. I will never take on risk when $SPY is 4 x ATR% from 50-MA when it historically pullback from 5 x ATR% from 50-MA. I am pretty certain $KC sort of move will never happen in any stock at this juncture of the market. You need to stack every single possible odds to let the trade work in your favor, and the current market extension now is a headwind more than a tailwind. v) repetition & refine; do this 100 times, go through your trade data and refine. do it another 100 times again, go through your trade data and refine. in a year, you will be able to refine up to 4 times at least. you only can get better if you refine your trading based on your trade journal. you can't escape this part of the work, please. I hope this is helpful, it's just some basic principle, math and plenty of repetition in trading for me. If you find this type of content valuable, do retweet ♾ so I know what sort of things to share in this space during my free time.
Jeff Sun, CFTe tweet media
Jeff Sun, CFTe@jfsrev

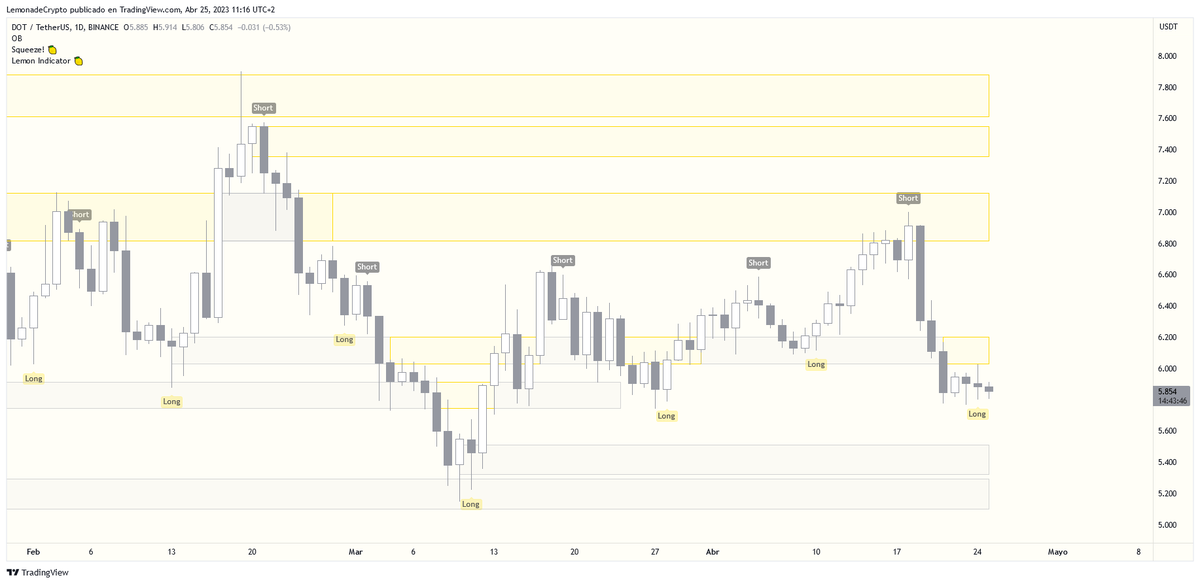
$BTCUSD $FBTC (Update) - The focus shouldn’t be on watching Bitcoin hit 100k from the sidelines but studying how to take the setup early to get paid for the outcome today.

English
37
98
394
127K
Shay
Shay@TimingCharts·
@jfsrevg It looks like you exclude one sector to get to 20 - what is it?
English
1
0
0
296
Jeff Sun, CFTe
Jeff Sun, CFTe@jfsrev·
If your primary screener yields more results than usual, I will take the opportunity to refine my screening parameters by adding filters that align with the traits of the top 100 annual % performing stocks. x.com/jfsrevg/status… Let me show you how I manage my result. If I based on my favorite weekly screener, there's 51 symbol (Screenshot #1). There's 2 things I will do here, i) I will select all the result and put into a 'Strongest Stock' Watchlist -> then i will implement my watchlist screeners (strictly technical basis) to sieve out more condense result within the watchlist. It nett me a result of only 13 out of 51 that are 'setup' ready in my context. ii) I will enhance the screener filter (Screenshot #2). I enhance via i) increasing ADR from 3% to 4% ii) add outstanding share float cut off within 150M. The traits and characteristics mentioned above are commonly observed in top 100 performing stocks annually, over the past 13 years. Another factor to consider is narrowing the market cap to below $25B. However, since my filter already includes a minimum 4% ADR, it’s rare to see results with stocks exceeding a $25B market cap. There’s a notable relationship between market cap and ADR%, especially for stocks in a hot theme. For example, during the $TSLA period when it was trading at an 8% ADR despite a market cap exceeding $300B, it surged an additional 200% in under 13 months. Here’s a personal insight: ADR%, Market Cap, Average $ Volume, and Performance % are interconnected. When combined and analyzed, especially when sorting results by industry group, they can reveal clear themes in play when a certain industry group dominates your screen result with those filters.
Jeff Sun, CFTe tweet mediaJeff Sun, CFTe tweet media
JQ@jqchews

@jfsrevg i always wonder if i am doing something wrong as my focus list is usually way bigger than the recommended 15-20. good to have your confirmation! yes i have a live rvol dashboard after u shared it, and it makes sense for rvol to be that final filter for the focus list. thanks!

English
5
23
124
23.1K
Jeff Sun, CFTe
Jeff Sun, CFTe@jfsrev·
Full List of 247 Companies with Over 100% EPS/Revenue Beat This Earnings Season Here is the complete, unfiltered list of 247 companies. The ticker symbols can be directly copied and added to a new watchlist in your charting platform. For those using @tradingview, you can refine your analysis with two straightforward approaches: i) Advanced Watchlist (as shown in the screenshot). ii) Screener Filtering: Apply custom filter parameters to screen the watchlist and tailor it to your study. The data remains raw and unfiltered to ensure it is unbiased at its source before you start refining it for your needs. If response is good, I may consider sharing the data every quarter, or even the past few quarters. TRUP, AMSC, UNFI, MBUU, FFWM, RDDT, ARDX, AEHR, RMNI, UDMY, LUV, CDXC, GROY, FTK, WRLD, PRAA, CVNA, VMEO, MRAM, CNK, WEAV, ISPO, RSI, TALK, LRN, DGICA, ROOT, ERII, ORN, LXFR, UBER, MGRC, RELL, COUR, BOWL, HHH, LNG, INSP, DAWN, MED, CSTL, NAVI, NTGR, ADVM, VICR, CENX, HIMS, SUPN, CRGY, EXE, EQT, BCOV, COMP, RIG, GTE, PTSI, GPRE, LSEA, CCCC, PAYO, XMTR, BVS, NEO, NERV, RCM, ACIU, LIND, ONIT, VERV, ANAB, CTKB, CPNG, MGNX, PAYS, LDI, MRCY, UFCS, BIP, ACRS, WW, KLTR, EYE, IRBT, MCFT, VCYT, AUPH, FSTR, FOA, FARO, SRPT, USIO, PRTH, AXGN, EBS, LILA, HRTG, CLNE, PETS, OB, APPN, AVAH, SRAD, GOCO, KD, FSLY, WBD, KRO, IHRT, BIGC, XPER, LSAK, NL, AMPY, VZIO, BLND, PLYA, MRNA, LSF, RLYB, ALGS, CLDX, GBIO, FG, GLUE, FWONA, RIGL, CRDF, BARK, WBTN, INOD, PSTX, UPLD, GHM, CYRX, GDEN, AMPL, FLYW, OPK, FLGT, MBI, NEPH, CBUS, GSAT, FNKO, ACVA, LIEN, GPRO, QDEL, MYGN, AXL, SEZL, IGMS, PRA, III, SKYT, INVE, DNTH, CTMX, HEAR, BRLT, DCTH, PRCH, LICY, VHI, ANGI, GRAB, AGO, IVAC, CGEN, ALT, TGI, AIOT, GENI, BKV, TH, MVST, DAVE, ORGO, AMPS, HNRG, HNST, VTSI, DSP, BTMD, SSYS, ETON, AENT, FLUT, YTRA, ELMD, HUT, SDRL, CWD, DYAI, VYGR, CLSD, BZFD, SYBX, OPRT, LIDR, BTTR, EGAN, LGVN, LIF, FATE, AIRG, MODG, SGMO, CART, MCRB, NVVE, GOVX, GENK, GRPN, MGTX, SPRY, CREX, CYBR, GILT, BWEN, ARMP, VXRT, OPRX, OWLT, RGCO, DTST, TSAT, TLN, STTK, BENF, LGCY, SRTS, NGS, LCTX, CUE, BEEM, MSGM, MRKR, OMGA, AISP, TIVC, IMTX, AMTM, ALLT, RIME, VREX, RERE, VNET, KLC
Jeff Sun, CFTe tweet media
Jeff Sun, CFTe@jfsrev

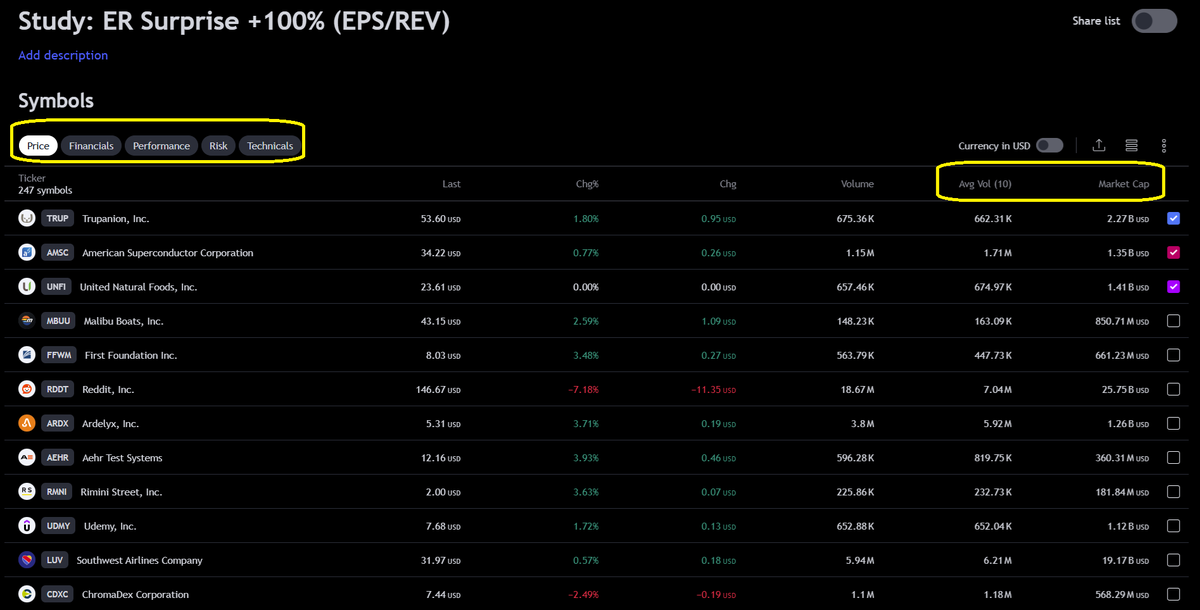
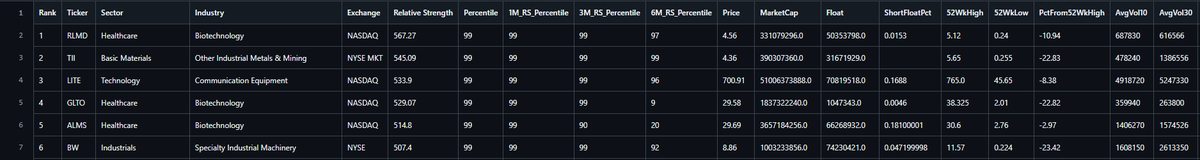
if anyone is interested, I can share the data for all the triple digit eps and sales beat of these earnings during the weekend for you to consolidate them to study

English
13
24
195
38.5K
Shay
Shay@TimingCharts·
@Freight_Bandit The large carriers would get all the loads and put all the small carriers out of business.
English
0
0
0
21
Freight Bandit
Freight Bandit@Freight_Bandit·
If Kamala could mandated $5 per mile for all truckload shipments, would that change your vote?
English
90
1
36
40.1K
Shay
Shay@TimingCharts·
@relentlessADD Are the calls based on the New York open?
English
1
0
2
1.1K
relentlessADD
relentlessADD@relentlessADD·
For anyone who hasn’t heard. We can call the intraday bias for all forex majors and major crosses over 76% of the time - using AI. Forward tested over 9,000 times. You either understand that implication or you’re behind. Indices next.
English
16
6
95
28.5K
Shay
Shay@TimingCharts·
@tcafrica1 @TRSTNGLRD After applying the Fib Time Zone to the chart, change the settings like this.
Shay tweet media
English
2
0
4
65
tcafrica
tcafrica@tcafrica1·
@TimingCharts @TRSTNGLRD did you get info on how to configure it to the Feigenbaum Constant (4.669)?if so please share ,thanks in advance
English
1
0
0
46
Shay
Shay@TimingCharts·
@TheCryptoLemon Your indicator has two errors. The Buy and Sell text is placed on historical bars rather than the current or next bar.Also, the indicator repaints. To correct, change the ruled to always look back at the previous bar. This will also fix the placement of your text signals.
English
0
0
0
65
Shay nag-retweet
Jesse Myers
Jesse Myers@Croesus_BTC·
Here are the 7 most important charts in global macro right now. Together, they hint at what's next as the banking crisis broadens into other segments of the financial landscape. #1 - the elephant in the room right now is Yield Curve Inversion. h/t @dylanleclair
Jesse Myers tweet media
English
40
349
1.3K
450.5K
Shay
Shay@TimingCharts·
@ShillMoBaggins I’m using Binance to buy ADA. Any suggestions on how to buy in a wallet or swap site that’s safe? Have read that some have bought in wallet and then could not withdraw it.
English
2
0
1
43
Alexander Legolas
Alexander Legolas@ShillMoBaggins·
Like It Or Not, #CARDANO Will be the Best Performing Layer 1 This Coming Bull Market, What Happened For #BSC & #SOLANA Last cycle When They Launched #DEFI On Their Chains For The First Time Is About To Happen To CARDANO & #ADA. They won’t like it but will respect it.
English
14
22
238
8.2K
Shay nag-retweet
Tyler
Tyler@TylerDurden·
Did you know Ethereum has been built on Bitcoin as a side chain? You can literally do everything the same but the underlying currency is BTC. It’s future value is closer to zero than you believe.
English
68
52
676
162.8K