@wizy_brain @DanW8l5b @Gravitygunner14 Havertz must have been fouled a dozen times but wasn’t given a single free kick.
English
Derconomy
7.3K posts


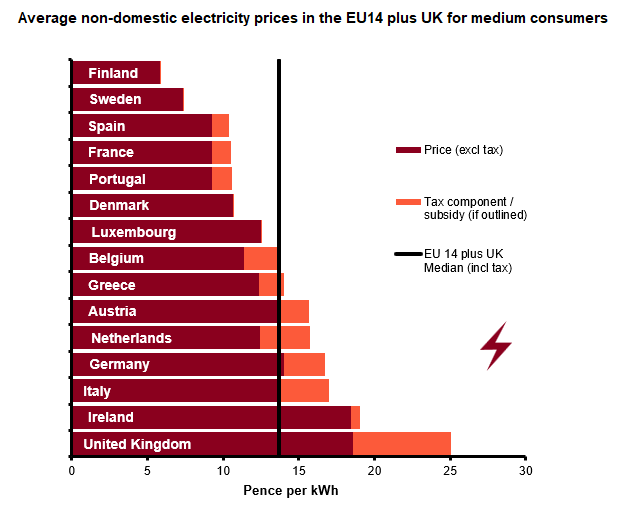
This chart is bonkers. I think there's two possible explanations for why the UK runs so far ahead of other European countries – neither of them good. And the annual April jump speaks to a wider issue. For more detail, see my column in this weekend's Observer (link below).


Anyone who thinks there is room for a new Chancellor to spend more liberally should take a long hard look at this graph. Britain's borrowing costs are soaring because spending is projected to far outpace revenue from 2030. A few implications: 1. The triple lock will have to go. An ageing population + inflation means we can't afford it. 2. Bond markets will not respond well to a new government (Labour or otherwise) that tries to suddenly boost spending, cut taxes or damage growth. 3. The only long run solution is growth. Even just 1% more per year would make a huge difference to this graph, raising revenue projections substantially, and reducing fiscal liabilities in a few key areas. Article from @tejparikh90 @FinancialTimes ft.com/content/640e61…