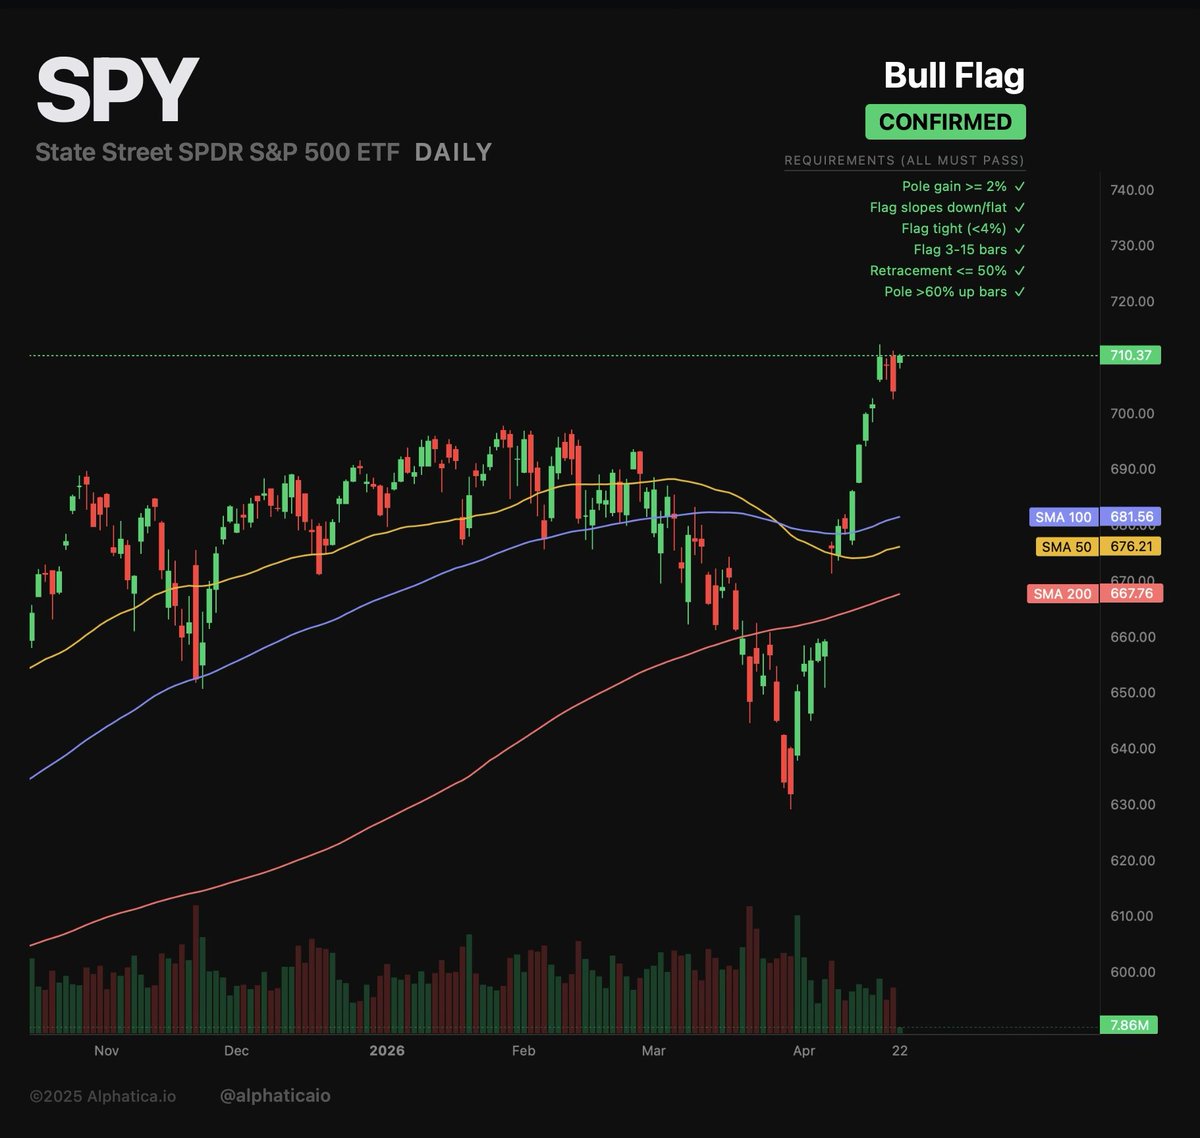
@Chartfest1 If you’re shorting semis, don’t get out now. Not sure we’ll see much selling until May starts, but a good round of profit taking and some rotation should be upon us soon.
English
Rick Snyder
13K posts

@cbusrick
What is it about your own miserable works & doings that you think you could please God more than the sacrifice of His own Son? ―Martin Luther


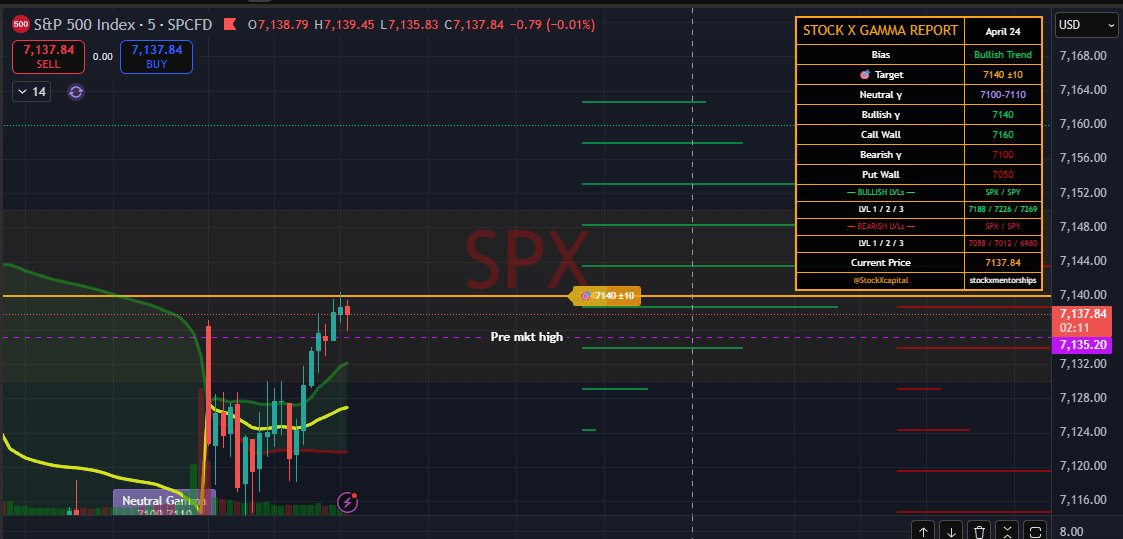
$SPX so far we are in no mans land... Neutral gamma is at 7110-7100 that is where delta is in equilibrium. Under 7100 bears have leverage, over 7140 bulls got control


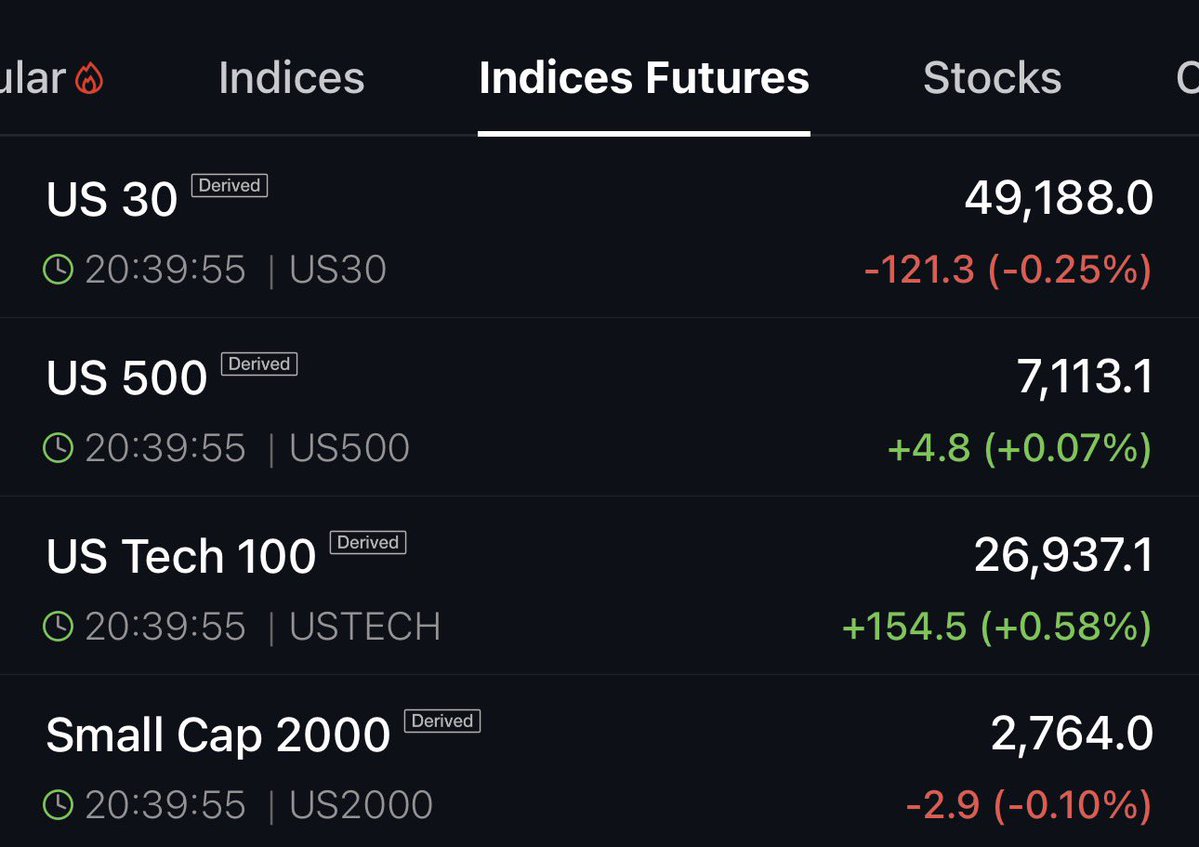
The $dow is currently leading the down trend .. when safe assets are weaker than speculative aka $ndx .. sign we can drop huge (not always the case but in this case) I believe soo…


I can’t believe it. This is absolutely insane. We are currently in uncharted territory.

WTI crossed $100 on March 27. The clock is ticking. $100 oil isn't the signal. $100 oil for 30+ days is. We analyzed every trading day WTI spent above $100 since 2003. 547 days. Then measured SPY forward returns at each duration threshold. The results are statistically significant at P < 0.0001 across 7 of 8 tests. What we found: SPY forward returns deteriorate monotonically the longer oil stays above $100. The market can absorb a spike. What it can't absorb is sustained pressure. The numbers: → ≥1 day above $100: SPY 10d return -0.28% → ≥30 days: -0.54% (win rate drops below 50%) → ≥50 days: -1.33% → ≥100 days: -1.40% (10d), -6.86% (20d) → ≥120 days: -3.81% (10d), -13.43% (20d), 0% win rate The baseline SPY 10d return is +0.38%. At ≥30 days above $100, that flips negative and never recovers. This isn't a round-number artifact. The same duration-dependent decay appears at $90 and $110. It's a fundamental relationship. Sustained high oil acts as a margin tax on the entire economy, and the market has a tolerance window of roughly 30 days before it starts to crack. The important caveat: the extreme results (≥100 days) are disproportionately 2008-weighted. The pattern held in 2011–2014 with smaller magnitude, and held again in 2022 where SPY fell ~11% across the full March–July regime when oil repeatedly crossed above $100. The direction is consistent. The effect size is regime-dependent. If this is a brief spike, history says equities shrug it off. If oil sustains above $100 for 30+ days, every analog except 2013 shows the market breaking. $SPY $QQQ $VIX $USO #WTI #OIL