Alphatica

6K posts

Alphatica banner
Alphatica

Alphatica

@alphaticaio

Former HFM | Trading & Investing | Rigorous Quantitative Research | Sophisticated Strategies | Institutional-grade for all Investors | Not Investment Advice

United States Beigetreten Temmuz 2023
57 Folgt11K Follower
Angehefteter Tweet
Alphatica
Alphatica@alphaticaio·
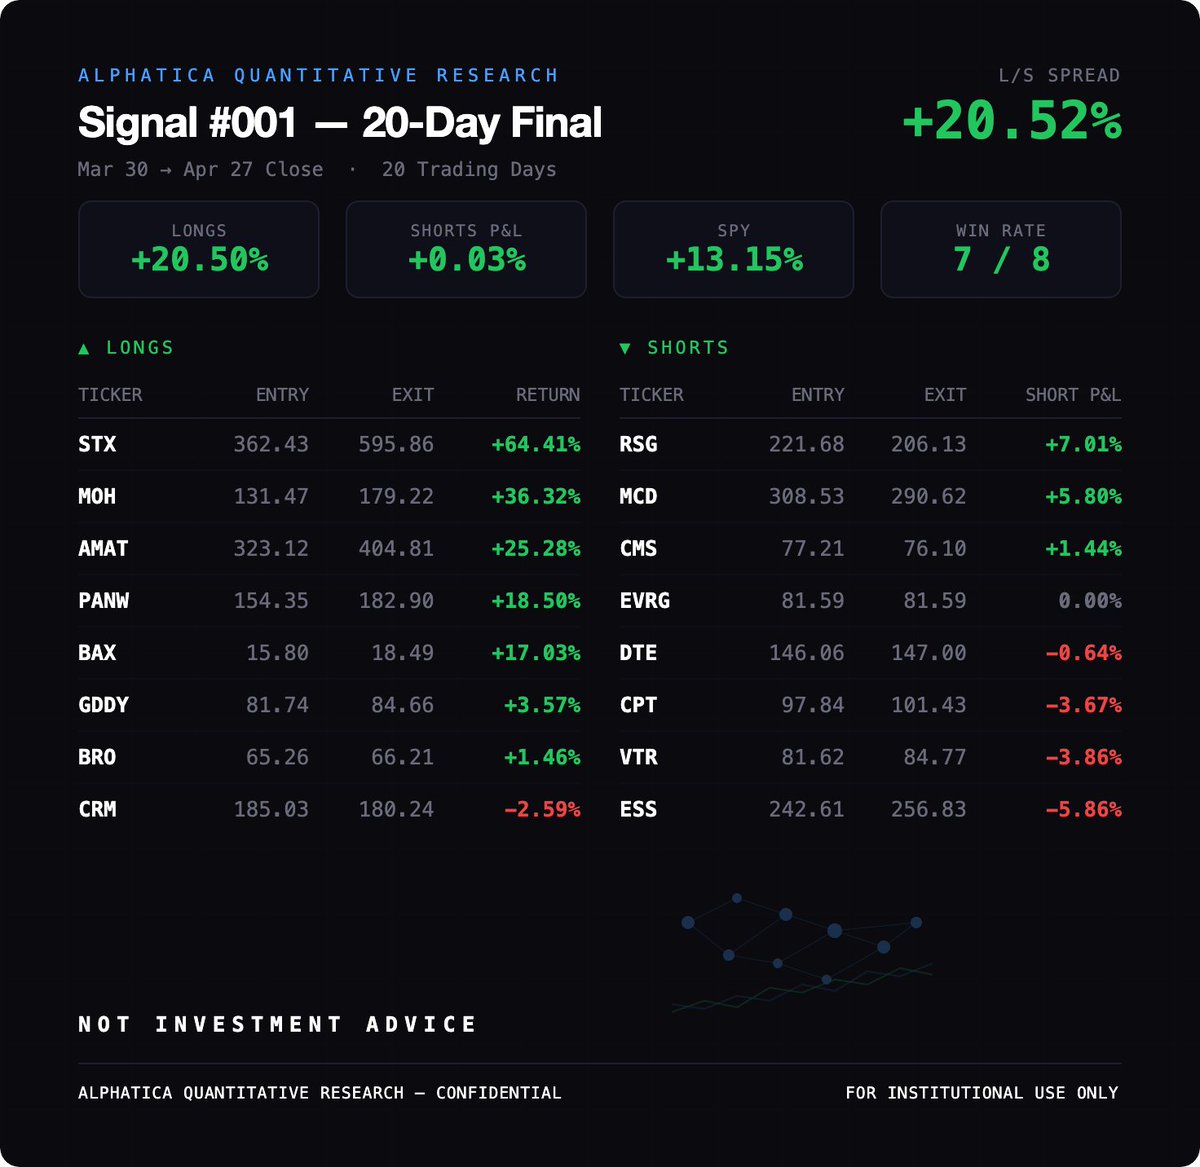
Signal #001: 20-Day Final Published March 30. Tracked publicly every single day for 20 trading days. Every pick timestamped. Every update posted, the good days and the bad. 20-Day Results: Longs +20.50% | Shorts +0.03% | L/S Spread: +20.52% SPY did +13.15% over the same period. Our long book beat it by 735bps. Our short book finished flat in a market that rallied 13%. That's the definition of a clean signal. $STX +64.4%, $MOH +36.3%, $AMAT +25.3%, $PANW +18.5%, $BAX +17.0%. 7 of 8 longs positive. $RSG +7.0% and $MCD +5.8% led the short book. This was our first public signal. We showed the work. Now it's closed. Signal #002 is live. Future signals go exclusively to email subscribers at entry. Sign up link in bio. Longs: $CRM $STX $PANW $GDDY $BRO $AMAT $MOH $BAX Shorts: $CMS $RSG $EVRG $ESS $CPT $MCD $DTE $VTR $SPY $SPX $QQQ
Alphatica tweet media
English
6
1
48
85.9K
Alphatica
Alphatica@alphaticaio·
WEEKLY DARK POOL RECAP | June 8-12, 2026 "You can't classify direction in dark pools." We heard it (many times). Here are the receipts. Our direction classification algorithm produced 9 individual name signals this week across 1,809 off-exchange prints ≥$5M. We measured every signal against the actual return for the week ending June 12. Signal accuracy: 7 out of 9 correct direction (78%). Sell signal accuracy: 3 out of 3 (100%). Buy signal accuracy: 4 out of 6 (67%). ALPHATICA BUY SIGNALS vs ACTUAL RETURNS $INTC Signal: BUY Net: +$518M Return: +25.6% ✓ $MU Signal: BUY Net: +$230M Return: +13.6% ✓ $TSLA Signal: BUY Net: +$213M Return: +3.9% ✓ $NVDA Signal: BUY Net: +$712M Return: +0.04% ✓ $GLD Signal: BUY Net: +$634M Return: -2.4% ✗ $AAPL Signal: BUY Net: +$525M Return: -5.3% ✗ $INTC: our algorithm classified +$518M in cumulative dark pool flow as institutional buying. The stock returned +25.6%. By Friday, $INTC had +$743M in dark pool buys with zero sells and +$1.97B on the lit tape with $8M in sells. Both venues. Zero opposition. The algorithm identified the accumulation. The return confirmed it. $AAPL: our algorithm classified +$525M as institutional buying. The stock declined -5.3%. The signal missed. We show it. The reason for the selloff WWDC. We expect $AAPL to move higher from here. $GLD: +$634M classified as buying. A new position being built across two sessions. Gold declined -2.4%. Whether the dark pool was early or wrong is a question for this upcoming week. ALPHATICA SELL SIGNALS vs ACTUAL RETURNS $META Signal: SELL Net: -$700M Return: -4.4% ✓ $GOOGL Signal: SELL Net: -$424M Return: -2.4% ✓ $NFLX Signal: SELL Net: -$250M Return: -2.2% ✓ 3 out of 3. Every name our algorithm classified as institutional selling declined. $META: -$700M across three appearances, all classified as sell. Down -4.4%. $GOOGL: -$424M, mostly sell. Down -2.4%. $NFLX: -$250M in a single session with zero dark pool buys. Down -2.2%. The sell signals were perfect. When the algorithm flags persistent selling with zero or near-zero buyer interest, the name declined every time this week. INDEX SIGNALS: STRUCTURAL HEDGING $SPY Signal: HEDGE Net: -$2.76B Return: +0.57% $QQQ Signal: HEDGE Net: -$1.47B Return: +2.31% $IWM Signal: HEDGE Net: -$2.36B Return: +4.01% The algorithm detected institutional hedging at the index level. The dark pool sold all three indexes for the week while all three rose. This is not a miss. This is risk management. The institutions bought individual names ($INTC +25.6%, $MU +13.6%) and hedged broad market exposure off-exchange. The index selling funds the individual name buying. Different function. Different interpretation. WEEKLY SCORECARD Signal accuracy: 7/9 (78%) Sell signals: 3/3 (100%) Buy signals: 4/6 (67%) Biggest hit: $INTC +25.6% on buy signal Biggest miss: $AAPL -5.3% on buy signal We publish every signal in real time. We validate every signal against the actual return. We show the $INTC hit and the $AAPL miss. We show the $META sell that worked and the $GLD buy that didn't. "You can't classify direction in dark pools." 78% says otherwise. 100% on sells says otherwise. The receipts are on the timeline. Every day. Every week. The algorithm works. The tape doesn't have an opinion. It has a receipt.
Alphatica tweet media
English
5
0
17
2.3K
Citizen
Citizen@team_juicebox·
@alphaticaio sometimes i pray for a gnarly solar flare to fry these things so were all forced back to the 80s
English
2
0
1
30
Alphatica
Alphatica@alphaticaio·
An NBER working paper just found that the iPhone explains 33-52% of the decline in the US fertility rate since 2007. Not the economy. Not housing costs. Not student loans. The phone in your hand. The most impactful product in Apple's history and it is not even close. $AAPL $SPY $QQQ
Alphatica tweet media
English
3
1
10
1.7K
Alphatica
Alphatica@alphaticaio·
Micron reports June 24. Here is everything the data is telling you. The stock: $981.61. Up 244% year to date. Up 745% over the last 52 weeks. From $103.38 at the August 2025 low to a $1,089 high three weeks ago. Currently 9.9% off that high. We covered the JPMorgan TMT Conference on May 20. CEO Sanjay Mehrotra told the room the financial outlook has "strengthened since our last earnings call." Record free cash flow expected in fiscal Q3. Supply-demand imbalance in HBM, DRAM, and NAND persisting "well beyond calendar year 2026." He was asked to quantify the improvement. He declined. Said the quarter closes in a couple weeks and they would have comments on the next call. That is management telling you the beat is coming without saying the number. Here is what the consensus revision data shows: On March 2, the Street consensus for Q3 EPS was $10.02 across 30 analysts. On March 19, Micron reported Q2 earnings. Consensus reset to $18.49 overnight. A 54% upward revision in a single day. By March 28, analyst standard deviation collapsed from 2.72 to 0.44. Every analyst on the Street converged to the same number within days of the print. That level of consensus compression is rare. It means the earnings report left no room for interpretation. Since then, consensus has ground higher every week: March 19: $18.49 April 1: $19.21 May 1: $19.31 June 1: $19.55 June 11: $19.96 (32 analysts) The estimate has risen every single month since the Q2 beat. 32 analysts now cover the quarter, up from 30 in March. Standard deviation is expanding back to 1.25, which means the bulls are pulling estimates higher and widening the distribution. Someone on the Street has this well above $20. The full forward curve from our estimates data: Q3 2026 (reporting Jun 24): EPS $19.96, Revenue $34.7B Q4 2026: EPS $24.04, Revenue $41.4B Q1 2027: EPS $26.70, Revenue $45.7B Q2 2027: EPS $27.96, Revenue $47.9B Q3 2027: EPS $29.21, Revenue $50.2B Q4 2027: EPS $30.09, Revenue $52.0B The Street expects Micron to generate $30 EPS per quarter by late 2027 on $52 billion in quarterly revenue. Free cash flow of $22.8 billion per quarter. Net cash position projected to reach $91 billion. The analyst activity over the last 90 days: 6 upgrades. 0 downgrades. Zero. March 3: Haitong upgrades to outperform March 6: BofA upgrades to buy March 6: KGI upgrades to outperform March 6: Benchmark upgrades to buy April 9: Barclays upgrades to overweight May 26: HSBC upgrades to buy, target $1,625 That HSBC target of $1,625 is $525 above the highest target on the Street before that call. UBS raised to $1,625 on the same day citing smoother earnings profile and improved visibility from enhanced long-term agreements across the memory industry. The conference data from JPMorgan fills in the operational picture: HBM4 production ramping at double last year's rate. HBM4E launching in 2027. Bit output crossover to 1-gamma DRAM and Gen 9 NAND on track for mid-2026. New fabs in Taiwan, Idaho, New York, and Singapore ramping 2027-2028. Strategic customer agreements progressing. Enterprise SSD market share gains continuing with leadership in PCIe Gen 6. Industry-wide supply constraints are driven by slower technology transition productivity and rising memory intensity. Exponential growth in inferencing workloads is fueling sustained demand that the industry cannot meet. Last quarter Micron reported $12.20 EPS when consensus was around $10. A 22% beat. If the same magnitude of outperformance repeats, $19.96 becomes $24+. That would be the second consecutive massive upside surprise. MU at $981. Reports June 24. 6 upgrades, 0 downgrades. Consensus has risen every month since March. Management said the outlook strengthened. The conference data confirmed the supply constraints. The estimates data shows the Street is still catching up. The data is not ambiguous. $MU $QQQ $DRAM
English
3
0
33
3K
Alphatica
Alphatica@alphaticaio·
The data already supports this thesis. The White House executive order we covered last week gives the NSA authority to define "covered frontier models" and requires developers to submit them for government review up to 30 days before release to partners. The gatekeeper framework is not theoretical. It is signed. Google raised $84.75 billion in equity the same week. Gemini has 900 million MAU. They made Gemini the default model inside Workday and IBM's consulting stack. The distribution layer is being locked in while the regulatory layer is being built around it. The capital markets confirm the positioning. Alphabet, SpaceX, and SMCI raised a combined $167 billion in equity in June. The frontier labs are raising too, but into a regulatory environment that now favors the clouds. The KYC point is the sharpest observation here. The labs optimized for growth metrics that supported valuations. KYC would have lowered usage numbers, lowered revenue run rates, lowered the multiples that justified the next funding round. They traded long-term leverage for short-term valuation. That trade is now repricing. Open source is the wildcard but the data says adoption is not scaling fast enough to fill the gap. The enterprise is choosing managed platforms, not self-hosted models. Every conference transcript we have tracked this quarter confirms it. $SPY $QQQ $GOOGL
English
1
1
5
947
Chamath Palihapitiya
Game theory from here is super interesting: Original Mags (Google, Amazon, Microsoft, Meta) now have a serious non-zero opportunity to tank the frontier labs. Go to the government, kneecap the labs’ motion of putting the latest models out in the wild, become the trusted gatekeeper between the labs and the public at large (including internationally) by having the labs go through their clouds (AWS, GCP, Azure) and implement strict KYC to seal the deal. The frontier labs should have seen this coming years ago and implemented a robust KYC for just this moment. The fact they didn’t is kind of concerning. Why did they not do it? Best guess is because it would have changed the run-rate revenues (downward) which would have then changed funding dynamics - lower valuations, more dilution, less secondary. A valuation reset may happen now anyways, except the labs may end up with less control and more restrictions at the end of it. At the same time, everyone is already clamoring about token prices of the old models from the labs anyways… This couldn’t be a better setup for open source and neoclouds. Big question is can they meet the moment? There are too few of them and their progress seems sporadic at best.
English
224
193
2.6K
622.4K
Alphatica
Alphatica@alphaticaio·
@gurgavin Now do the misses. Google Ventures has deployed over $8B since 2009. For every Uber there are hundreds of write-downs that never make the highlight reel. The three names listed are generational bets. The portfolio return including the losses would tell the real story. $GOOGL
English
3
0
12
1.6K
GURGAVIN
GURGAVIN@gurgavin·
MOST PEOPLE HAVE NO IDEA HOW GOOD OF AN INVESTOR GOOGLE IS 6% OF SPACEX 14% OF ANTHROPIC 75% OF WAYMO $900M INTO SPACEX IN 2015 → NOW WORTH $115B $13B INTO ANTHROPIC → NOW WORTH $140B WAYMO JUST RAISED $16B AT A $126B VALUATION → GOOGLE’S STAKE WORTH ~$95B. THOSE THREE BETS ALONE ARE WORTH OVER $350B AND THEY HAVE 100’S MORE SMALLER ONES $GOOGL
Kalshi@Kalshi

JUST IN: Google’s $900 million investment in SpaceX has reportedly grown to $100 billion

English
132
232
3.9K
475.9K
Alphatica
Alphatica@alphaticaio·
Week 4 of the Fed H.8 data. The banking system just contracted. Total loans declined $10.5 billion. The first outright decline in our 4-week series. Total deposits fell $42.4 billion. Borrowings dropped $22.0 billion. Everything went negative at the same time. The 4-week arc tells a complete story: Week 1: loans +$21.5B, deposits +$63.1B. Growth. Week 2: loans +$33.6B, deposits +$6.7B. Acceleration in lending, deposits stall. Week 3: loans +$1.0B, deposits +$47.7B. Lending freezes. Week 4: loans -$10.5B, deposits -$42.4B. Contraction. Four weeks. A full cycle from expansion to contraction. The number that matters most: large-time deposits fell $37.7 billion. That is institutional money leaving the banking system. Core deposits only declined $2.6 billion. Retail depositors are staying. Institutions are not. "Other loans" collapsed $13.2 billion. That is margin lending, securities-based lending. The leverage that was expanding in weeks 1 and 2 at $14-17 billion per week is now unwinding. Consumer loans slipped $1.5 billion. The consumer borrowing pullback that showed up in the Beige Book data is now showing up in the bank balance sheets. The only positives: commercial lending +$2.1 billion and residential real estate +$2.3 billion. Traditional business and mortgage lending is still expanding. But it was not enough to offset the $13.2 billion collapse in leverage products and the $37.7 billion institutional deposit exit. The tightening is not coming from the Fed. It is coming from inside the banking system. Banks are pulling back credit before the Fed forces them to. The data told you this was coming. Now it is here. #FOMC $SPY $QQQ
Alphatica tweet media
English
3
3
28
2.9K
Alphatica
Alphatica@alphaticaio·
One man is now worth the entire economic output of Switzerland. Switzerland has 8.8 million people, 580,000 businesses, and 200 years of banking infrastructure. Elon has rockets, electric cars, a social media platform, and a brain chip company. The fact that these two numbers are the same tells you everything about where we are in the cycle. Craziness.
English
1
0
3
117
Alphatica
Alphatica@alphaticaio·
SpaceX just listed at 102x price-to-sales. For context, the most expensive stock in the S&P 500 is Palantir at roughly 65x sales. SpaceX is trading at nearly double the most expensive name in the entire index. This is either the most visionary bet in market history or the most expensive receipt ever printed. Either way Elon Musk is now worth $1 trillion. That is 3% of US GDP. One man. Three cents of every dollar. $SPY $QQQ $SPCX
Alphatica tweet media
English
6
1
21
2.1K
Alphatica
Alphatica@alphaticaio·
This gives us pause in raising year end solana:J3NKxxXZcnNiMjKw9hYb2K4LUxgwB6t1FtPtQVsv3KFr targets. We knew 7462 was coming. We predicted it in September and reinforced our prediction in March when the market was tanking. We knew the math. The market has not traded in a regime like this in over 18 months. $SPY $QQQ
English
1
0
2
224
MoonCakeyUSA
MoonCakeyUSA@MoonCakeySTEPN·
@alphaticaio Sounds like a headwind for market direction - can you confirm? Or are we still watching what happens next week during FOMC and OPEX to get a clearer picture. I have been following the bearish and bullish patterns you wrote earlier. Continuing to monitor - thank you
English
1
0
2
233
Man_In_The_Arena
Man_In_The_Arena@The_WholeArmour·
@alphaticaio This was a big part of my thesis on the irrational rally. Looking for more downside ending in a bloodbath for retail. Plan on buying the capitulation.
English
1
0
4
189
Alphatica
Alphatica@alphaticaio·
Net Equity Supply Just Flipped Positive for the First Time in 18 Months. We estimate a ~$114 Billion Per Quarter Was Holding This Market Up For most of 2025, corporations bought back more stock than they issued. Not by a little. By a factor of two. We estimate roughly ~$114 billion per quarter in actual share retirements across approximately 504 companies. That is not authorizations. That is shares permanently removed from the market, verified. Against that, new equity issuance averaged $55-70 billion per quarter. The math was simple: more shares leaving than entering. Every quarter. For five consecutive quarters. That is the structural bid no one talks about. It does not depend on sentiment or flows. It shows up every quarter and shrinks the float. It is the reason the market kept going up even when every macro indicator said it should not. The quarterly net equity supply since Q1 2025: Q1 2025: -$61.9 billion (buyback dominant) Q2 2025: -$46.4 billion Q3 2025: -$60.3 billion Q4 2025: -$47.9 billion Q1 2026: -$43.6 billion Five consecutive quarters of net share reduction. The buyback machine absorbed everything the capital markets created and removed tens of billions more on top. Then Q2 2026 happened. Gross equity supply surged to $264.6 billion in a single quarter. Three deals drove it: Alphabet $84.75 billion, SpaceX $75 billion, Super Micro $7 billion. All three raised equity to fund AI infrastructure. For the first time in 18 months, supply overwhelmed the buyback bid. Net equity supply flipped to +$150 billion. The structural buyer that powered the rally was outmatched. The question is whether Q2 2026 was an event or a regime change. If it was an event, the buyback machine reasserts itself in Q3 and the structural bid returns. The three mega-deals were generational, not repeatable. If it was a regime change, the AI infrastructure buildout creates a sustained wave of equity issuance that permanently shifts the supply-demand balance. If every AI company follows the Alphabet playbook of raising equity at scale to fund capex, the buyback bid is no longer the dominant force. At 65.7% equity allocation and 44% rate hike probability, the pool of available buyers is already stretched. The market does not need to crash for this to matter. It needs new buyers to replace the structural bid that just disappeared. The easy part of this rally ended the day the supply wave started. $SPY $QQQ $SPCX
Alphatica tweet media
English
6
7
45
4.1K
Alphatica
Alphatica@alphaticaio·
@AnthropicAI The model is not that good. Seems like a marketing ploy. $SPY $QQQ $NVDA
English
1
1
20
2.5K
Anthropic
Anthropic@AnthropicAI·
The US government, citing national security authorities, has issued an export control directive to suspend all access to Fable 5 and Mythos 5 by any foreign national, whether inside or outside the United States, including foreign national Anthropic employees. The net effect of this order is that we must abruptly disable Fable 5 and Mythos 5 for all our customers to ensure compliance. Access to all other Claude models is not affected. We apologize for this disruption to our customers. We believe this is a misunderstanding and are working to restore access as soon as possible. Read our full statement: anthropic.com/news/fable-myt…
English
12.1K
25.3K
85.6K
83.8M
Alphatica
Alphatica@alphaticaio·
🚨🚨ALERT | SPY WEEKLY OPEX | Friday Jun 12 $741.72 close. The delta regime flipped back. Last Friday: -56.31M net delta. First negative reading in the series. Dealers long shares, mechanical selling on every dip. This Friday: +48.61M. A 105 million share swing in one week. The mechanical bid is back for now. What changed: put-to-call ratio on expiring contracts went from 4.17x two weeks ago to 0.95x tonight. Nearly balanced. The hedging panic that drove the selloff is unwinding. Calls and puts are normalizing for the first time in seven weeks. Tonight's rolloff: 25.4% of gamma, 1.84M gamma shares, 8.70M delta. Week seven above the significant threshold. The consistency of these rolloffs is the series now. Every Friday, 20-40% of the gamma blanket disappears. Every Monday, the cushion is thinner. But next week is different. FOMC meets Tuesday and Wednesday. Rate decision and Warsh's press conference land Wednesday afternoon. June quarterly OPEX hits Thursday (moved up from Friday for Juneteenth). That's the largest volatility catalyst of the month followed immediately by the largest gamma expiration of the cycle. 4.13 million contracts. 25.8% of remaining gamma. 1.87M gamma shares. All expiring the morning after the Fed speaks. The gamma blanket will be at its thinnest precisely when the market is pricing in the Fed's decision. After Thursday, 63.7% of today's gamma blanket is gone. The delta recovery says the selloff stress has subsided for now. The June 18 cliff says the structural vulnerability isn't. Positive delta means dealers buy dips again. Thinner gamma means those dips are bigger than they were six weeks ago. The mechanical bid returned just in time for the most structurally loaded week of the current cycle. FOMC into quarterly OPEX. The catalyst and the cliff, back to back. $SPY solana:J3NKxxXZcnNiMjKw9hYb2K4LUxgwB6t1FtPtQVsv3KFr $QQQ
Alphatica tweet media
English
6
6
62
4.6K
Alphatica
Alphatica@alphaticaio·
DARK POOL ALERT: $300M in block-sized dark pool prints on INTC after hours. Two trades within the same second. | 17:36:19 INTC BUY $259,977,590 NASDAQ Carte │ │ 17:36:19 INTC BUY $ 40,011,884 NASDAQ Carte | $INTC $SMH $QQQ
Alphatica tweet media
English
3
4
35
4.3K
Alphatica
Alphatica@alphaticaio·
Signal #004: 20-Day Final Published May 13. Closed June 10. SPY fell -2.27%. Our basket returned +1.81%. Alpha: +4.09%. 7 of 8 longs finished green. $URI +12.95%, $ACN +6.80%, $EL +3.97%, $CRM +3.06%. The long book returned +3.44% while SPY lost -2.27%. That's +5.71% of long-side alpha. The short book was the drag this time at -1.63%. $MLM was the only profitable short at +4.15%. Insurance ($CB -4.61%, $TRV -2.83%) and REITs ($SPG -6.11%) rallied against us. The model's persistent utility/insurance short thesis worked across Signals #001-003 but ran into a defensive rotation in #004. We post the good and the bad. That's four closed signals: Signal #001: +20.52% L/S Signal #002: +5.96% L/S Signal #003: +0.19% L/S Signal #004: +1.81% L/S (+4.09% alpha vs SPY) If you did absolutely nothing else and put equal dollar amount into each position based on the side you had: Four positive signals. Four positive L/S spreads. Signal #005 is live for email subscribers. The email sign up link is in the bio. Longs: $DASH $EL $EXPE $OXY $URI $VST $ACN $CRM Shorts: $MLM $TRV $EA $AEP $WEC $ITW $SPG $CB Signal #006 will be delivered on Thursday. $SPY $SPX $QQQ
Alphatica tweet media
English
25
6
25
2.3K
Alphatica
Alphatica@alphaticaio·
@Techmeme @EdLudlow The reason for the lease is a question mark. Whether you see this as smart capital allocation or an AI execution flag depends on which part of the $1.77T thesis you're underwriting. $SPCX
English
0
0
3
1K
Techmeme
Techmeme@Techmeme·
Sources: SpaceX decided to rent its Colossus 1 data center to Anthropic after internal teams struggled to use it for Grok development due to latency issues (@edludlow / Bloomberg) (Visit Techmeme dot com for the link and full context!)
English
6
11
72
45K
Alphatica
Alphatica@alphaticaio·
DARK POOL SCANNER | June 12, 2026 Both tapes buy $MSFT. Both tapes buy $INTC. Both tapes buy $SPY. The dark pool agrees with the lit tape. For the first time in weeks. 518 off-exchange prints ≥$5M. Dark pool: +$742M net buy. The dark pool is positive. Not flat. Not hedging. Positive. Dark Pool Buyers: $INTC +$743M (10 prints, ZERO dark pool sells, BOTH TAPES AGREE) $SPY +$558M (62 prints, BOTH TAPES AGREE) $QQQ +$219M (81 prints, BOTH TAPES AGREE) $MSFT +$177M (18 prints, BOTH TAPES AGREE, FIRST TIME) Dark Pool Sellers: $DIA -$891M (36 prints, $30M buys vs $921M sells) $IWM -$687M (46 prints, BOTH TAPES AGREE SELL) $META -$95M (17 prints) $AMZN -$57M (26 prints) Both tapes agree. The structural hedge paused. For five of the last seven sessions, the dark pool sold indexes while the lit tape bought. The pattern held through panic, bounce, CPI, and peace. Today it paused. $SPY: +$2.82B lit, +$558M dark. Both buy. $QQQ: +$3.12B lit, +$219M dark. Both buy. The index divergence resolved. $MSFT: +$177M dark pool. +$782M lit tape. Both tapes agree on $MSFT buy. The first time since the distribution began. The dark pool sold $MSFT with zero or near-zero buys for weeks. Today: +$177M buy. On both venues. The distribution ended simultaneously on both tapes. $INTC: +$743M dark pool with zero sells. +$1.97B lit tape with $8M sells. Both tapes. Zero opposition on the dark pool. Near-zero on the lit tape. The most complete cross-venue Intel accumulation signal of the series. $DIA: -$891M. The Dow ETF sold in the dark pool with $30M in buys. Near-zero. The dark pool is buying $SPY and $QQQ but selling $DIA and $IWM. Rotating between indexes. Not hedging all of them. That's a new pattern. The dark pool is differentiating: buy the S&P and Nasdaq, sell the Dow and Russell. Tech-weighted indexes in. Old economy and small cap indexes out. $META: -$95M. $AMZN: -$57M. The ad platforms continue to sell on the dark pool. Week fourteen ends. The dark pool agreed with the lit tape. The distribution paused. $MSFT bought on both venues for the first time. $INTC zero sells on both venues. The structural hedge that held for five sessions resolved on the broadest day of the month. FOMC next Wednesday. First Warsh decision. Both tapes are aligned heading into the most important rate decision of the year. Now you're watching both.
Alphatica tweet media
English
3
3
24
3.3K
Alphatica
Alphatica@alphaticaio·
@GNG_Pro Not yet. But doing away with forward guidance is a big deal.
English
1
0
1
142
Bmac
Bmac@GNG_Pro·
@alphaticaio Do you think it's impossible that they raise rates?
English
1
0
0
151
Alphatica
Alphatica@alphaticaio·
FOMC PREVIEW | June 16-17 This is not a normal Fed meeting. Here's what nobody is talking about. The rate decision is priced. The market expects a hold at 3.50-3.75%. That's not the story. The story is what Warsh does to the dot plot. WHAT IS THE DOT PLOT: In 2012, Ben Bernanke introduced the dot plot. Nineteen FOMC members project their expected rate path for the next few years. Each dot represents one official's forecast. The market has used this as its rate roadmap for 14 years. Every mortgage rate, every bond trade, every equity valuation model that includes a discount rate has been anchored by those dots since 2012. When the dots shift, trillions of dollars reprice. When the dots showed six cuts in late 2024, the market rallied. When the dots showed fewer cuts in 2025, yields spiked. The dots are the single most watched communication tool in global finance. WHAT WARSH IS PLANNING: He wants to kill it. At his confirmation hearing Warsh said: "I don't believe in forward guidance. I don't believe that I should be previewing for you what a future decision might be." Reports indicate he is planning to eliminate or fundamentally reform the dot plot as early as this meeting. His argument: the dots lock policymakers into stale forecasts, force the Fed to honor projections the data no longer supports, and cause markets to treat flexible estimates as firm commitments. WHY THIS MATTERS MORE THAN THE RATE DECISION: A hold at 3.50-3.75% changes nothing. The market already priced it. Eliminating the dot plot changes everything. For 14 years the market has had a rate roadmap. Remove it and every forward rate projection becomes a guess. The anchor that stabilized bond markets, equity valuations, and mortgage pricing disappears. No dot plot means: No consensus rate path for 2026 or 2027. No way to gauge how many FOMC members favor hikes vs holds. No quarterly update on where the committee thinks rates are headed. The market loses the single tool it has used to price rate expectations since 2012. Morgan Stanley is calling this the biggest underpriced risk for global currency markets. We agree. And we think it extends far beyond currencies. THE GAMMA IMPLICATION: June 18 monthly OpEx sits the day after the FOMC decision. 4.13M contracts. 2.92M puts. 26.7% of remaining gamma on a single expiration. The largest OpEx concentration we've tracked. If Warsh eliminates forward guidance on Wednesday afternoon, IV reprices overnight. The options chain reprices Thursday morning. And 4.13M contracts expire that same day. FOMC volatility plus OpEx gamma drain on back-to-back days. The same setup we mapped for the May 15 gamma cliff, except the catalyst is the most significant change to Fed communication since 2012. SPY's GEX is -$179M heading in. The blanket is thin. The structure just stabilized after the worst selloff of the cycle. The dealer engine is at 53% capacity. This is the environment that absorbs the announcement. THE SCENARIOS: Warsh holds rates, keeps the dot plot, signals neutral: The market exhales. IV compresses. The recovery continues toward $750. The H&S right shoulder fails. The ascending triangle resolves upward. Warsh holds rates, eliminates the dot plot: The market reprices uncertainty. IV spikes. The removal of forward guidance forces every rate model to recalibrate. Bond yields swing. Equity multiples adjust. The June 18 OpEx amplifies whatever direction the repricing takes. Wider ranges than any session this cycle. Warsh holds rates, eliminates the dot plot, signals hawkish bias: The worst-case scenario for equities. No rate roadmap plus hawkish lean plus OpEx gamma drain. The H&S completes. The neckline at $731 breaks. The $702 target is in play. OUR APPROACH: We don't predict what Warsh will do. We map the structure heading into the event and publish the levels that matter for each outcome. We will publish every level before the decision. Every shift documented in real-time. Same approach as the May 15 gamma cliff. Same approach as the Iran shock. The data leads. We follow. The market has operated with a rate roadmap since 2012. Next week we find out if the road signs come down. Trade the structure, not the prediction. $SPY $TLT $QQQ #FOMC
Alphatica tweet media
English
7
10
68
4.4K