protechtor

8.6K posts

protechtor banner
protechtor

protechtor

@protechtor

Crypto trader/investor since 2014, $BTC, $ETH, $XRP, $CRV technical analysis. No investment advice. Educate and help navigate. Occasionally found in 🐰 holes.

California, USA Se unió Ocak 2010
1.2K Siguiendo2.3K Seguidores
Tweet fijado
protechtor
protechtor@protechtor·
$XRPUSD Long Term Update with Elliott Wave counts. Grab a beverage and a snack... I am gonna preach a bit. It's been awhile since I have posted a long term view. For those who have followed along, you know that I happen to be one of the only (perhaps THE only) TA still around who has analyzed and traded $XRP in real time since 2014. I know every squiggle on the chart.. and more importantly, I was there. Read the sentiment in the market at every long and short term top and bottom. And... with real money on the line near the entire way through. I am a but of a fanatic in this way, but it has afforded me a highly tuned in intuition about patterns. Now that we have crossed the ATH, and are printing new highs, the short term counts are clearing up the longer term counts. 
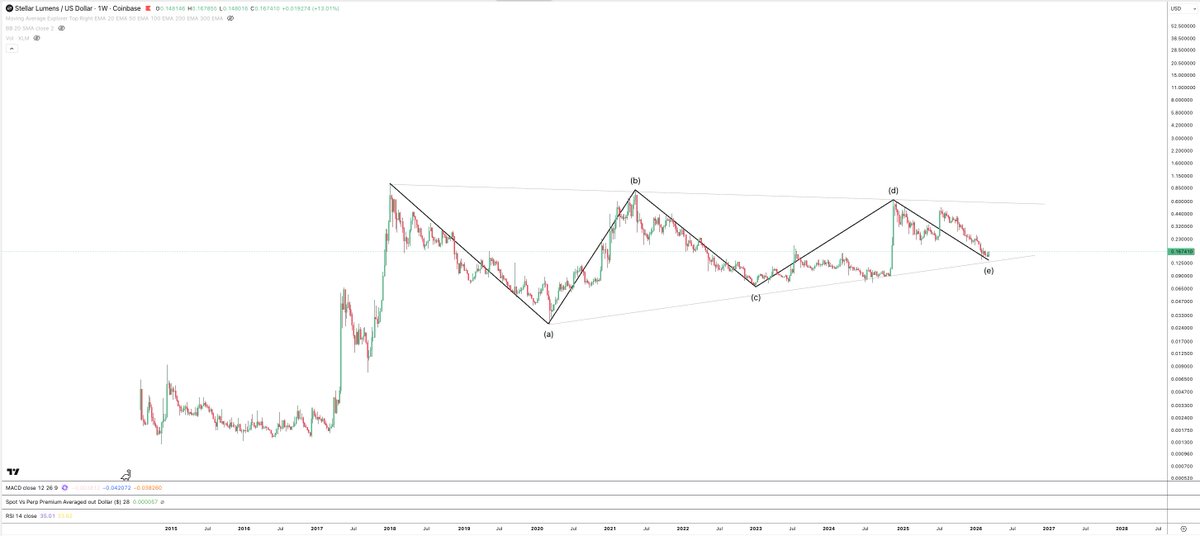
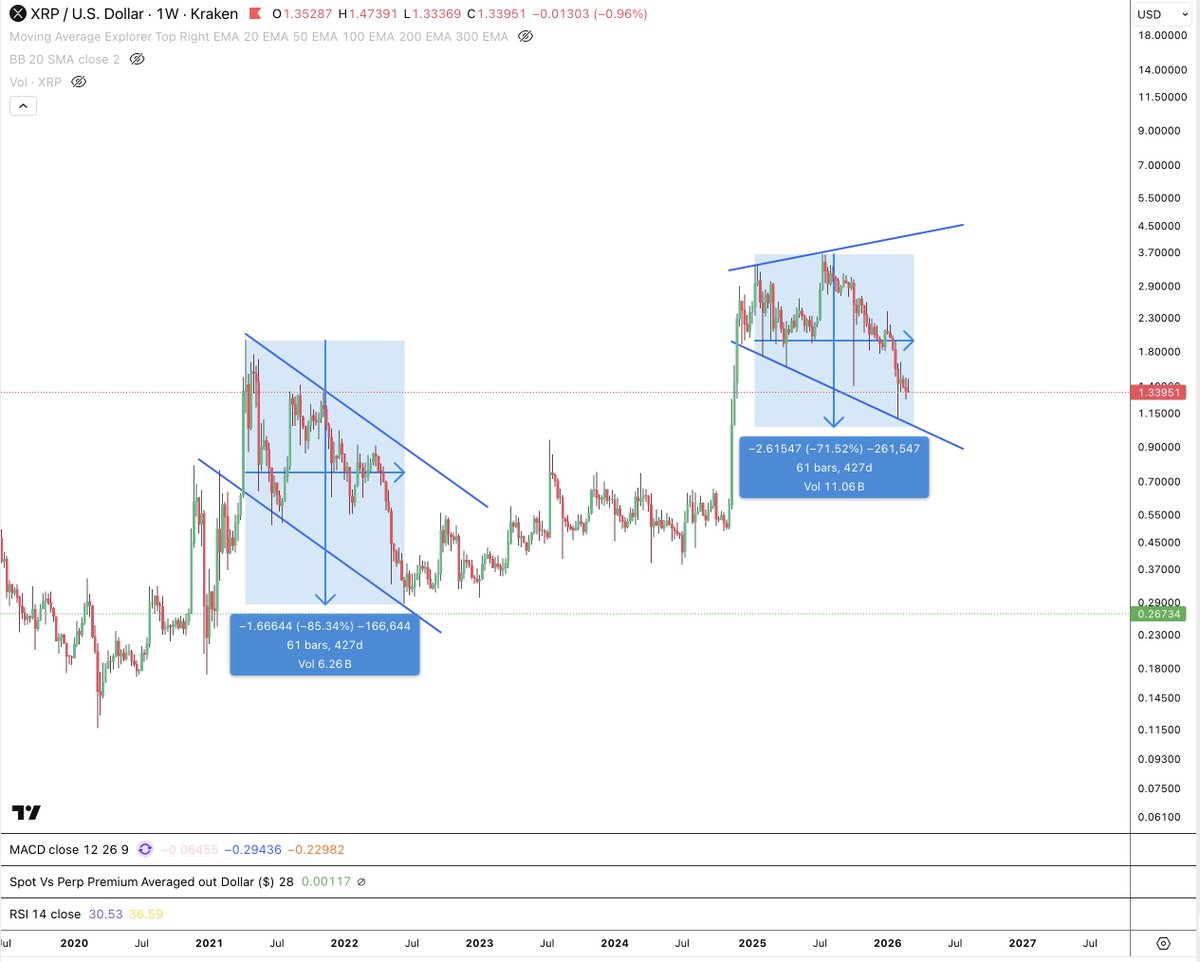
Below is the XRP chart with my primary long term Elliott Wave count. ✅We are most likely in a large degree 3rd wave up (cycle or super cycle). When completed, we will begin a large correction (at the same degree as 2018 - 2024). ✅Within this wave, we are likely in a sub wave 5 up. This is the final subwave. When it completes... you get the picture. There are, of course, alternate ways to count the waves. I myself, have at least one strong alt on deck. The labeling will work itself out over time... and some have different connotations as to how high we might go... but what is important is that all of the most likely alts have the same message now. We go up from here. An important note. In EW counts, if all the alt counts align, I tend to choose the most conservative. It is a risk management choice to help ensure I am always trading with the trend. Besides Elliott Wave, there is another feature on this chart that I want to dive into. A few horizontal trend line breaks that I believe may be very important. Many TA's hate diagonal lines... and that I am using them on a LOG chart... well, there are plenty of strong opinions out there. One of the arguments against them is that they break all the time/are unreliable. My view is that the breaks are an important feature... not so much on relying on them not breaking like horizontal support/resistance... but on the likelihood of a retest after they break. I have found through experience over a few decades trading in forex and crypto markets, that backtesting broken trend lines is very common. I am not sure the percentage here, but often enough to get my attention. And, the times a backtest does not happen, price very often still gets pulled toward the broken trend line... even if it does not quite get there all the way (too weak). Here's my point - I think that XRP may be rallying for a re-test of the trend-line that price broke definitively through back in early 2022. 2018 breakdown/re-test - This isn't the first time a trend line break and re-test has happened in XRP. A similar setup took place in 2018, where we had a breakdown... a quick attempt to reclaim (labeled as a re-test)... and a failure of the reclaim which led to a selloff to the low of that cycle (pandemic low... wave "A" on the chart), and then another re-test back up to the trend-line in wave "B". A few points about this idea: ✅2022's breakdown happened with a backdrop of a significant macro event... namely a massive shift in the lower interest rate cycle that has been in play for 40 years. Inflation kicked off, and interest rates rose... and rose FAST. Money supply was tightened quickly to try to starve off inflationary pressures. Crypto markets responded immediately, with he result of massive deleveraging (Terra/Luna, Celsius/Voyager/3AC bankruptcies, etc.) on the heels of this abrupt macro environment change. ✅The macro backdrop is important, because these conditions have continued to be in place until recently. As such, Alt's have suffered throughout the early parts of this bull market beyond what has happened when we were in a macro "loose" monetary policy environment indicative of the past 40 year cycle. ✅You can see that weakness in XRP with its feeble attempt at a re-test of the broken trend line in July 2023 ("D" wave). This wave was also highlighted by a landmark victory of Ripple over the SEC, where XRP was judged to not be a security. While we did get a big pop on that day, it did not re-test the broken trend line. Why? because of the feeble liquidity in the market resulting from central banks world-wide still fighting inflation by starving liquidity. ✅Today, the macro environment is different... and it has been so for over a year on the global side. As measured in Global M2, we have seen liquidity expand significantly. Inflation seems to have been largely tamed for the moment, and while the world is still reeling from the effects of the massive monetary inflation hits of the past few years, triggered in large part by the massive money printing during the pandemic to keep the market afloat while the world shut down, many of the worlds central banks have loosened their grip, and liquidity conditions have improved significantly. Of course, famously... the US Fed is still cautious and not lowering interest rates as quickly as most of its peers. However, it does seem likely that lower interest rates are coming. ✅The crypto market is responding to this more accommodative macro environment. And XRP specifically, is benefitting from this and the shift that the Trump admin is championing to provide much needed regulatory certainty to crypto in the US. I don't have to tell you how the price of XRP, and other crypto assets have responded. Alt season is here! ✅The point. The conditions are aligned between the macro environment, the US regulatory environment, and a much more accommodative liquidity policy from central banks than has been present in any way since the breakdown in 2022. Conditions are near perfect for XRP to take its best shot at a re-test of that broken trend line imminently. Will it re-claim the trend line? I don't know, but I see the likelihood much less than whether it will re-test it. Now that we are in price discovery, there are a host of different targets TA's will have. Some more measured than others. I have multiple step level targets that I am looking at (and have already posted) as we progress toward what I view as the end of this bull cycle. Worth repeating... my view here is that we continue to push back up to the underbelly of that broken trend line from years prior. Where exactly we touch it will determine our ending price for this cycle, but somewhere in the range of $15 - low $20's. Of course, as price progresses, I will be sure to post my views as transparently and often as I can. Please do form your own views, price targets, and risk management plan in the meanwhile... I cannot be more emphatic about this... and congratulations to the #XRPCommunity and those in #crypto wide and far. The events taking place in the US regulatory bodies now and over the past months are extremely exciting and long overdue. To those of you who have fought directly against the powers that be to help usher in their arrival... my most sincere "thank you" is in order. Not simply because I am better off financially as a result (which is true), but because I believe that the world is better off and more free with a supportive regulatory framework in place for crypto... and that public blockchains now have a real chance to become true utilities for our common use. Be well...
protechtor tweet media
English
22
34
252
21.5K
protechtor
protechtor@protechtor·
@IncomeSharks We are about 9% down from ATH at today’s close in S&P.
English
1
0
0
238
protechtor
protechtor@protechtor·
Most people have never heard of Claude, nor RPA. RPA in a deterministic design is limited. Add non-deterministic decisioning, and things get interesting. The combo has the potential to be very powerful.
Claude@claudeai

You can now enable Claude to use your computer to complete tasks. It opens your apps, navigates your browser, fills in spreadsheets—anything you'd do sitting at your desk. Research preview in Claude Cowork and Claude Code, macOS only.

English
0
0
1
226
protechtor
protechtor@protechtor·
@PeterLBrandt All a banana split needs whipped cream, nuts, and a cherry on top to finish it off. 😂
English
0
0
0
154
The Factor Report
The Factor Report@PeterLBrandt·
The Big Banana is forming a Little Banana -- and it indicates there is about to be a Banana Split $BTC🍓🍌🍨🫕
The Factor Report tweet mediaThe Factor Report tweet media
English
60
133
1.5K
211.2K
protechtor
protechtor@protechtor·
$XLM long term.
protechtor tweet media
English
1
1
12
750
protechtor
protechtor@protechtor·
Ok... got a bunch of likes here. Looks like there are more interested in Elliott Wave. Will put together a more detailed post on my primary and secondary counts.
English
1
0
2
136
protechtor
protechtor@protechtor·
$XRP Weekly. I have had this idea for awhile and shared it publicly. That the impulsive wave for $XRP ended BEFORE the new all time high reached in summer 2025... in Jan 2025... many months before. Will detail my view here if there are enough likes here, but the net is that the impulsive pattern subwaves starting in July 2024 arguably fit best, and the pattern since then fits best as a corrective one. So... if this is true, then where are we at relative to the correction? How much longer might we have until we can see another wave up? Noone can tell for sure, but let's look at the last bear cycle on the chart to compare... both time and price. Last bear cycle took 61 weeks start to finish. In that one, the price high was the start. The price low was the finish. It retraced ~85% of its price. How long? If we start 61 weeks from the Jan 2025 high, we get to 61 weeks in mid March 2026. How far? Lets look at the lower trendline. We might already be at the low, however, if we go lower, the line intersects with 61 weeks near $1.05. So, if the analysis is correct, we are very close to a bottom in time and price. Markets aren't exact, so I would give a little space in time and price. The alternate I have may take us lower with a likely liquidity hunt that is quickly retraced, and had a longer time horizon of correction before we attempt a new high... but essentially it also places odds on at least a counter trend up wave soon. Like or comment if you want me to lay out the Elliott Wave options in more detail.
protechtor tweet media
English
4
11
91
6K
protechtor retuiteado
Marc Andreessen 🇺🇸
My information consumption is now 1/4 X, 1/4 podcast interviews of the smartest practitioners, 1/4 talking to the leading AI models, and 1/4 reading old books. The opportunity cost of anything else is far too high, and rising daily.
English
1.4K
3.9K
35.1K
34.6M
Curve Finance
Curve Finance@CurveFinance·
Dear @PancakeSwap. Looks like you copied our code without asking. It is violation of its license. Not only it is illegal: historically it showed to be unwise for those who did it this way in other regards. In any case. If you want to enjoy using stableswap without legal problems and to borrow some of our expertise to keep users SAFU - you still can contact us for licensing and collaboration.
Curve Finance tweet media
PancakeSwap@PancakeSwap

Introducing better prices for swapping stablecoins and tightly-pegged assets. StableSwap is now live on PancakeSwap Infinity ♾️ Lower slippage. Dynamic fees.

English
496
383
4.1K
866.8K
protechtor
protechtor@protechtor·
@ripplediktaste @VALELORDX Depends on what you bought at. If at .11, it’s a pretty nice return. Seems you are unhappy with volatility.
English
1
0
0
24
protechtor retuiteado
Aksel Kibar, CMT
Aksel Kibar, CMT@TechCharts·
Equity markets are panicking today. That's why time to panic was yesterday after the open. I will tell you why panic is today, because many risk & compliance department meetings took place yesterday and possibly agreed to reduce risk across the board.
Aksel Kibar, CMT@TechCharts

My CIO and CEO @LongArcNews used to say: "If you are gonna panic, panic early." So if you are going for risk reduction across the board tomorrow, start at the first rebound after the open. Or else, stay calm and let the markets resolve.

English
24
56
806
111.2K
protechtor
protechtor@protechtor·
@GionniLuca Not saying it we hit new lows tomorrow. There are corrective patterns that can push us up above $1.66 even. Just saying that the odds favor another low at some point.
English
0
0
0
49
JayDee
JayDee@GionniLuca·
@protechtor I wish but I don’t see it man. I see us waking up tomorrow and $XRP running between 1.40-1.60
English
2
0
3
67
protechtor
protechtor@protechtor·
$XRP. Before the weekly close. Zooming in. Worth repeating. The pattern off recent lows is in 3 clear waves. This infers that at some point we will get another low below $1.12 before another attempt at an impulsive (5 waves up) that would mark a low of significance. RSI on the weekly is at all time lows, but this does not mean price cannot get to new lows. Weekly timeframes take time to play out. Bias is still lower, but the bears are really pushing it here. The time to be short was in fall last year, and/or after the rally in Jan. Here, it is stretched... at least short term. Mind you... since 2014, the story is the same... extremes get stretched to both sides... in rallies, and in selloffs. This is the nature of volatile assets.
protechtor tweet media
protechtor@protechtor

$XRP. Short term skills injection. The rebounds circled on the chart are not impulsive (aka motive) moves. They are corrective. This infers new lows in the wave pattern. There is, however one clear impulsive move on the chart at lower timeframes. Anyone see it? EW Reference on corrective/motive patterns: elliottwave.com/waveopedia/cor…

English
5
2
14
2.3K
protechtor
protechtor@protechtor·
You could be right. low $50k's would give ~60% drop from peak to through for this cycle. 2011 cycle : ~93% drop 2013 cycle : ~86% drop 2017 cycle : ~84% drop 2021 cycle: ~75% drop Using regression would put us in the range of ~70% drop... mid $30's. Mid $30's to low $50's probably a reasonable range to find a bottom. Interestingly... the trough to peak % gains... 2011-2013 = 575x 2015-2017 = 94x 2018-2021 = 21x 2022-2025 = 8.1x Using regression would put us in the range of ~5x for the next cycle. A low of $50k would project a top of $250k for the next cycle. A low of $35k would project a top of $175k for the next cycle. History is not a projection of future results, but the pattern so far is diminishing volatility over each cycle.
English
0
0
1
24
Daniel
Daniel@0xDani·
@protechtor Feels a bit too optimistic to me but yeah anything can happen
English
1
0
1
20
protechtor
protechtor@protechtor·
$BTC weekly. Long term view. Updated to add a bit more color. "If it rhymes."
protechtor tweet media
English
1
0
5
612