Onchain Decoded

2.7K posts

Onchain Decoded banner
Onchain Decoded

Onchain Decoded

@OnchainDecoded

Decoding onchain data for everyday investors 📊 Whale tracking 🌐 Exchange flows 🌐 Weekly reports 🌐 DMs open for new projects. 📩

Bergabung Mart 2023
3.8K Mengikuti394 Pengikut
Tweet Disematkan
Onchain Decoded
Onchain Decoded@OnchainDecoded·
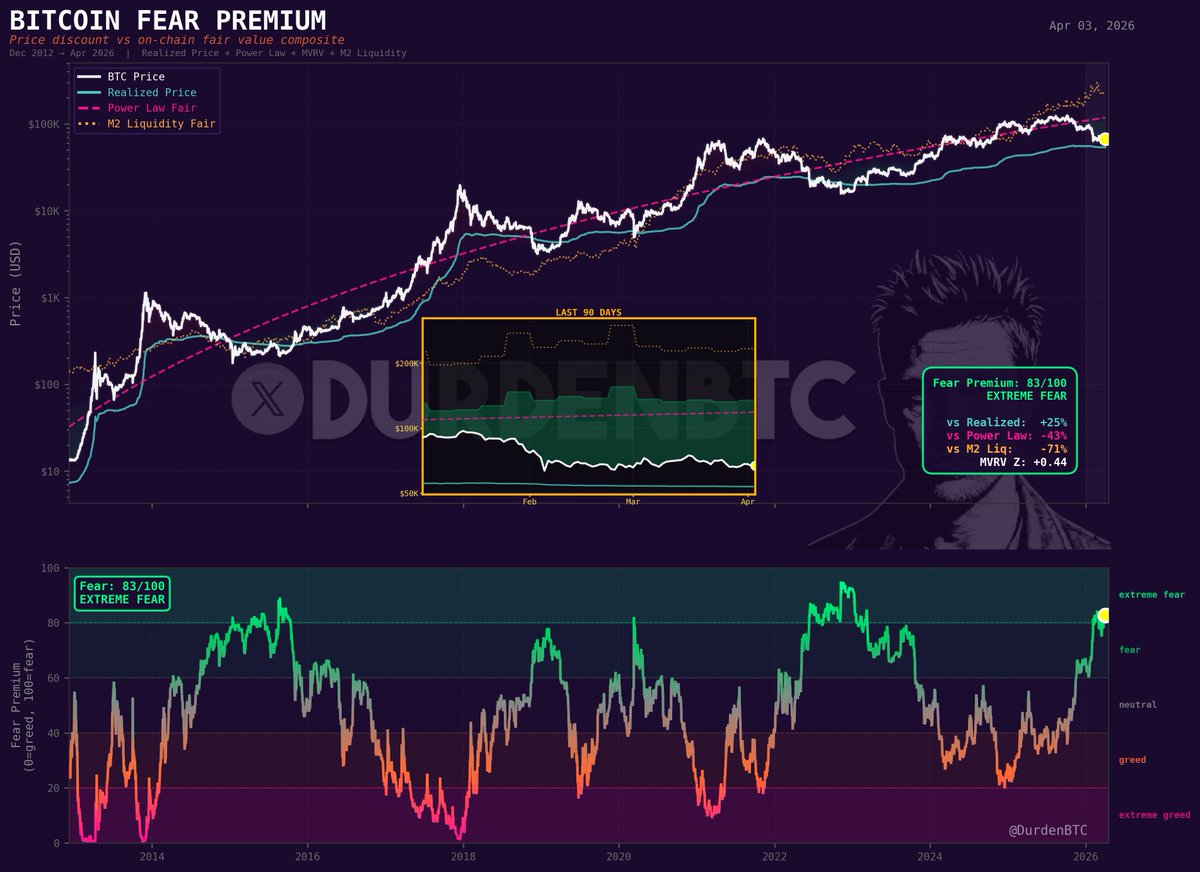
Bitcoin has no earnings. No revenue. No dividends. But it does have one number that has defined the floor in every bear market in its history. Most investors have never heard of it. It's called the realized price. It currently sits at $55,019. Here's why it might be the most important number in crypto 🧵
English
1
0
3
228
Onchain Decoded
Onchain Decoded@OnchainDecoded·
Bitcoin has a built-in economic reality check: Thermocap. Total miner revenue ever paid = real capital input into the network. When market cap hits 25-35x Thermocap, you're at a cycle top. We're at ~15x right now. Nowhere near speculative excess. 📊 onchainnews.blog/bitcoin-thermo…
English
0
0
0
2
Onchain Decoded
Onchain Decoded@OnchainDecoded·
@seth_fin Extreme Fear at 9 on F&G, day 50. Onchain shows LTHs aren't panicking though. Long-term holder supply still near ATH while sentiment collapses. The weak hands are shaking; the data says diamond hands are staying put. 📊
English
0
0
0
1
Crypto Seth
Crypto Seth@seth_fin·
$BTC SENTIMENT IS EXTREME FEAR. BITCOIN IS BELOW THE 200W. It will be interesting next week.
Crypto Seth tweet media
English
20
9
122
6.1K
Onchain Decoded
Onchain Decoded@OnchainDecoded·
@_checkonchain Sell-side Risk Ratio lines up with what MVRV and Realized Price are signaling too. All three metrics in the same historical accumulation range simultaneously. The data converges even when price stays flat. The phase is real, even if it's uncomfortable to sit through. 📊
English
0
0
0
0
_Checkonchain
_Checkonchain@_checkonchain·
“Time pain” is the phase most Bitcoin investors underestimate. Price drifts sideways. Headlines stay negative. Nothing seems to change… except participants. - Impatient capital slowly exits - Conviction builds with new buyers - Volatility compresses before expanding again By the time the final move comes, most are already exhausted. In our latest piece, @_Checkmatey_ continues assessing how Bitcoin is performing through this process, with a particular focus on where the likely ‘time-pain’ capitulation may find its ultimate low → newsletter.checkonchain.com/p/time-pain-us…
_Checkonchain tweet media
English
11
12
168
13.8K
Onchain Decoded
Onchain Decoded@OnchainDecoded·
@coinbureau Institutional flows down 2/3 YoY, yet onchain tells a different story. Long-term holder supply near all-time highs. BTC accumulation is happening at the chain level while TradFi volumes dry up. Smart money doesn't flow through JPMorgan. 📊
English
0
0
0
6
Coin Bureau
Coin Bureau@coinbureau·
🚨 JUST IN: JPMORGAN REPORTS CRYPTO FLOWS DROPPED TO $11 BILLION IN Q1 2026, ROUGHLY ONE-THIRD OF THE SAME PERIOD LAST YEAR.
Coin Bureau tweet mediaCoin Bureau tweet media
English
41
45
224
14.9K
Onchain Decoded
Onchain Decoded@OnchainDecoded·
@IOV_OWL @dom_kwok Only 7% own it, under 1% use it daily. Meanwhile onchain data shows long-term holders near all-time highs in BTC supply. The people who understand what this is aren't selling. The 99% will eventually arrive to a much scarcer market. 🔍
English
0
0
0
1
King Solomon (Ryan Solomon)
@dom_kwok Way less than 1% of the world uses crypto daily. Eventually the majority of the world will use it without even knowing.
English
6
0
33
1.5K
Dom Kwok | EasyA
Dom Kwok | EasyA@dom_kwok·
only 7% of the world currently owns crypto. doesn’t take a gigabrain to know what happens when the rest of the 93% starts buying.
English
185
247
2K
49.5K
Onchain Decoded
Onchain Decoded@OnchainDecoded·
@lanhubiji ETH exchange reserves hit an all-time low in Q1 2026 too. 16M ETH on exchanges, lowest ever recorded. Network activity ATH + exchange reserves ATL in the same quarter is the kind of structural divergence that precedes the next leg. Usage is real and the data confirms it. 📊
English
0
0
0
12
蓝狐
蓝狐@lanhubiji·
以太坊已经过了仅“靠故事活着”的阶段,即使在如今糟糕的宏观环境下,实际使用量仍在加速增长: 以太坊在2026年Q1网络活动创下历史新高,全网处理了约 2.004亿笔交易,这是有史以来单季度最高的交易量纪录。 而背景是宏观经济高度不确定、人们厌恶风险、市场悲观情绪蔓延。而在这种情况下,以太坊的链上交易量却逆势大幅增长。
蓝狐 tweet media
中文
37
11
113
15.7K
Onchain Decoded
Onchain Decoded@OnchainDecoded·
@DurdenBTC Exchange reserves add to the composite. 2.21M BTC on exchanges, an 8-year low. LTH-SOPR still below 1 too. When liquidity, Power Law, MVRV, and exchange flows all say the same thing at the same time, the divergence from fair value rarely stays this wide for long. 📊
English
0
0
0
1
DurdenBTC
DurdenBTC@DurdenBTC·
bitcoin is 71% below where global liquidity says it should be trading. fear premium: 83/100. power law discount: -43%. mvrv z-score: 0.44. the composite of every major valuation model says btc is the most underpriced it's been since the 2022 bear market bottom.
DurdenBTC tweet media
English
7
10
60
1.5K
Onchain Decoded
Onchain Decoded@OnchainDecoded·
@BitcoinTogethe The dual-model convergence is the key part. One framework can be wrong. When Power Law and MVRV align independently at the same reading, it filters most of the noise. Supply side confirms it too. All three saying the same thing. 📊
English
0
0
0
5
Bitcoin Together
Bitcoin Together@BitcoinTogethe·
Big signal plus iykyk the narrative is strong with institutional buying just getting started and supply drying up. Better #studybitcoin
Onchain Decoded@OnchainDecoded

@AdamBLiv Power Law z-score at -0.93σ lines up with what MVRV is showing too. Two independent frameworks, same signal. The 12-month median return you cite is consistent with LTH behavior at this MVRV range. When multiple models converge, the signal tends to be more reliable.

English
2
0
1
8
Onchain Decoded
Onchain Decoded@OnchainDecoded·
BTC: $66,855 · -0.82% 📉 NYSE closed for Good Friday. Bitcoin doesn't do bank holidays. March jobs report landed at 8:30 AM with no equity market open to absorb it. Bitcoin held $66K through the print. Exchange reserves: 2.21M BTC (7-year low). F&G at 9. The structural picture hasn't changed.
English
0
0
1
25
Onchain Decoded
Onchain Decoded@OnchainDecoded·
@thebtcdad The onchain data tells a different story. MVRV Z-Score at 1.2 has historically been cycle bottom territory, not the start of a new leg down. LTH supply at all-time highs. Exchange reserves at 8-year lows. Sub-$50K would require metrics breaking into ranges not seen since 2018. 📊
English
0
0
0
3
The ₿itcoin Dad 🇺🇸
Bitcoin remains in a bear market despite a bounce to $67,000, with onchain metrics and models pointing to a potential bottom below $50,000.
English
1
0
2
75
Onchain Decoded
Onchain Decoded@OnchainDecoded·
@DocumentingBTC @blocks @jack Bitcoin accessibility infrastructure returning right as LTH accumulation hits a 13-year high and exchange reserves sit at 8-year lows. The onchain setup doesn't look like mid-bear. Tools like this tend to show up when the smart money is already positioned. 📊
English
0
0
0
22
Documenting ₿itcoin 📄
Documenting ₿itcoin 📄@DocumentingBTC·
₿REAKING: Jack Dorsey’s technology company @Blocks announced today a new ‘bitcoin faucet’ website btc.day that goes live on April 6. The original in 2010, gave away five bitcoins to every site visitor promoting education, that would be $350,000 today.
Documenting ₿itcoin 📄 tweet media
English
161
744
5.9K
820.6K
Onchain Decoded
Onchain Decoded@OnchainDecoded·
Onchain metrics don't support the $40K-$50K thesis right now. MVRV Z-Score at 1.2 has historically marked cycle lows, not the midpoint of a bear. LTH supply at all-time highs and exchange reserves at 8-year lows. Price models are one input but the blockchain is telling a different story. 📊
English
0
0
0
0
ZoneCrypto
ZoneCrypto@_ZoneCrypto_·
✦ Bitcoin $BTC price models indicate a potential bottom between $40K and $50K: Bitcoin $BTC continues to experience a bear market even after a recent rise to $67,000, as onchain metrics suggest a possible bottom below $50,000. On Monday, Bitcoin $BTC ($BTC) buyers saw a modest resurgence, elevating the price to an intraday peak of $67,860. Experts believe Bitcoin $BTC remains under bearish conditions, with key indicators highlighting the likelihood of a deeper correction as $70,000 becomes a new resistance level.
English
2
0
1
23
ZoneCrypto
ZoneCrypto@_ZoneCrypto_·
📰 News of the day — March 30, 2026: ✦ Ripple $XRP expands its presence by joining Singapore's financial sandbox while Bhutan faces a significant Bitcoin $BTC selloff: Ripple $XRP has become a participant in Singapore's BLOOM cross-border trade finance sandbox program, enhancing its capabilities in the region. Meanwhile, Bhutan is experiencing a substantial selloff of Bitcoin $BTC, contributing to notable market fluctuations. These developments highlight the evolving landscape of cryptocurrency and financial innovation in Asia.
English
1
0
0
93
Onchain Decoded
Onchain Decoded@OnchainDecoded·
Worth checking the onchain data before calling $40K. MVRV Z-Score is at 1.2, a level that has historically been cycle bottom territory, not midway through a bear. Exchange reserves at 8-year lows and LTH supply at all-time highs. The structural setup is different from prior extended downtrends. 📊
English
0
0
0
0
Onchain Decoded
Onchain Decoded@OnchainDecoded·
Exactly right. MVRV at 1.8 puts the average holder in modest profit but well below prior cycle tops at 3.5-4.0. Historically anything sub-2.0 during a drawdown has been accumulation territory before the next leg. Exchange reserves confirming the squeeze adds conviction to that read. 👀
English
0
0
0
2
B💊coelhao
B💊coelhao@RafaelMeta29411·
Exchange reserves nos menores níveis em 6 anos. MVRV em 1.8 — ciclos de topo historicamente chegam a 3.5-4.0. (DEXTools) Dois dos indicadores mais confiáveis do ciclo dizendo a mesma coisa. Você está ouvindo os dados ou as manchetes? 📈 #Bitcoin #OnChain #MVRV
Português
1
0
1
11
Onchain Decoded
Onchain Decoded@OnchainDecoded·
@Kriveton 2.21M BTC on exchanges right now, an 8-year low. The last two times reserves fell this sharply, the supply squeeze took 6-12 months to fully show in price. Cold storage absorption at this scale is a slow structural shift. Patient capital tends to win here. 📊
English
0
0
0
4
Mr Krivetko
Mr Krivetko@Kriveton·
The amount of Bitcoin held on exchanges continues its historic decline, hitting multi-year lows. This signals a severe supply squeeze, as more BTC is being moved to cold storage by long-term holders and institutions. #OnChain #Bitcoin #SupplyShock
English
2
0
2
23
Onchain Decoded
Onchain Decoded@OnchainDecoded·
@OnchainIns5699 F&G at 12 with RSI near 28 is a historically rare combo. In the prior two cycles, this kind of dual-signal oversold setup preceded the strongest 30-90 day recoveries. MVRV at ~1.2 and exchange reserves at 8-year lows add more weight to that signal. The data is stacking. 📊
English
0
0
0
0
Onchain Insights
Onchain Insights@OnchainIns5699·
📊 ONCHAIN INSIGHTS DAILY BRIEFING – APRIL 2, 2026 ₿ BTC • Price Action: Bitcoin dropped to $66–67K following Iran geopolitical shock, hitting extreme oversold conditions (RSI 27.97). Fear & Greed Index at 12 signals capitulation, but whale distribution (not accumulation) indicates large holders are reducing exposure rather than buying dips. • On-Chain Signals: 11.2M BTC in profit vs. 8.2M in loss mirrors previous bear bottoms; consolidation forming near November 2025 support with 84% of 2026 in downside breakout—second-most extreme reading in history. Halving (11 days away) approaching at block 945K. • Institutional Shift: Structural retail-to-institutional ownership transition: businesses +69K BTC, governments +25K BTC, individuals –62K BTC in Q1. BlackRock deposited $90M to Coinbase; ETFs now drive rallies but face 5.6K weekly outflows. Overhead supply from $80K+ purchases blocks recovery to $120K+. 💠 CRYPTO • Ethereum: ETH hit $2,040 with $1B taker sell volume during geopolitical panic (–4–5%), but outperformed traditional havens since Iran crisis (Feb 27–Mar 31: +9.02% vs. gold –11.61%, S&P –5.09%). Binance ETH reserves below Feb 2024 lows while stablecoin reserves accumulate—suggests fund repositioning or hedging. • Market Sentiment: Crypto ETF outflows accelerating: Bitcoin –5.6K weekly, Ethereum –145K weekly. Whale capitulation exceeds $200M daily losses. Q1 2026 crypto performance: BTC –22%, worst quarter since 2022. Solana shows rare daily inflows but –173K weekly. Stablecoin (USDC) inflows suggest cash positioning. • Altcoins & DeFi: 58% of altcoins remain under pressure; Ethereum positioned for relative outperformance. Ethereum network showing strength: 788K daily active addresses, 255K new addresses daily despite market panic. 🌍 MACRO • Geopolitical Crisis: Trump's Iran address triggered S&P 500 futures –550 points in 25 min; ceasefire odds collapsed from 55% to 24% by April. War spending accelerated to $42B since Feb 28 ($40B+ monthly burn rate). Strait of Hormuz flow crashed to 1.1 mb/d (95% below normal); global visible inventories down 130M barrels. • Energy Shock: WTI surged to $111–$113 (+11% single day, +72% recent weeks); Brent reached $141.37 (highest since 2008). US gasoline hit $4.08/gal (+36% monthly, largest 30-year spike). European diesel at $200/bbl; arbitrage to Asia profitable at $244/ton premium. Oil futures (Dec contracts ~$79) lag spot, suggesting markets don't expect prolonged disruption. • Inflation Pressures: Consumer inflation expectations hit 6.2% (highest since Aug 2025); 1-year expectations 3.8%. ISM Manufacturing PMI up third straight month but cost pressures highest since June 2022. Stagflationary squeeze: growth slowing while costs elevated. FIFA World Cup 2026 final tickets 20.3x higher than 2022 ($4,185 vs. $206). • Labor & Growth Weakness: Job openings fell to 6.88M (below 2018–2019 pre-pandemic); job-to-unemployed ratio halved (2.0 → 0.9). Job cut announcements spiked to 60.6K in March. Q1 GDP forecast dropped to 1.64%; consumer spending contributes Equities & Asset Divergence: S&P 500 opened –1.26% (–$830B market cap) then recovered to +0.11% by mid-day; VIX elevated. Historic stock-oil divergence: –0.4 correlation, 38 of 50 days diverging (most extreme 20+ years). Energy ETF (XLE) lagging crude by 38.7%—profits not keeping pace. Household equity exposure at 25.63% of net worth (highest since 1940s, exceeds 2000 dot-com peak). • Bonds & Credit Stress: 30-year mortgages at 6.46%. Bonds lost diversification value since 2022 inflation spike. Blue Owl Capital's $36B flagship fund faced 21.9% redemption requests but processing only 5%/quarter (–$3.2B unmet requests). Tech-focused PE funds experiencing 40.7% outflows. • Fed & Growth Outlook: 98.2% probability no rate change in April. Treasury Secretary Bessent forecasts 4–5% real GDP growth; 59 of 110 S&P 500 firms issuing positive EPS guidance (54% vs. 42% 5-year avg). US tariff rate dropped to 8.477% from 10%+ peak but remains elevated vs. 2–3% baseline. 🎯 THE BIG PICTURE Markets face a perfect geopolitical storm colliding with structural vulnerabilities. Iran tensions have exploded oil to decade-highs while ceasefire odds collapse, triggering stagflation concerns—energy shocks paired with slowing growth. Equities vulnerable despite corporate optimism: households hold record equity exposure (25.6% of net worth, exceeding 2000 bubble), crypto is in capitulation with whale distribution, and credit markets show stress (PE fund redemption caps, bond diversification failure). Bitcoin's extreme oversold readings and halving proximity offer technical relief-rally potential, but whale positioning suggests further downside before capitulation clears. Oil's inverse correlation to stocks, bonds, and bitcoin—at 20-year extremes—indicates fragile positioning across all asset classes. Until geopolitical clarity emerges and oil stabilizes, expect continued volatility with asymmetric downside risk despite strong earnings guidance. $BTC #BTC #BITCOIN
English
2
0
1
24
Onchain Decoded
Onchain Decoded@OnchainDecoded·
@MeasuredEdge LTH SOPR below 1 during macro shocks has historically been one of the cleaner capitulation markers. In 2018-19 and 2022, the recovery phase started when this metric returned and held above 1.0. STH-SOPR is showing a similar setup right now. Worth watching both together. 📊
English
0
0
0
2
Measured Edge
Measured Edge@MeasuredEdge·
BTC Onchain Alpha — LTH SOPR (Spent Output Profit Ratio) Long Term Holders are currently spending coins at a loss. The LTH SOPR is at 0.83. Below 1 means LTHs are realizing losses on average. Worth noting: in the previous two bear market bottoms (2018-2019 and 2022), LTH SOPR dropped below 0.6 before a meaningful bottom formed. We're not there yet. This doesn't mean lower is guaranteed, macro could resolve and change the picture. But from a pure onchain standpoint, historical capitulation has been deeper than where we are now. Watching this metric closely heading into the rest of the year. Source: BGeometrics
Measured Edge tweet media
English
1
0
1
16
Onchain Decoded
Onchain Decoded@OnchainDecoded·
@BitcoinTogethe Exactly. Supply side is as constrained as I've seen it. Exchange reserves near 8-year lows, LTH supply at ATH. The narrative is strong because the data is strong. 📊
English
0
0
0
2
Onchain Decoded
Onchain Decoded@OnchainDecoded·
@AdamBLiv The convergence is the part most people miss. Any single model can be wrong. When Power Law, MVRV, and LTH behavior all say the same thing at the same time, the signal-to-noise ratio goes way up. 📊
English
1
0
1
36
Adam Livingston
Adam Livingston@AdamBLiv·
🔥BITCOIN JUST FLASHED A SIGNAL WITH A 100% HIT RATE ACROSS 15 YEARS OF DATA🔥 The power law z-score just dropped to −0.93σ. I backtested every single time BTC reached this level of oversold. Here's what happened next: → Median 12-month forward return: +631% → WORST-case 12-month return: +82% → Win rate: 100% (7 out of 7 episodes) → Best case: +2,500% Read that again. The absolute floor... the worst outcome in history from buying this level... was still almost a DOUBLE. For context: • Mar 2020 COVID crash hit this zone → +1,020% in 12 months • Nov 2022 FTX collapse hit this zone → +151% in 12 months • Sep 2023 hit this zone → +128% in 12 months BTC at $66K is trading 47% below its power-law fair value of $125K. The model (R² = 0.96) has held across 4 halving cycles, 3 bear markets, and every black swan you can name. The math doesn't negotiate. It just compounds. Not financial advice. Just a model and 5,700 days of data.
Adam Livingston tweet media
English
90
303
1.7K
136.7K