Measured Edge

137 posts

Measured Edge banner
Measured Edge

Measured Edge

@MeasuredEdge

Technical Analysis · Orderflow · Onchain Reading what the market is telling us. Discipline & Data over noise.

Katılım Ekim 2024
295 Takip Edilen62 Takipçiler
Sabitlenmiş Tweet
Measured Edge
Measured Edge@MeasuredEdge·
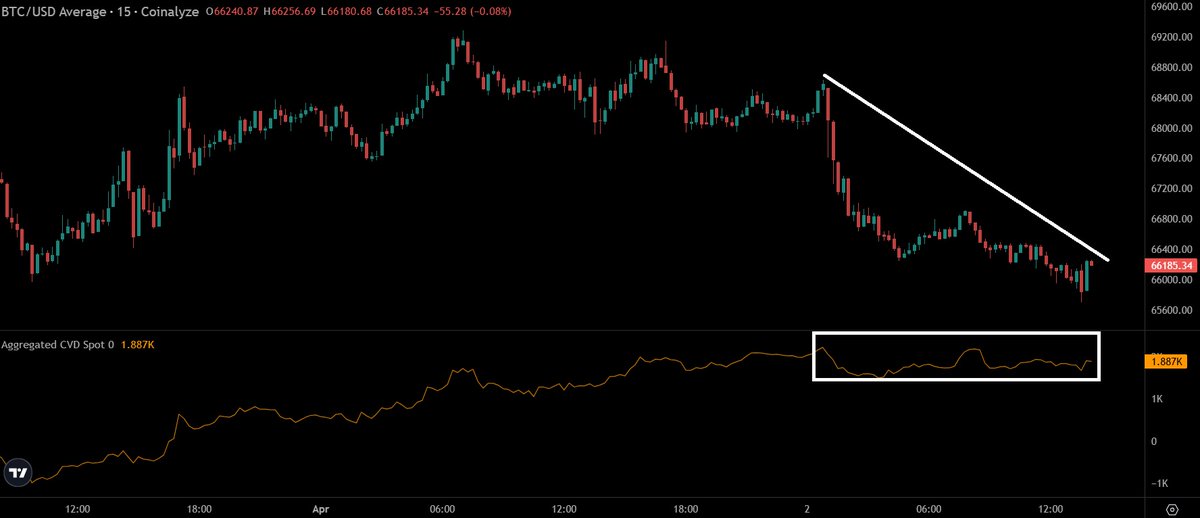
Following up on this morning's $BTC update: I mentioned spot CVD as part of the orderflow read. Let me break down what CVD actually is and how to use it.🧵
English
1
0
1
91
Measured Edge
Measured Edge@MeasuredEdge·
@bluechipdaily True, objectivity over narrative always. Especially into a long weekend with the April 6 Iran deadline still open. The close was textbook. But the macro binary hasn't resolved. Staying flexible in both directions is the only rational approach right now.
English
1
0
0
481
Larry Tentarelli, Blue Chip Daily
One of the biggest obstacles that most have to overcome in markets is emotional bias. My post that yesterday’s close was a bullish close, a 1.5% red to green reversal off the lows, on potentially bearish news, (potential escalation in Iran) - going into a 3-day weekend, is a textbook bullish close - in isolation - literally trading 101. Whether $SPX eventually works higher or makes a lower low remains to be seen, and wasn’t mentioned in my post. The best traders and investors stay objective to price action and don’t get locked into a directional view. Those who can’t be objective are most often part of the majority that loses money over time in trading.
Larry Tentarelli, Blue Chip Daily@bluechipdaily

$SPX erased a -1.5% open to close green on the day, ahead of a 3 day weekend. That’s a bullish sign to close out the week.
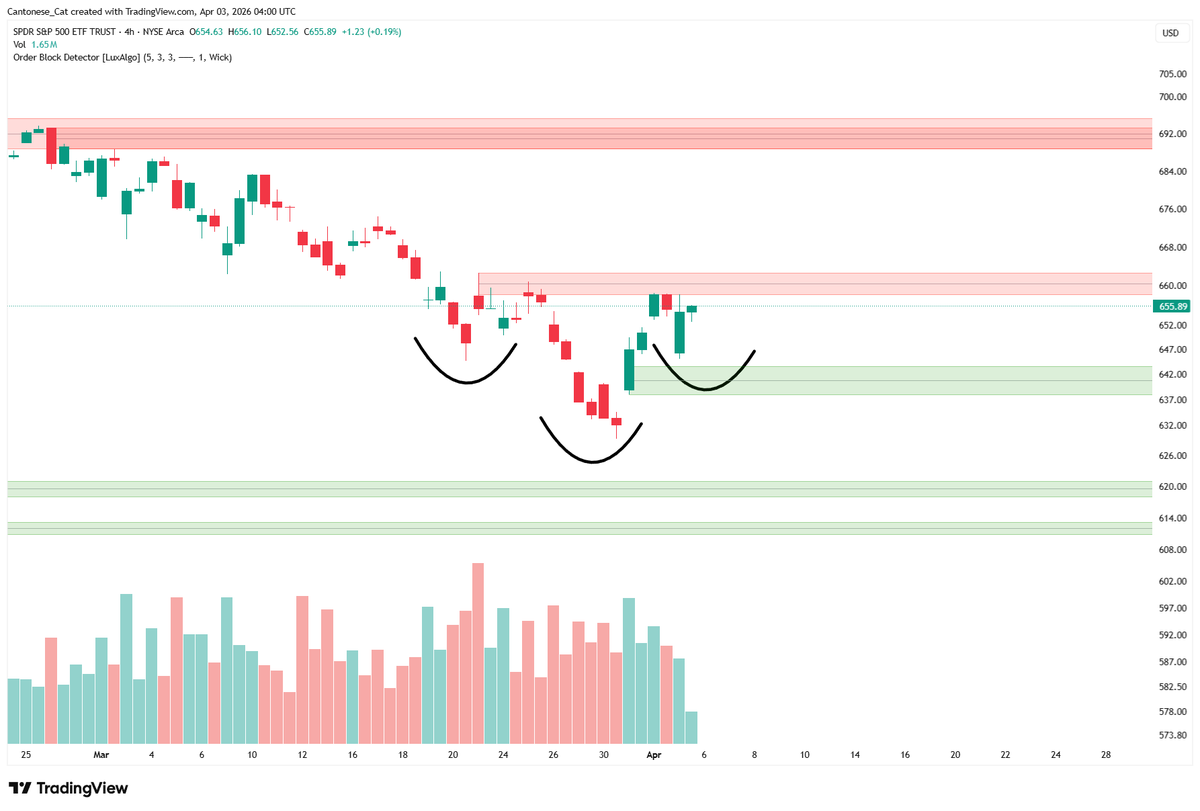
English
24
17
205
28.6K
Measured Edge
Measured Edge@MeasuredEdge·
@MikeZaccardi Strong print and encouraging to see private payrolls leading. The volatility in this series over the past year has been striking though, big swings in both directions. One strong month is a good sign but the trend needs a few more consistent prints to confirm a genuine recovery.
English
0
0
0
13
Measured Edge
Measured Edge@MeasuredEdge·
@market_sleuth Clean call. The ADP signal was there. NFP beat was the logical follow through. Worth noting the soft wages print at +0.2% alongside the beat. Strong jobs + soft wages = labor market holding up without adding fuel to inflation. Best case scenario for now.
English
0
0
3
612
John
John@market_sleuth·
As I wrote in Wednesday’s “Midday Market Update” after the better than expected ADP report that I expected the NFP (released today) to exceed forecast. US Nonfarm Payrolls Actual 178k (Forecast 65k, Previous -92k, Revised -133k) US Unemployment Rate Actual 4.3% (Forecast 4.4%, Previous 4.4%) 🔽
John tweet media
English
14
7
168
19.6K
Measured Edge
Measured Edge@MeasuredEdge·
March Jobs: +178K vs +65K expected. Massive beat. Unemployment rate improved to 4.3%. Soft wages at +0.2% though: Fed isn't cutting. Oil above $100, Hormuz still closed. Strong jobs just confirms higher for longer. BTC spiked to grab liquidity around 67.3K then retraced. Spot CVD trending higher since yesterday's low, that's the more important signal. Still a lot of shorts stacked up, squeeze fuel if structure holds. But the poor low from yesterday is still untagged. Could go either way from here: a sweep lower before any meaningful move up is still on the table. Following structure, not predicting.
Measured Edge tweet media
English
0
0
0
14
Measured Edge
Measured Edge@MeasuredEdge·
BTC Onchain Alpha — LTH SOPR (Spent Output Profit Ratio) Long Term Holders are currently spending coins at a loss. The LTH SOPR is at 0.83. Below 1 means LTHs are realizing losses on average. Worth noting: in the previous two bear market bottoms (2018-2019 and 2022), LTH SOPR dropped below 0.6 before a meaningful bottom formed. We're not there yet. This doesn't mean lower is guaranteed, macro could resolve and change the picture. But from a pure onchain standpoint, historical capitulation has been deeper than where we are now. Watching this metric closely heading into the rest of the year. Source: BGeometrics
Measured Edge tweet media
English
1
0
1
16
Measured Edge
Measured Edge@MeasuredEdge·
The structure is there and volume confirming is an important detail. Inverted H&S with that kind of buy block support is hard to ignore. Worth adding: VIX and DXY are both showing short term weakness at resistance right now. That confluence adds weight for a short term bottom playing out.
English
2
0
2
188
Measured Edge
Measured Edge@MeasuredEdge·
A bounce being due doesn't mean the macro has cleared indeed. Range support holding, orderflow showing potential squeeze fuel to the upside, short term bounce is definitely on the table. But until macro resolves, treating it as a range trade rather than a new trend. Patience here.
English
0
0
0
30
Measured Edge
Measured Edge@MeasuredEdge·
We've been ranging since the early February lows and price is currently bouncing from the lower end of that range. As long as it holds, you react accordingly: range support is range support until it isn't. But you're right, every bounce getting sold before 70K is not a sign of strength. However orderflow has been showing bullish signs in terms of Spot CVD and bid around that area. Cautiously bullish until we hit the higher part of the range and then will re-assess the data once we hit it. Level to level is the key.
English
0
0
0
96
CyrilXBT
CyrilXBT@cyrilXBT·
$BTC BTC at $66,671 and that macro trendline is literally right underneath price now. Three touches on that line already and every single time it held. But I am not going to pretend this setup feels comfortable because it does not. Every rally attempt is getting sold into before we can even get back to $70K. The resistance zone between $72K and $76K has rejected us multiple times now. Until BTC can close above $70K with real conviction I am treating every bounce as a potential dead cat. The macro trendline is the last real floor before things get genuinely ugly.
CyrilXBT tweet media
English
20
28
101
7.5K
Measured Edge
Measured Edge@MeasuredEdge·
Clean read on the gap fill. What's interesting from an orderflow perspective is the setup supporting the next move: OI reset, spot CVD holding while price pulled back. A lot of shorts have piled in as well. If structure allows and 67.7K gap is the target, the squeeze fuel is definitely there.
English
3
0
3
769
Astronomer
Astronomer@astronomer_zero·
$BTC longs Gap filled, local pullback I drew materialized ✅ Just a quick comment here. I don't often elaborate on price action respecting intraday (m30) timeframe, that would take me a lot of time, ruin the cleanliness of my timeline and require 10+ posts per day on just $BTC price action, not worth my time. But the same way my system is respected on the hourly timeframes and daily timeframes, it also is respected on the minute timeframes. It just contains a lot more moves, internal pullbacks, liquidity reads and structure. From last post, drew out how a pullback would happen first, here it is. Simply expecting the local gap to fill. Technically, that's a bearish bias formed on the H2 timeframe, which can be used on the m5 timeframe (H2/12) if that is your interest. Not something I recommend per se. Scalping is a high ratio of fees-to-profit. Also requires active monitoring and high size. But educationally, useful to know your system works if you try something new or are trying to learn how to trade. Zooming out to the H12, do you see the same gap fill we just had on the H2, we are aiming for next regarding 67.7k?
Astronomer tweet media
Astronomer@astronomer_zero

$BTC longs My next target is 67.7k Had this question commonly occur. "Where do we make money Astro?" The first place where I aim to reduce position size of this long is 67.7k give or take. That's the typical width of first trim of almost every trade we take. Hope that answers your question(s).

English
18
17
233
49.2K
Measured Edge
Measured Edge@MeasuredEdge·
The energy independence point is valid and underappreciated. But even as a net exporter, the US doesn't escape global oil pricing. Brent benchmarks still feed directly into domestic inflation and Fed policy. In the 1970s, the oil shock took months to fully transmit into inflation and Fed policy. Today markets reprice instantly. The pain is faster but potentially shorter. Oil above $100 keeps inflation elevated, which keeps the Fed restrictive. That's a headwind for risk assets even if the US produces its own oil.
English
0
0
4
395
IncomeSharks
IncomeSharks@IncomeSharks·
The US now exports more oil than it imports. This is important because that was not the case in the 70s or 80s or 2000s. Better insulated but still affected. The difference between a 2022 midterm type correction versus a massive crash.
English
44
9
331
33.6K
Measured Edge
Measured Edge@MeasuredEdge·
@optionflys Structure is clean. The flush and bounce at those levels was textbook positioning. How it closes on the weekly here matters. Long weekend with unresolved macro means gaps are possible Monday open.
English
1
0
1
476
Mo
Mo@optionflys·
$SPX & $QQQ Open flushed hard and shook out weak hands right at the lows. Same structure. No redraws. Price bounced exactly where it was supposed to. Now let’s see how it behaves into the close before the long weekend. If this holds, that flush was just positioning — not a breakdown. Structure first. Everything else follows. $SPY
Mo tweet media
English
14
14
127
12.2K
Measured Edge
Measured Edge@MeasuredEdge·
Negative funding and OI building while price holds: shorts are piling in at a key level. That's squeeze fuel, not confirmation of breakdown. Short term bounce is definitely on the table. Longer term though, onchain still pointing toward lower before a meaningful bottom. Macro hasn't cleared yet. Watching the data cautiously.
English
0
0
1
223
John
John@CryptoGodJohn·
Maybe I'm being a delusional bull here, but I have to say even with all the chaos in the Middle East, oil prices surging, and stocks showing weakness, Bitcoin has stayed firm over the last few weeks. It feels like the worst is behind us & crypto may have already priced in most of the downside momentum I think we begin a rally towards $80k+ soon and most people will have wished they were buying in the mid to low $60's a few weeks from now
John tweet media
English
69
30
247
22.7K
Measured Edge
Measured Edge@MeasuredEdge·
The CVD divergence is real. Spot holding while price drops is classic short-driven move. Fits with the negative funding and OI building we're seeing. Don't need a catalyst to squeeze that, just needs the right level. 66K is where it gets interesting. If it holds, those shorts get uncomfortable fast.
English
0
0
3
576
Ted
Ted@TedPillows·
The current $BTC dump isn't spot-driven. Spot demand is stagnant, while price is going down. This means the dump is mostly due to new shorts opening. I think we are due for a bullish Trump post to liquidate the late shorts.
Ted tweet media
English
147
98
625
79.4K
Measured Edge
Measured Edge@MeasuredEdge·
Three rejections from the downtrend line is hard to ignore. What makes this retest interesting is the orderflow: OI reset, negative funding, spot CVD diverging from price. Could see a short term bounce here before the structure plays out. 65-66K holding on a close is the key tell.
English
1
0
2
286
Measured Edge
Measured Edge@MeasuredEdge·
@Stefan_B_Trades Worth noting the bid/ask delta is also starting to flip positive at these levels, adds to the divergence case. Negative funding + shorts stacking + spot CVD holding = classic short squeeze setup. Agree, not the spot to be short.
English
1
0
2
230
Stefan
Stefan@Stefan_B_Trades·
$BTC There is quite a high decorelation from spot to perps - bullish divergence here Put that in confluence with the negative funding and consistent shorts coming in we might witness a fast exit liquidity pump in the upcoming hours.. Do not short here. My 2 stupid cents.
Stefan tweet mediaStefan tweet media
English
26
12
188
23.6K
Measured Edge
Measured Edge@MeasuredEdge·
@VentureCoinist The range structure is clear. What's keeping it stuck is the macro ceiling: oil shock, DXY bid, Fed stays restrictive until Hormuz resolves. Hard for price to break higher when liquidity conditions aren't improving. The apathy makes sense in that context.
English
0
0
1
294
Luke Martin
Luke Martin@VentureCoinist·
$BTC has only spent 6 days not stuck in a range this year. During those 6 days it was free-falling from a higher range. Price still not low enough for people to be excited about buying & not expensive enough to induce fomo. Feels like peak 2018 apathy.
Luke Martin tweet media
English
25
16
183
17.1K
Measured Edge
Measured Edge@MeasuredEdge·
@kriptoholder Interesting map. Would be curious to see this extended down to 62K: that's where some major range lows sit. If that liquidity cluster gets tagged first, the setup for a stronger move higher becomes a lot more compelling.
English
0
0
0
183
KriptoHolder 🔔
KriptoHolder 🔔@kriptoholder·
The #BTC liquidity map is very clear. • Heavy long liquidity is stacked in the 65K–64K range • Short liquidity is clustered above in the 69K–71K range • Price is currently trapped between two liquidity pools The scenario is simple: A clean move up is unlikely without taking the downside liquidity first. A sweep toward ~64K → liquidity taken → then a stronger upside move becomes more likely. Price moves where the liquidity is.
KriptoHolder 🔔 tweet media
KriptoHolder 🔔@kriptoholder

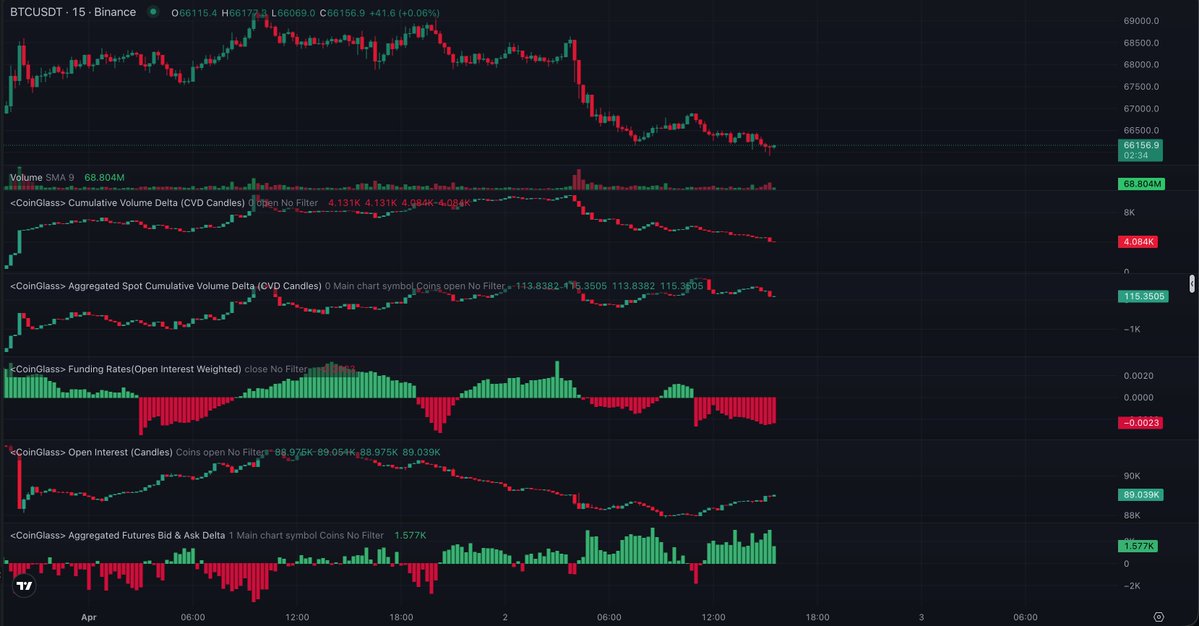
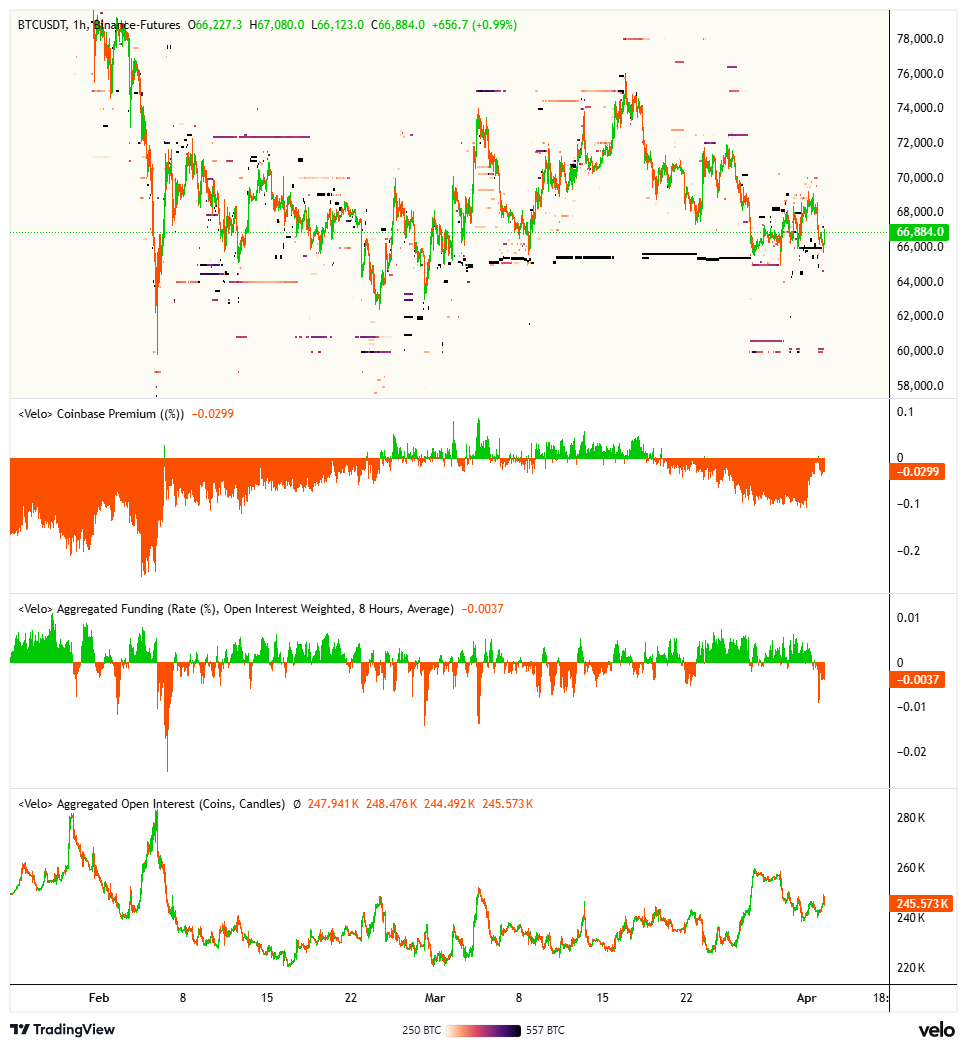
There’s an interesting divergence on #BTC. While price is moving sideways / weak: • Spot CVD is still negative but starting to curl up → selling pressure is fading • Open Interest is declining → positions are getting closed / leverage is being flushed • Coinbase Premium remains negative → spot demand is weak, but showing early signs of recovery What does this mean? The market isn’t aggressively chasing shorts — instead, it’s preparing for a compression after positions get cleared. If liquidity continues to build, an upside sweep (short squeeze) wouldn’t be surprising. Stay patient — moves usually come out of these compression phases.

English
9
17
196
12.8K
Measured Edge
Measured Edge@MeasuredEdge·
Good point. This plays out identically in crypto bear markets. 2022 had multiple 20-30% relief rallies on the way to the bottom: each one felt like the turn. The prevailing trend always wins until it doesn't. Separating intermediate moves from structural shifts is where most people lose money.
English
0
0
0
6
Thierry from arvy 🇨🇭
Thierry from arvy 🇨🇭@ThierryBorgeat·
During the 2008 financial crisis, the S&P 500 fell 57%. But along the way it rallied: +11% +7% +12% +7% +24% Each one felt like the market had bottomed. Each one was wrong. This is the bear market trap. The rallies are real. The recovery isn’t. Not yet. The most expensive mistake in investing is confusing an intermediate rally with a new bull market. Separate the short-term noise from the prevailing trend. Always.
Thierry from arvy 🇨🇭 tweet media
English
60
174
861
100.8K
Measured Edge
Measured Edge@MeasuredEdge·
@chad_ventures Watching the same level. What's interesting is the orderflow at 66K right now. OI reset, limit bids stepping in, spot CVD turning up. Could be the absorption needed to hold the flag support. A clean hourly close below flips the picture fast though. Time will tell.
English
1
0
1
20
chad.
chad.@chad_ventures·
$BTC is back at the $66,000 level after getting rejected at the $68,000 zone again. Levels working perfectly. Losing $66,000 would eventually mean a bear flag breakdown, which could send price lower. Let's see whether it holds here.
chad. tweet media
English
5
6
44
3.2K
Measured Edge
Measured Edge@MeasuredEdge·
@intocryptoverse The seasonal pattern holds up well historically, February low, March lower high, April weakness in midterm years. There's always a narrative to explain it after the fact indeed. VIX and DXY have been showing strength for months. The data was already pointing here.
English
2
0
2
1.2K
Benjamin Cowen
Benjamin Cowen@intocryptoverse·
Bitcoin tends to find a low in February, lower high in March, then it drops back down in April in midterm years. Those that faded this want to blame current price action on a speech. There is always a narrative. Don’t let emotional investors affect your resolve
English
223
138
2.9K
146.9K