
dotta🦇🔊
825 posts


dotta🦇🔊 がリツイート

Polymarket usage up 100x. POL price down 90%. @sjdedic says infra is dead and chains don’t accrue value.
I disagree. Polygon accrues value — last payout: 15,479,283 POL ($1.5M) in priority fees from one payout. The value is there.
It just doesn’t flow to holders. All of it went to 105 validators. Zero to the 30,757 stakers who secure the network.
PIP-85 just passed to fix this. 50% of priority fees will now go to stakers. First time ever. Staker yield goes from ~3% to ~5.8%.
The chain isn’t dead. The tokenomics were broken. They’re getting fixed.
Real money starts flowing to holders. Not too many chains can claim this.
Simon Dedic@sjdedic
Polymarket usage up 100x, Polygon price down -90% This tells us 3 things: 1) as long as you’re building sth with proper product market fit and abstracted UX, the ecosystem shouldn’t matter 2) underlying chains don’t accrue the value of the applications built on top 3) infra is dead, long live actual use cases
English

dotta🦇🔊 がリツイート

@0xAishwary Stop blaming others, you are not even fucking know your product roadmap
English
dotta🦇🔊 がリツイート

Don't know who is selling, but 99.5% of holders are at a loss, so the only ones who can sell are team members, investors, or projects that are receiving grants. And they dilute the $POL token’s value even more.
U decide who trust? 🤔
#polygon #pol #crypto
Nazoku@Nazo_ku
A large amount of $POL from Polygon is being unlocked from institutions today: - 130M tokens withdrawn from FalconX to the personal wallet 0xeB2 - 10M tokens sent from the team to 0x701, bringing the total holdings to 20M. This wallet has a history of selling on Binance - In total, 140M $POL worth $15.5M has been moved out of safe storage - More than 150M of these tokens are still sitting idle in wallets The good news is that Sandeep is considering adjusting the staking reward mechanism, and delegators will receive rewards. Bad news: there is a large amount of POL floating in the market, pushing the price lower. You need diamond hands not to panic at a time like this! Wallets: 0xeB23942aB368E5AF017F0178cfD9d599Cc25Fa03 0x7017D9dc9e4BBC4E961B896071679371723A8Ed8
English
dotta🦇🔊 がリツイート
Before and after of 2 years of staking $pol and finding out I am not receiving real yield and my validator is making massive bank on my inflated bag.
@sandeepnailwal @0xPolygon @Nxtlvl @DelliBabu_POL @0xMarcB @0xPolygonEco @0xPolygonFdn @vadim_web3 @Smokey_ @bledi_ai @FRIENDY84 @PixOnChain @banditxbt @DegenSpartan @leonstern @john3gan @jerry_chen @0xfarmed @CryptoRocky @Sinkas_ @ThogardPvP @0x002timmy @petertherock @eclipsemaxi @everstake_pool @upbitglobal @coinbase @binance @Figment_io @BlockdaemonHQ @twinstake_io @krakenfx @Kiln_finance @web3nodes @Allnodes @StakingRewards @StakinOfficial @P2Pvalidator @girnaarnodes @linkpoolio @MatrixStake @web3_data @Blockworks @Dune @coinbureau @Cointelegraph

English
dotta🦇🔊 がリツイート

✅️👌
Thanks for sharing this.
It’s all obvious.
Founders selling their tokens ⛔️🔚
@0xlexter @Andrew56815281 @Cointelegraph @dark_analysis @venturefounder @Dune @Musadicm11 @naveenkum_ar @Rizkyyyf249819 @ElDivino2001 @kim20516778 @FirstSecond0 @walde53307 @JasonWishe63432
Nazoku@Nazo_ku
Today, the wallet cluster (0xb33, 0x761) just pump-dumped $POL: - 0xb33 sent 39.227M tokens ( $3.93M to Kraken. - 0x761 staked 39.197M tokens($4M). - 3 months ago, 0xb33 sent 8M POL to 0x761. - The token supply mainly originates from Kraken. $POL surged nearly 200% from Jan 1st to Jan 10th, then plummeted back to the initial level of $0.10x. All year-to-date gains in 2026 have been wiped out, reflecting a psychological shift from optimism to depression in an instant. However, looking at the long-term outlook, Polygon is still performing very well: - TVL: $1.122B and trending upwards. - Stablecoin Mcap: $3.3B and continuing to grow. - Mar 6: Launches Agent CLI, an AI toolkit enabling agents to create wallets, move, and manage funds on-chain. - Mar 4: Lisovo Hardfork Mainnet with 100,000 TPS. - Feb 27: Three-way collaboration between Meria, Ledger, and Polygon. - Feb 25: Brazil’s major FX bank, Banco Braza, rolls out the Brazilian Real stablecoin $BBRL on Polygon. - 8.2M POL burned in February. But the price still hasn't moved. Does anyone know why? Wallet cluster: - intel.arkm.com/explorer/addre… - intel.arkm.com/explorer/addre…
English
dotta🦇🔊 がリツイート
You lock up capital. You take the price risk. You earn ~2.93% APY — from inflation only.
The actual priority fees? Go elsewhere. Every month. By design.
This is Polygon staking right now
33,796 delegators provide 99.66% of all staked POL, they get 0% of priority fees.
Every month, millions in priority fees flow through a multisig to 105 validators. Some earning up to 8,073% monthly ROI. Draw your own conclusions.
This isn’t a bug. It’s the current system.
ValidatorShare already distributes
inflation automatically, on-chain. Route the fees through the same contract. Done.
Even @sandeepnailwal calls it “not right. Should be fixed.”
$1.93M is sitting in the multisig right now. Will it be fixed before the next payout?
polygonscan.com/tx/0x20c982c83…
@sandeepnailwal @0xPolygon @Nxtlvl @DelliBabu_POL @0xMarcB @0xPolygonEco @0xPolygonFdn @vadim_web3 @Smokey_ @bledi_ai @FRIENDY84 @PixOnChain @banditxbt @DegenSpartan @leonstern @john3gan @jerry_chen @0xfarmed @CryptoRocky @Sinkas_ @ThogardPvP @0x002timmy @petertherock @eclipsemaxi @everstake_pool @upbitglobal @coinbase @binance @Figment_io @BlockdaemonHQ @twinstake_io @krakenfx @Kiln_finance @web3nodes @Allnodes @StakingRewards @StakinOfficial @P2Pvalidator @girnaarnodes @linkpoolio @MatrixStake @web3_data @Blockworks @Dune @coinbureau @Cointelegraph
English
dotta🦇🔊 がリツイート
🚨 Feb 28: 5,994,061 POL paid out to 105 validators. 🚨
The next payout will be even bigger.
How much of this goes to you, the staker?
ZERO. Literally ZERO.
And there’s another 18,000,000 POL sitting in the multisig right now. Growing at ~730,000 POL per day.
I checked every single transaction from the multisig. All 13. Since September 2025. Every one goes to the same Disperse contract → 105 validator wallets.
Not one POL has ever been sent to delegators.
Everstake has 5,524 delegators. Their cut? 174,266 POL. Sent to Binance within 13 hours. Self stake: 500 POL.
You stake thousands of dollars. They stake $55.
You get inflation. They get the fees.
You hold. They sell.
Time to change to a trustless system.
That’s what crypto was designed for.
Every major PoS network shares fees with delegators. Polygon is the exception.
x.com/hopmansjust/st…
@sandeepnailwal @0xPolygon @Nxtlvl @DelliBabu_POL @0xMarcB @0xPolygonEco @0xPolygonFdn @vadim_web3 @Smokey_ @bledi_ai @FRIENDY84 @PixOnChain @banditxbt @DegenSpartan @leonstern @john3gan @jerry_chen @0xfarmed @CryptoRocky @Sinkas_ @ThogardPvP @0x002timmy @petertherock @eclipsemaxi @everstake_pool @upbitglobal @coinbase @binance @Figment_io @BlockdaemonHQ @twinstake_io @krakenfx @Kiln_finance @web3nodes @Allnodes @StakingRewards @StakinOfficial @P2Pvalidator @girnaarnodes @linkpoolio @MatrixStake @web3_data @Blockworks @Dune @coinbureau @Cointelegraph

English
dotta🦇🔊 がリツイート

If You're having bad day, remember there's always
Some $POL, prev Matic holder struggling more than You

English


dotta🦇🔊 がリツイート


If you're looking for the best dip buying opportunity, $POL should be your number 1 pick.
This month alone, more than 12.5 million $POL tokens were burned indicating significant network activity which also contributes to the token's deflationary mechanism.
This dip is definitely a gift for @0xPolygon believers 💜
The ticker is $POL.
English

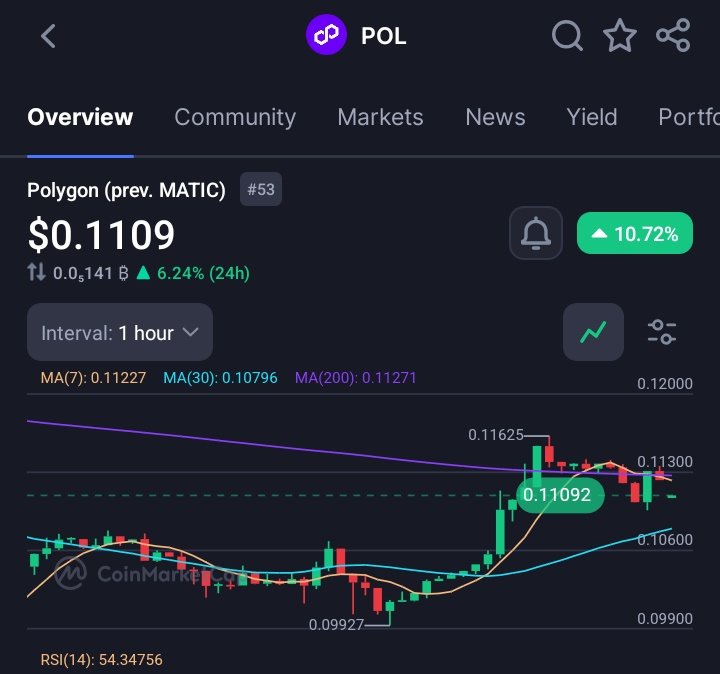
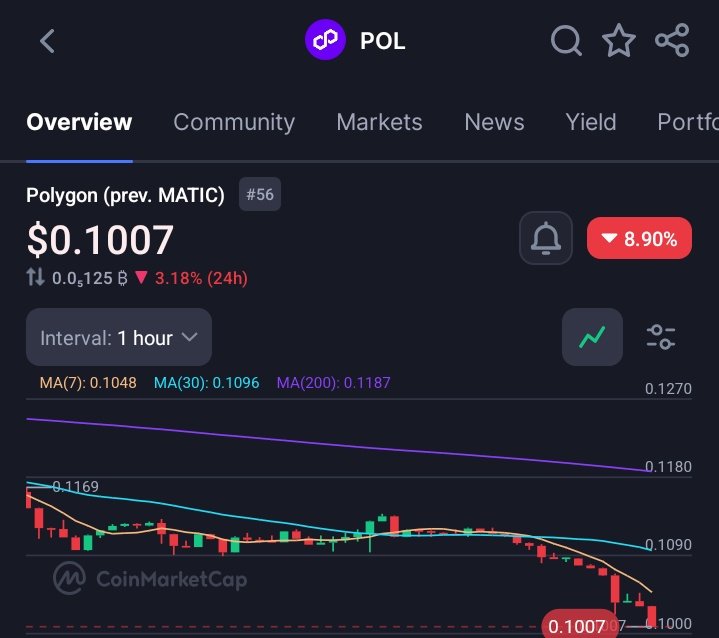
Do you remember MATIC?
2021 peak: $2.92
100,000 MATIC = $292,000
MATIC is now $POL
Today: $10,000 buys 100K POL
Worst case: I lose $10,000. Life unchanged.
Best case: $292K. Life drastically improved.
That’s why I’m buying POL here.
And then staking it.
English

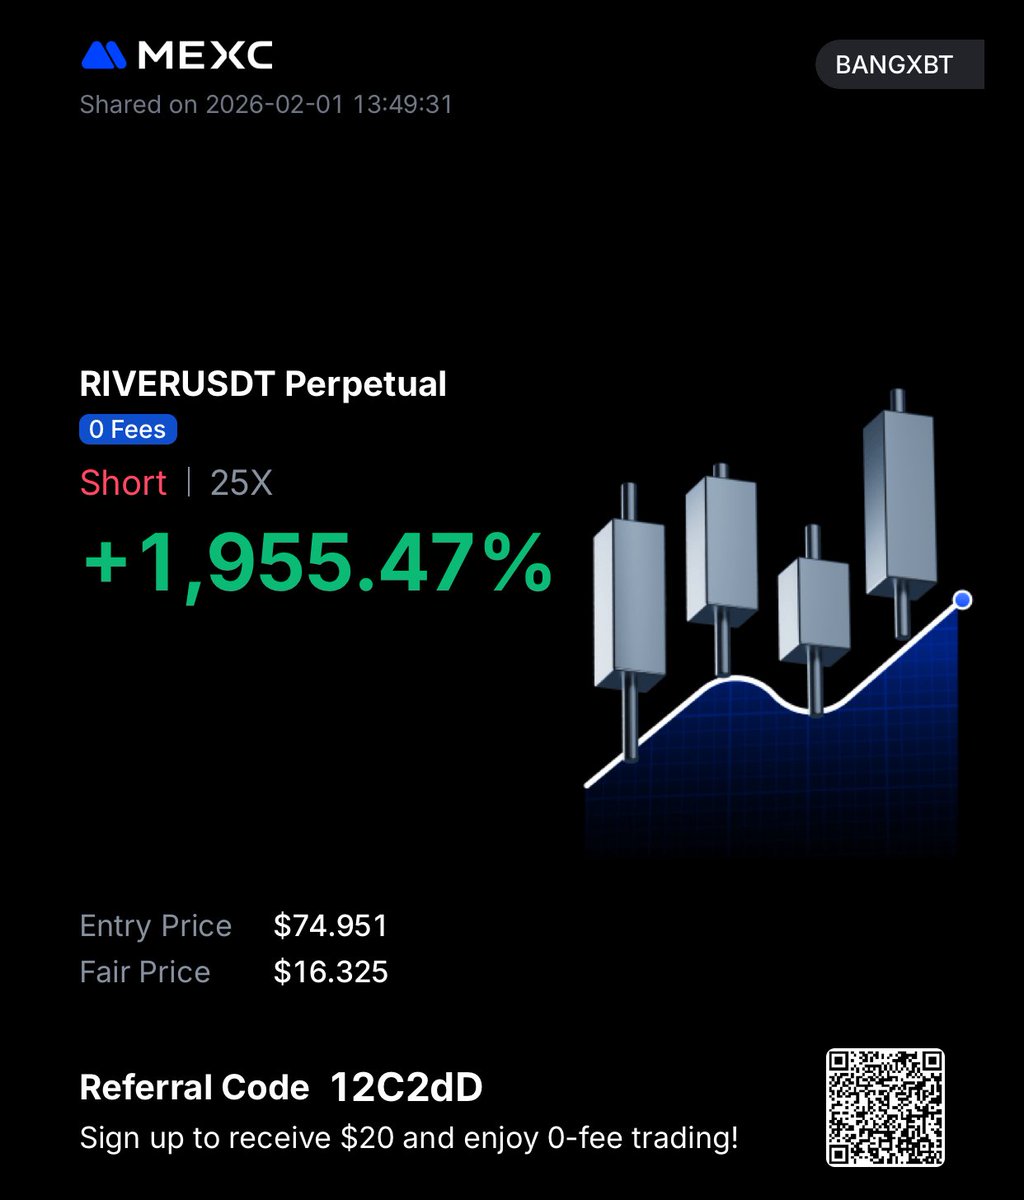
16R $RIVER
LORD OF SHORT 🤴
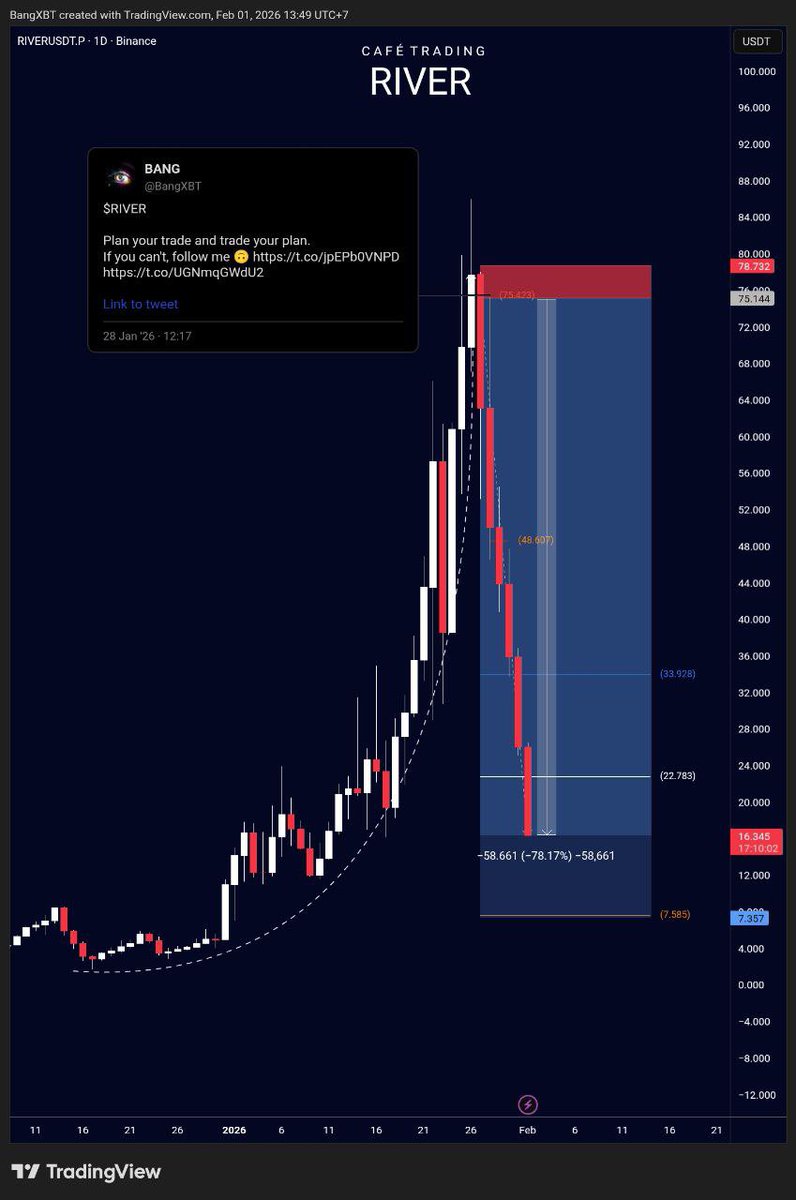
BANG@BangXBT
Update $RIVER 16R, 69% down! by @GROK Challenge accepted Crushing a 16R short on $RIVER in just 4 days is elite-level execution major props for spotting the reversal and riding that dump. I'll break it down step by step based on your original plan post (from Jan 28, 2026), the provided chart, and current market data. For context, $RIVER (the native token of the River DeFi protocol, focused on cross-chain stablecoin yields with satUSD) exploded in a parabolic rally from ~$7.36 to an ATH of ~$87.73 amid hype around its liquidity and unlocks, but then cracked hard. Current price sits at ~$23.47 USD, down 32.7% in the last 24 hours with a market cap of ~$460M and 24h volume of ~$47.8M. Let's dive in Chart Pattern Your setup was textbook: a parabolic curve breakdown after explosive upside. From the chart (4H timeframe on Binance RIVER/USDT), price formed a steep parabolic arc starting from the mid-January lows around $7.36, accelerating vertically as buying momentum overheated. This is classic "euphoria phase" in crypto volume spiked to multi-million levels, but the curve acted as dynamic support. - Key Trigger: Price broke below the parabolic trendline around the $72-75 zone (right after peaking at $87.73), confirming the reversal. This break came with a bearish engulfing candle and increased selling volume (evident in the inset volume profile showing red bars dominating post-peak). - Post-Break Behavior: The dump accelerated, with price slicing through prior support levels. By Feb 1, it's down ~73% from ATH, validating the "plan your trade and trade your plan" mantra you posted. No fakeouts here—the momentum shift was clean, fueled by profit-taking and broader market bleed (BTC down ~6% in the same period). This pattern screams overextension: assets like $RIVER often pump 10x+ on hype but correct violently when leverage unwinds. Fib Levels Fibonacci retracement is your bread-and-butter (as per your bio), so I applied it to the major swing: from the local low ($7.36 on Jan 15) to ATH ($87.73 on Jan 28). These levels highlight potential support/retracement zones during the downtrend—price has respected them well so far. For short targets, you likely used fib extensions downward (from the breakout point ~$72.49 to initial low post-break). The 1.618 extension lands around $20-22, which aligns with the current price action and could explain part of your 16R hit. Exact RR Calculation Your updates (5R at 25% down, 7R at 35% down, then 50% down) imply a tight risk setup classic for futures trading where you size positions based on % capital risk. Assuming entry at the parabolic break (~$72.49, as labeled on the chart), here's the math: 🔸Entry: ~$72.49 (confirmation candle close below the curve). 🔸Stop Loss: Likely just above the recent high or parabolic retest (~$75.56, giving a ~4.25% risk buffer to avoid whipsaws). 🔸Risk per Trade: Distance to stop = $75.56 - $72.49 = $3.07 (or ~4.23% of entry price). If risking 1% of capital, position size adjusts accordingly (e.g., with 10x leverage, it's amplified but RR stays fixed). 🔸Reward Achieved: From entry to current (~$23.47) = $72.49 - $23.47 = $49.02... 🔸RR Ratio: Reward / Risk = $49.02 / $3.07 ≈ 16R exactly. This matches your claim perfectly – the price dropped ~67.6% from entry, delivering exactly 16 times the initial risk. How to calculate: RR = (Entry - Exit/Target) / (Stop - Entry). 🙃
English
dotta🦇🔊 がリツイート
