
Bitcoin Daily
3.8K posts

Bitcoin Daily
@BitcoinxDaily
Data scientist turned full-time crypto trader since 2016. Math, data, and history over hype and vibes.
Miami, FL 가입일 Eylül 2016
359 팔로잉6K 팔로워

THE FRACTAL THAT SHOULD MAKE EVERYONE PAY ATTENTION.
Gold 1974: three waves. Fibonacci extension. Then parabolic.
Bitcoin 2026: same structure. Step 3 right now.
$62K is where the fractal holds or breaks.
Hold it: Fibonacci extension to $226K unlocks.
Lose it: fractal needs one more low.
Markets change. Patterns don't.
This one is 50 years old and still printing.
English
@cryptofergani No reason to be bullish if you actually understood what you were looking at instead of copy pasting brain rot

English

WE SAW THE BIGGEST BULL RUN IN HISTORY AFTER COVID CRASH
THE LAST 6 MONTHS WAS WORSE THAN COVID CRASH
I HAVE NEVER BEEN SO BULLISH
LONG YOUR FUCKING LONGS
BIGGEST. BULL. RUN. STARTING. NOW
English
@MerlijnTrader ETH analysis is irrelevant because it follows BTC and BTC is in a bear market, forming a bear flag.
This means 70% chance of continuation down for BTC which translates to 70% chance of ETH dropping lower.
English
TWO CUPS. TWO ASSETS. ONE OUTCOME.
Gold formed a decade-long cup.
Broke out. Went parabolic to $4.500.
Ethereum formed the same cup since 2021.
Breakout zone is being tested right now at $2K.
Hold $2K: ETH cup completes. $6K becomes the target. Lose it: handle needs more time.
Gold already proved the pattern works.
$ETH is about to confirm it.
English


This shows the mental gymnastics I keep referring to.
First it was "If everyone believes in the four year cycle then it won't happen."
Then BTC still topped in Q4 2025 anyways.
Then, in January when BTC was $98k, it was "Oh since everyone thinks the midterm year will be bad, then it will be good."
Then BTC still dropped into Feb anyways.
Now it's "Next leg down cannot happen since everyone is expecting it"

English
@cryptofergani It’s quite amusing when accounts who are always wrong repost content from other accounts who are always wrong
English
BITCOIN WILL NEVER TRADE BELOW $60,000 AGAIN
MARK MY WORDS
YOU WILL REGRET NOT FOLLOWING ME
English
Nothing has changed with this rally. In fact, I’ve been calling for this rally for over a month.
I expect it to continue up and potentially test $80k range next. Maybe even pushing as high as $85k.
I still see Bitcoin bottoming within August/Sept/Oct this year.
Price wise could be anywhere from $35k (worse case scenario) to $50k (best case scenario.

English
@saylordocs Incorrect.
You pointed at 3 halving years. We are still 2 years away from the next halving.
Context is COMPLETELY DIFFERENT.
English

BITCOIN HAS DELIVERED 3 PARABOLIC CYCLES.
2026? SAME SETUP — MOVE NOT DONE YET.
EVERY CYCLE LOOKED BROKEN BEFORE IT EXPLODED.
ABOVE $74K → PARABOLIC PHASE BEGINS.
BELOW $65K → MORE CONSOLIDATION.
THE FINAL LEG IS STILL AHEAD 🚀
English
@MerlijnTrader Weekly RSI can take YEARS to play out.
This is a LAGGING indicator. It shows where price has gone not where it’s going.
It is also a momentum indicator. It shows momentum, not future predictions.
Stop using price indicators on something built on time.
English
BITCOIN WEEKLY RSI IS OVERSOLD FOR THE FOURTH TIME IN HISTORY.
2019: oversold. Then 2,700% rally.
2020: oversold. Then 1,800% rally.
2022: oversold. Then 350% rally.
2026: oversold. Right now.
Hold $65K: wave 4 complete. Wave 5 to $140K begins. Lose it: oversold gets more oversold first.
Every previous signal paid.
This one is loading.
English
@MerlijnTrader Show me 1 time BTC has evolved beyond the halving pattern in the last 10 years sir
English
@BitcoinxDaily Market cycles often evolve beyond the standard halving patterns 📈
English
FOUR BITCOIN CYCLES. THREE PARABOLIC MOVES. ONE MISSING.
2012: parabolic. 2016: parabolic. 2020: parabolic.
2026: same setup. No parabolic move yet.
Every previous cycle looked broken before the parabolic move appeared.
Above $74K: arrow begins.
Below $65K: consolidation extends.
The move always comes.
It just hasn't come yet.
English
This is WRONG bro why put out misinformation?
How about you confirm for yourself instead of copy and pasting wrong information?
Each bear market took 364 days on average from top to bottom. We aren’t even half way.
Stop making yourself look stupid. Reporting you for this brain rot
English


Because I don’t bullshit post non sense just because that’s what people wanna hear.
I don’t copy and paste every other CT moron, I don’t repost the same brain rot over and over again.
312k followers on IG
31k subs on YT
Who tf are you bro 😂
Brain rot anons think they’re doing something
English

mfs posting on X with zero engagement and 0 likes, no shame.

English
@Bitcoin_Teddy Stop lying to the people. Bullshit like this is why retail continues to lose money. Post like this are literally eradicating retail investors then you wonder how institutions got control of all the bitcoin

English
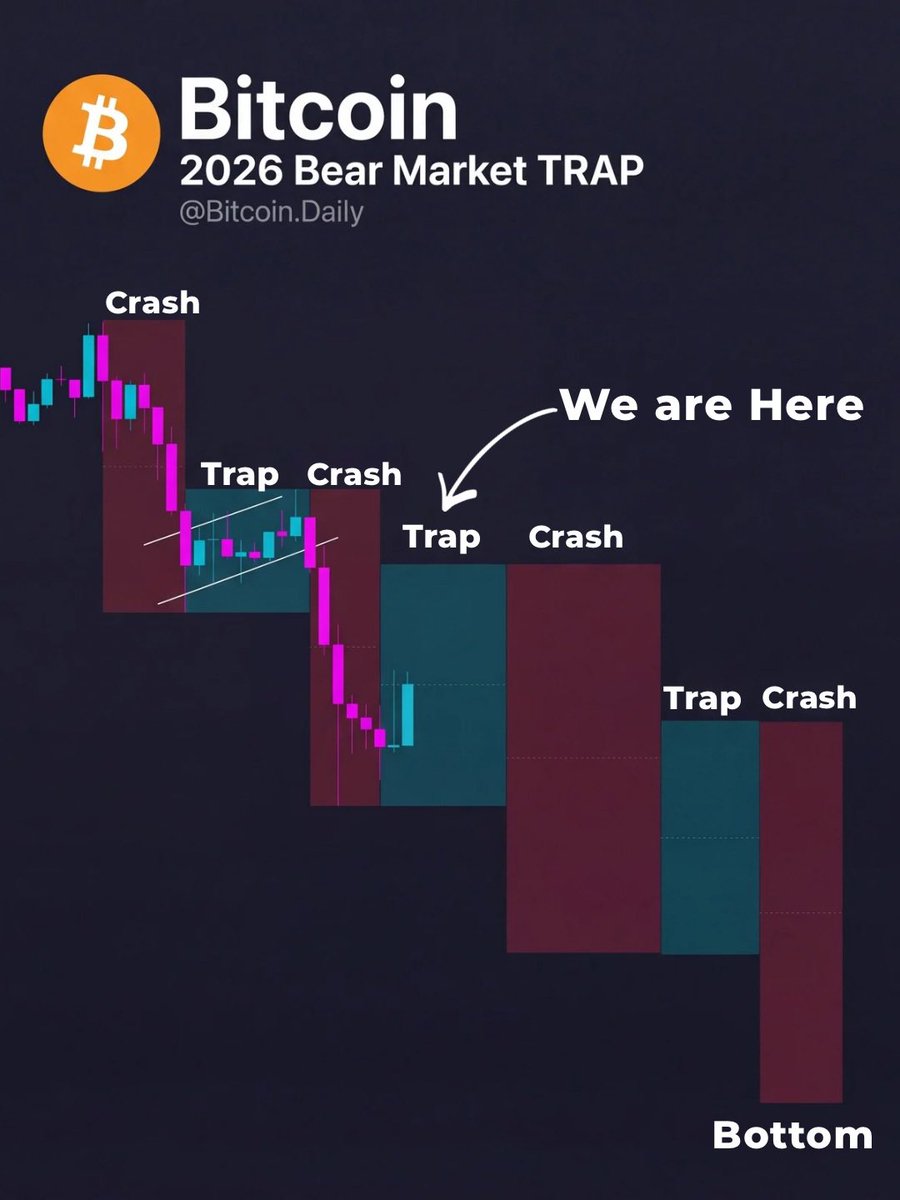
THE BIGGEST BEAR TRAP OF THIS CYCLE!!
They did it in 2017, 2021… and now in 2025.
Every major bull run had a final bear trap before sending it.
You’re either getting shaken out or positioned for the biggest move yet. Your choice.

English
Bitcoin on Day 157 of
Every Bear Market.
2014: -64%
2018: -62%
2022: -42%
2026: -44%
Here is what history says happens next.
2014 Bear Market:
Peak: $1,150 (Nov 2013)
Day 157: -64%
Bear Market Duration: 411 days
Total Drawdown: -87%
2018 Bear Market:
Peak: $19,666 (Dec 2017)
Day 157: -62%
Bear Market Duration: 363 days
Total Drawdown: -84%
2022 Bear Market:
Peak: $69,000 (Nov 2021)
Day 157: -42%
Bear Market Duration: 364 days
Total Drawdown: -78%
Different crashes.
Different narratives.
Same clock.
2026 Bear Market (so far):
Peak: $126,000 (Oct 6, 2025)
Day 157: -44%
Total Drawdown: -52%
We're not even halfway through this Bear Market yet.
"But this time is different."
It always is.
2014: Mt. Gox collapse. 411 days. 2018: ICO bubble burst. 363 days. 2022: FTX implosion. 364 days. 2026: Tariff war, Iran War
Day 157.
Different stories. Same clock.
The drawdowns are compressing.
2014: -87%
2018: -84%
2022: -78%
2026: -47% so far
Every cycle, the crash gets smaller. Institutions compress the pain. They don't eliminate it.
The floor this time? Likely $40K–$50K.
The regression isn't complicated. People's feelings about it are.
Duration: ~363 days. Twice in a row. To the day.
Drawdowns: shrinking ~5% per cycle.
Structure: identical.
The model says what it says. Your timeline might disagree. The model won't.

English
@Bitcoin_Teddy @grok what is Raoul Pal track record on his public calls
English
Raoul Pal: "The 4-year cycle is now the 5-year cycle.. #Bitcoin should peak in 2026. Probably Q2."
English
@cryptofergani You need to spend another 10 years because obviously you’re new to bear markets

English
We are going to 10-20x from these prices
I bet my entire life, 10yrs worth of research & entire net worth on this moment
I’m warning you that life changing wealth is about to come
The market isn’t dead, people are just impatient.
Wealth flows from the impatient to the patient.
Understand that, and you beat 95% of investors.
You all deserve what’s about to happen.
I’ll share the alts I’m buying.
If you still haven’t followed me, you’ll regret it.
English
Again, you have no clue what inputs my model has.
Why would I create a model and leave out data? That makes zero sense.
All of that is accounted for. That’s why the bottom price is $50k and not $15k like last bear market.
Your mistake is you’re double counting the effect of ETF’s.
Men lie, women lie, numbers don’t lie.
I’ll check back in with you in a couple months when we hit $50k and ask you about ETF’s and Microstrategy again
English

Regression models are only as good as their inputs. Historical data can't capture the structural shift happening now.
Your model sees past cycles. But $15B ETF inflows in Q1, MicroStrategy's treasury strategy, and El Salvador stacking sats weren't in the 2014-2022 datasets.
Sometimes the model breaks.
English
@Mr_Wizkers the $50k to $40k floor is the model output when you run the regression model and you input all of that
English
The compressing drawdowns tell the real story. Every cycle the floor gets higher because there's a new class of buyer that didn't exist before. 2014 was retail. 2018 was funds. 2022 was corporations. 2026 is nation states and ETFs. The $40k-$50k floor call ignores that structural shift entirely.
English