Canada Stats Hub

3.4K posts

Canada Stats Hub banner
Canada Stats Hub

Canada Stats Hub

@CanadaStatHub

Free Android app with 37+ charts and expanding. These are my opinions only and are not Financial or Investment advice. Consult an investment professional.

Cambridge, Ontario 가입일 Mart 2024
188 팔로잉713 팔로워
고정된 트윗
Canada Stats Hub
Canada Stats Hub@CanadaStatHub·
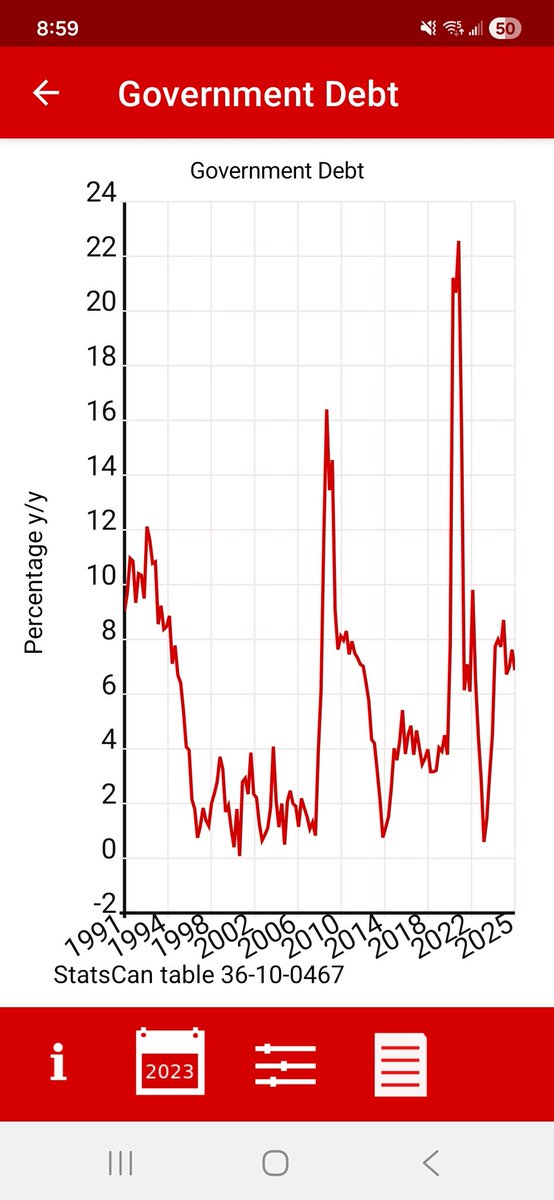
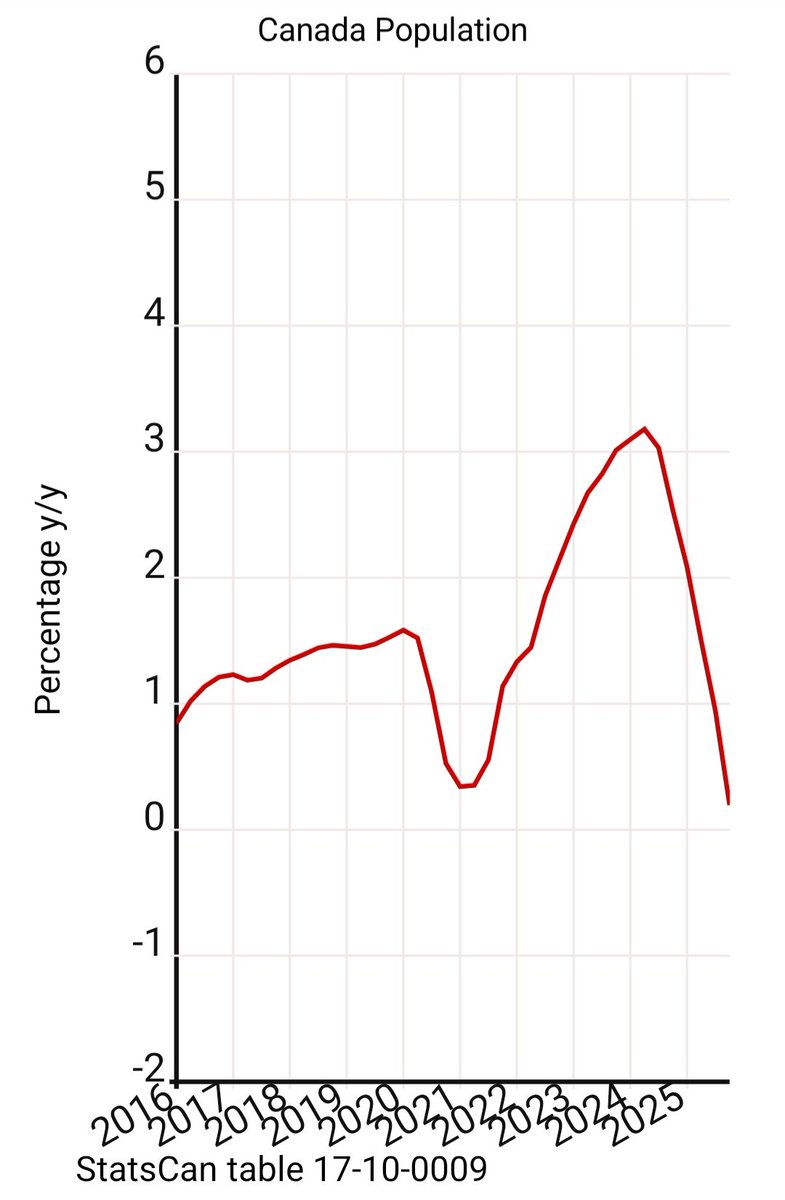
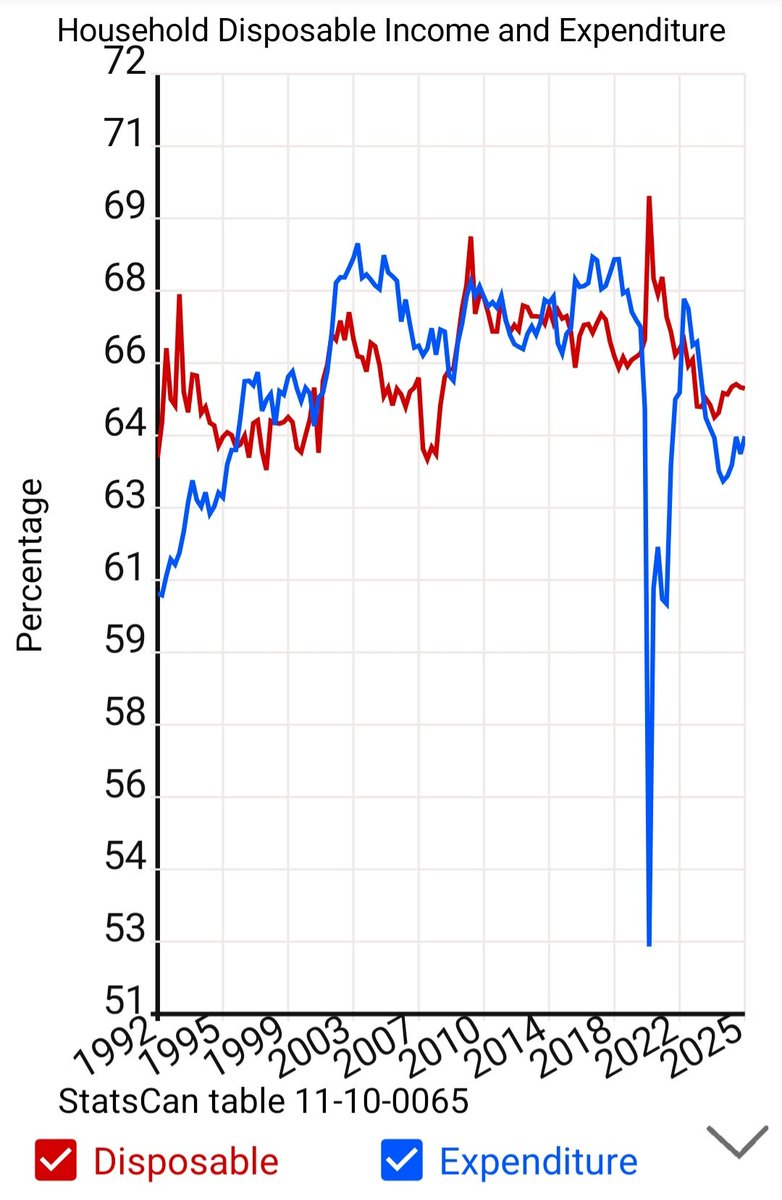
Version 1.1.5 of Canada Stats Hub for Android is now available! More than one hundred charts and the ability to create your own. You can now download data directly from StatsCan. Install now! See link and instructions in the comments ->>>
Canada Stats Hub tweet media
English
2
2
4
2.1K
Canada Stats Hub
Canada Stats Hub@CanadaStatHub·
The aggregate margin debt balance has fallen last month (FINRA data). That is a big deal since it was growing fast since April. The exact same thing happened last year, but the debt is 36% higher now. Hug your portfolios?? 🫣
Canada Stats Hub tweet mediaCanada Stats Hub tweet media
English
0
0
1
78
Canada Stats Hub
Canada Stats Hub@CanadaStatHub·
@igetredpilled Speaking of leading indicators, this is the 1 year trend on "cheap gas" searches. It has reached last year's trade debacle levels.
Canada Stats Hub tweet media
English
0
0
0
41
Canada Stats Hub
Canada Stats Hub@CanadaStatHub·
StatsCan just released the January building investment data. It is down 1.9% in January, but still positive YoY. This is one of the most critical cyclical data points to watch this year. If this goes negative YoY, it will be hard to avoid a technical recession.
Canada Stats Hub tweet media
English
0
2
11
2.1K
Canada Stats Hub
Canada Stats Hub@CanadaStatHub·
I forgot to post this one: gross general government debt (federal+provincial+region/cities) has increased 6.8% YoY. This is the 5th highest ever. Only behind 2024, the pandemic, the GFC and the 90s debt crisis. We desperately need some cost control...
Canada Stats Hub tweet media
English
1
2
3
126
Canada Stats Hub
Canada Stats Hub@CanadaStatHub·
@YVRREWatcher I don't have any charts on this yet, but my best guess is > 140k. Here is something that is published by StatsCan. It looks like the top 20% has 80% of the savings. The next quintile has 20% of the savings and the remaining 60% doesn't have any saving.
Canada Stats Hub tweet media
English
1
0
1
10
LMAO MDG
LMAO MDG@YVRREWatcher·
@CanadaStatHub Based on your stats what constitutes the top 20% HHI of earners nowadays?
English
1
0
1
52
Canada Stats Hub
Canada Stats Hub@CanadaStatHub·
StatsCan released the household income data yesterday. Canadians are keeping their wallets shut: household disposable income grew, but expenditure didn't follow. This only happened to this extent in the early 90s during the housing crisis. Check the full chart in the comments.
Canada Stats Hub tweet media
English
2
0
7
839
Canada Stats Hub
Canada Stats Hub@CanadaStatHub·
@csw20011 Interesting. Since that chart is for migration only, it would imply that births exceed deaths by 60k or more over 4 quarters to generate overall growth.
Canada Stats Hub tweet media
English
0
0
1
14
Canada Stats Hub
Canada Stats Hub@CanadaStatHub·
Breaking! 🚨 Canada's population growth is now negative YoY for the first time on record. The provincial breakdown shows that most large provinces populations shrunk. Alberta is still growing but at a slower pace.
Canada Stats Hub tweet media
English
3
3
5
341
Canada Stats Hub
Canada Stats Hub@CanadaStatHub·
2/2 Smaller population provinces are still growing, but at a slower rate. I wonder if ON and BC housing migration is still keeping them above zero. These two provinces lost the most people.
Canada Stats Hub tweet media
English
0
0
3
41
Canada Stats Hub
Canada Stats Hub@CanadaStatHub·
2/2 I am no economist, but that coukd cause a technical recession in Q4/Q1 considering our small productivity growth in the last decade.
Canada Stats Hub tweet media
English
0
0
0
37
Canada Stats Hub
Canada Stats Hub@CanadaStatHub·
Breaking! 🚨 StatsCan just released the Q1 population estimates. Population reduced for two consecutive quarters now. It is down 103k people in Q1 and 102k people over 4 quarters. That makes a -0.2% YoY.
Canada Stats Hub tweet media
English
2
2
8
322
Canada Stats Hub
Canada Stats Hub@CanadaStatHub·
@GuruOfMen It doesn't seem to be the case. Remittances only grew from 6 billion to 8 billion and that is pretty close to the CPI/wages rates. I think it is households being cautious. You can see that over 35 years of purse tightening or loosening.
Canada Stats Hub tweet media
English
0
0
1
16
Man Guru
Man Guru@GuruOfMen·
@CanadaStatHub Weird is this total disposable income across the country? Odd metric. All the new disposable income is going back to the home country. Check out foreign remittances lmao
English
1
0
0
13
Canada Stats Hub
Canada Stats Hub@CanadaStatHub·
@PHfloor If you look at the last 35 years worth of data, you will see that it matches the early 90s housing crisis and this has not repeated since then. Maybe high unemployment, stagnated retail sales and falling RE prices are just a huge 90s coincidence too. 🚀🚀
Canada Stats Hub tweet media
English
1
0
2
66
Pierre
Pierre@PHfloor·
Household saving rate up and a good chuck of home owning Canadians will be paying a higher portion of their incomes to interest rates this year 😱 This economy is going down peeps. 😉
Pierre tweet media
Canada Stats Hub@CanadaStatHub

StatsCan released the household income data yesterday. Canadians are keeping their wallets shut: household disposable income grew, but expenditure didn't follow. This only happened to this extent in the early 90s during the housing crisis. Check the full chart in the comments.

English
1
0
5
611
Canada Stats Hub
Canada Stats Hub@CanadaStatHub·
2/2 I should say: it is Q1 2026 population estimates, not Q4 2025.
English
0
0
0
38
Canada Stats Hub
Canada Stats Hub@CanadaStatHub·
Regardless of the print,Twiter will be lit tomorrow when Canada Q4 population estimates are released (that is always the case). Here goes my "guestimate": -0.2% in Q4 and -0.1% YoY.
Canada Stats Hub tweet media
English
2
0
2
195
Canada Stats Hub
Canada Stats Hub@CanadaStatHub·
Here is a chart with the household disposable income & expenditure as a percentage of total income. It is now behaving just like in the 90s housing crisis, when expenditure was significantly below disposable income. Don't expect the economy to improve if this is not reversed.
Canada Stats Hub tweet media
English
1
0
3
115
Canada Stats Hub
Canada Stats Hub@CanadaStatHub·
@Tiramisu7667 I don't have that series in the app (yet), but I have this: cpi+population YoY vs Disposable income YoY. Hard times are marked by the two lines approaching or touching each other. We are not there yet, but going in that direction (if things don't improve fast).
Canada Stats Hub tweet media
English
0
0
0
11
Canada Stats Hub
Canada Stats Hub@CanadaStatHub·
New Q4 household nominal income YoY growth confirms that the economy is losing steam fast, but it is not at crisis level (93, 2001 and 2009). The 2.8% print is very low because it includes salaries, investments, rents, government programs and inflation. Good times run at 4.5%+.
Canada Stats Hub tweet media
English
1
0
2
104