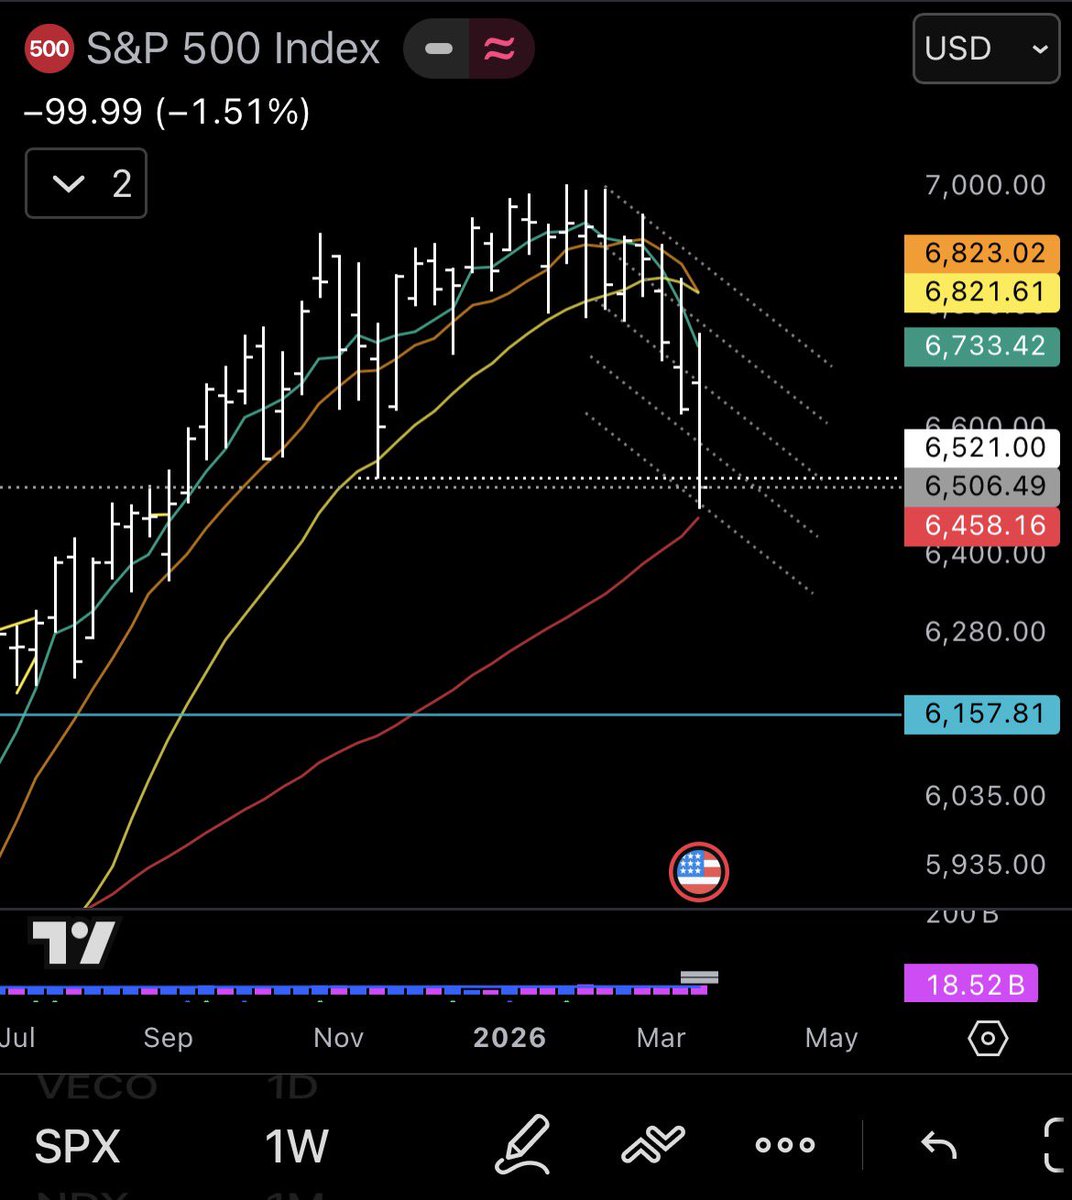
Sabitlenmiş Tweet

I will add here in the comments the posts with “Elliott Wave Markings”, where blood really fills my eyes. Nothing personal 🤗
#elliottwave
English
AlphaScout360
2.8K posts

@AlphaScout360
A self-proclaimed market oracle


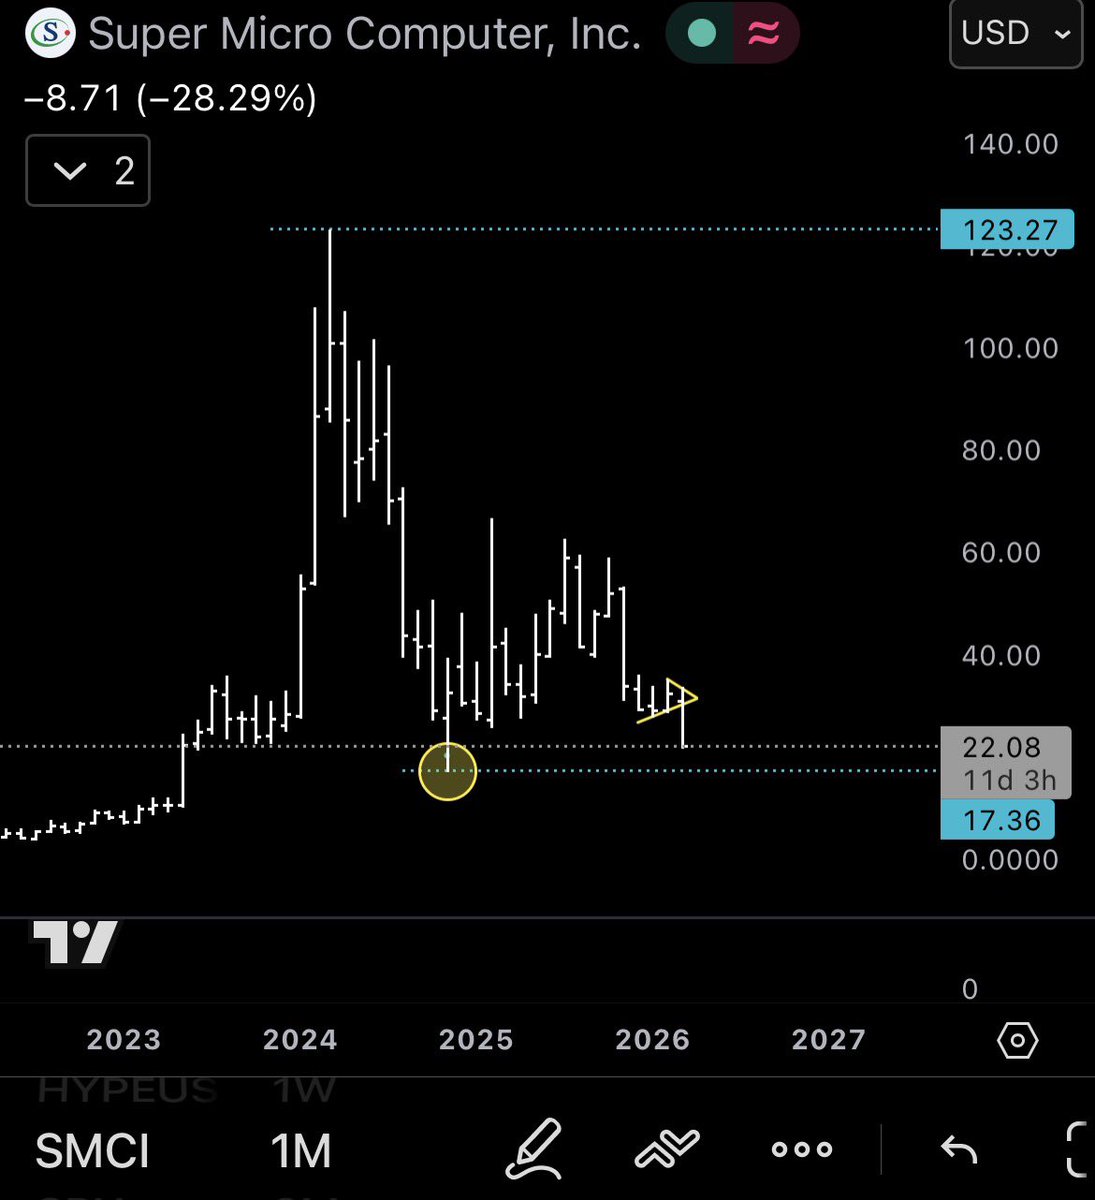
$SMCI - not an investment advice. But looks like we got an exhaustion gap.


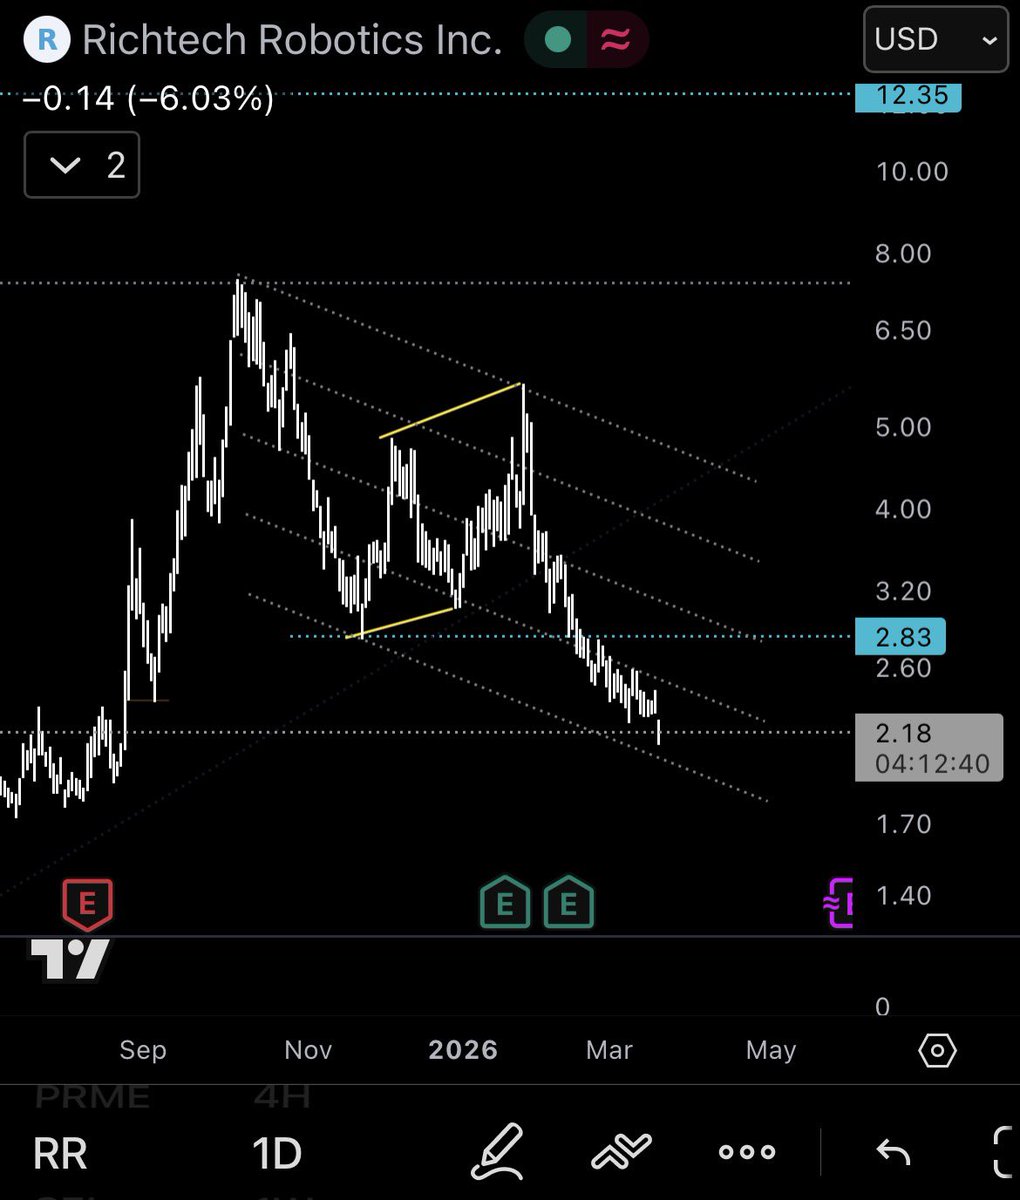

The only idea I have at the moment - on the linear chart - with an expanding diagonal and the three waves pullback. 78,6% Fibo at ~$1,75 $RR weekly: