
Evgenii
268 posts

@optionflys And if one digs into 30m timeframe, it becomes more and more visible
English

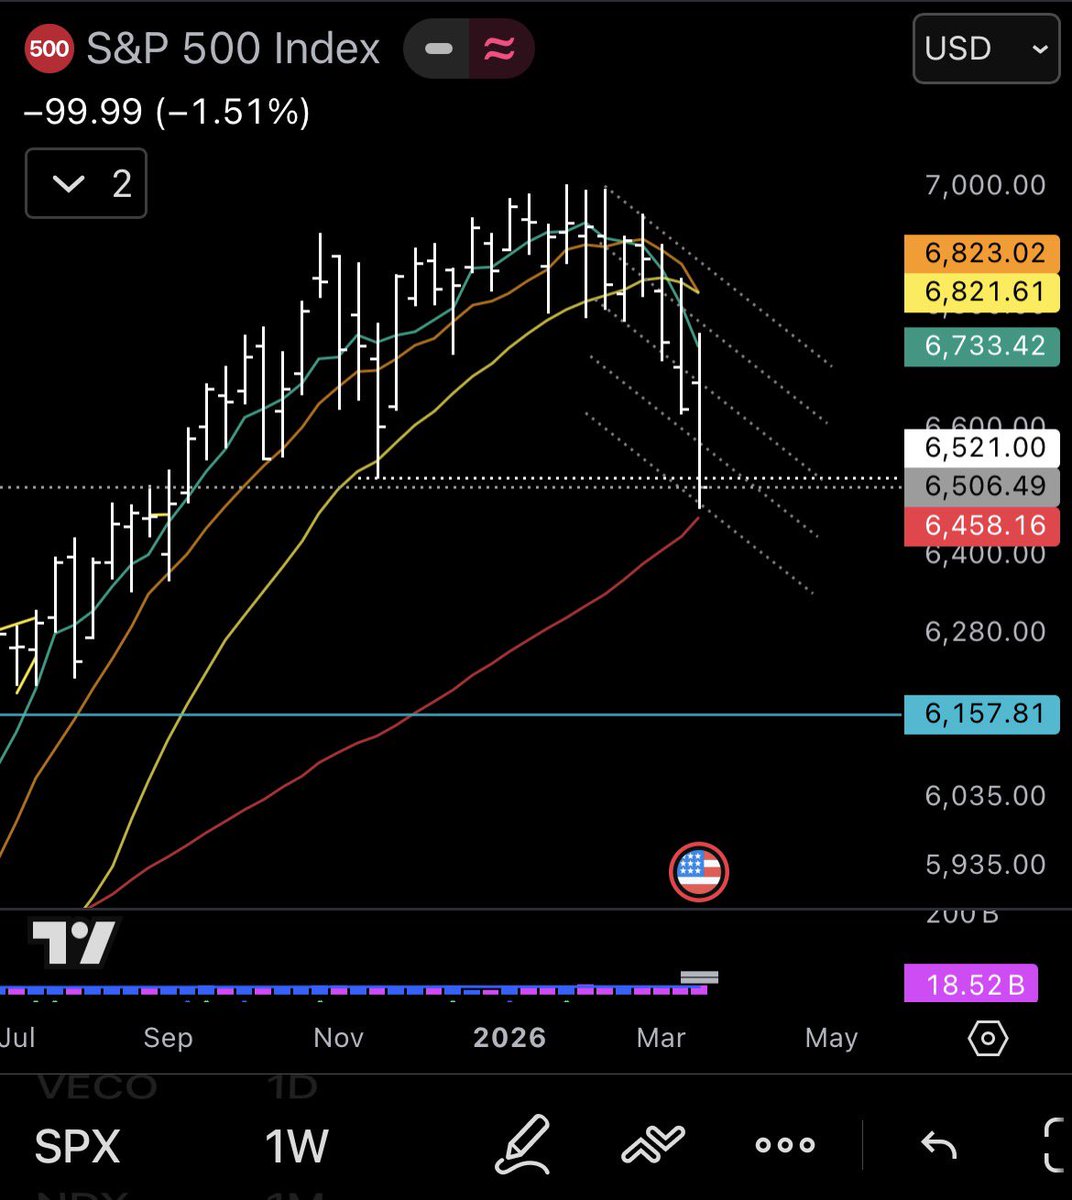
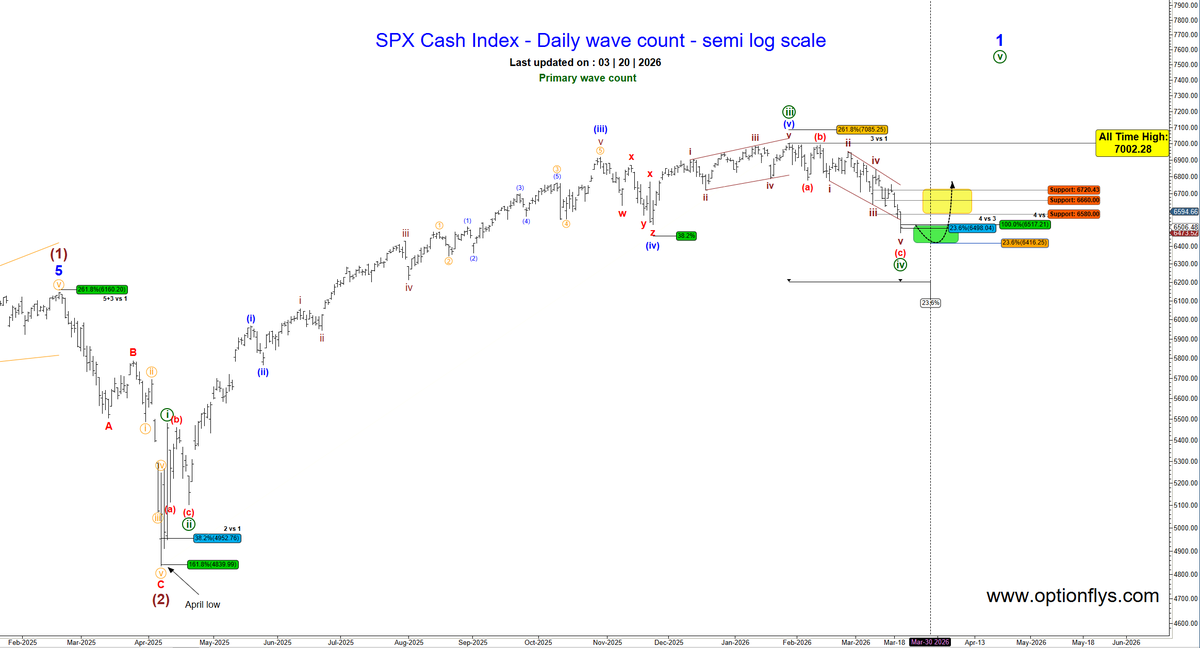
$SPX update - nothing random here.
Back on Jan 14, the roadmap was clear:
Wave iii → exhaustion
Wave iv → corrective phase
Fast forward - we now have a clean 3-wave move lower and price has pushed into the projected support zone.
This is exactly how sequence plays out.
Current move: ~–7.5% (wave iv)
April low move: ~–6.9% (wave ii)
Same behavior. Different time.
Now price is testing the typical wave iv retracement zone (4 vs 3 / 4 vs 2 relationships).
This is where reactions happen.
Hold → bounce + base building
Lose it → next extension lower into deeper fib levels
Wave iv can take time — that’s normal.
But if price extends too far, the count gets reassessed.
No opinions. Just structure doing the work.
This has been the most accurate wave count since the April low — to the penny.
We’ll circle back over the next couple weeks and month and let the structure confirm how this unfolds.
Previous roadmap from Jan 14 below 👇
x.com/optionflys/sta…
April 4 → June 18 👇
x.com/optionflys/sta…
August 8th 👇
x.com/optionflys/sta…
$SPY $QQQ
English
@optionflys Structure is important, agreed. Thanks for your view still I mean it is more complicated and five wave structure is only in the last move.
English
@Tintincapital The bad thing is that you have no decent conviction when just following someone’s words. At some points of time when markets shake, in choppy manner for quite some time with ups and downs, one might lose their belief and quit. So better to stick to your own view imo.
English
@Tintincapital Looks like a fear across the twitter is quite high. I can understand. I believe sp500 will do choppy price action for some time and make new ATH before substantially declining (similar to April tariffs crash).
Short-term, I see that we go higher 4-6%, the correction, the ATH.
English
@AlphaScout360 In such a complex correction (RS) triangle might be the ending pattern. I like the chart. Thank you :)

English
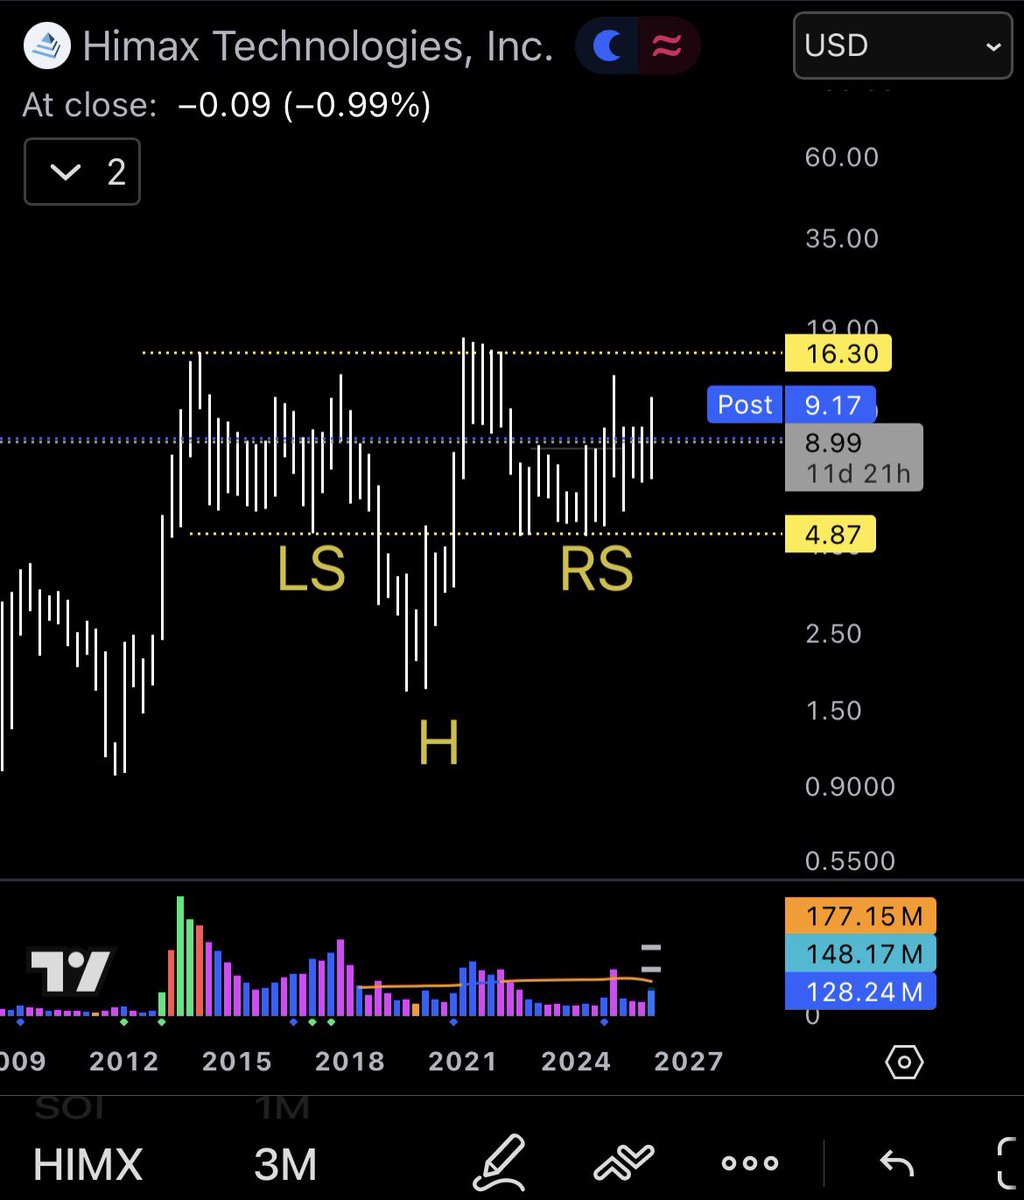
$HIMX - just imagine its potential when it breaks out. Linear scale min target is ~$30, bit I find it rather conservative
English
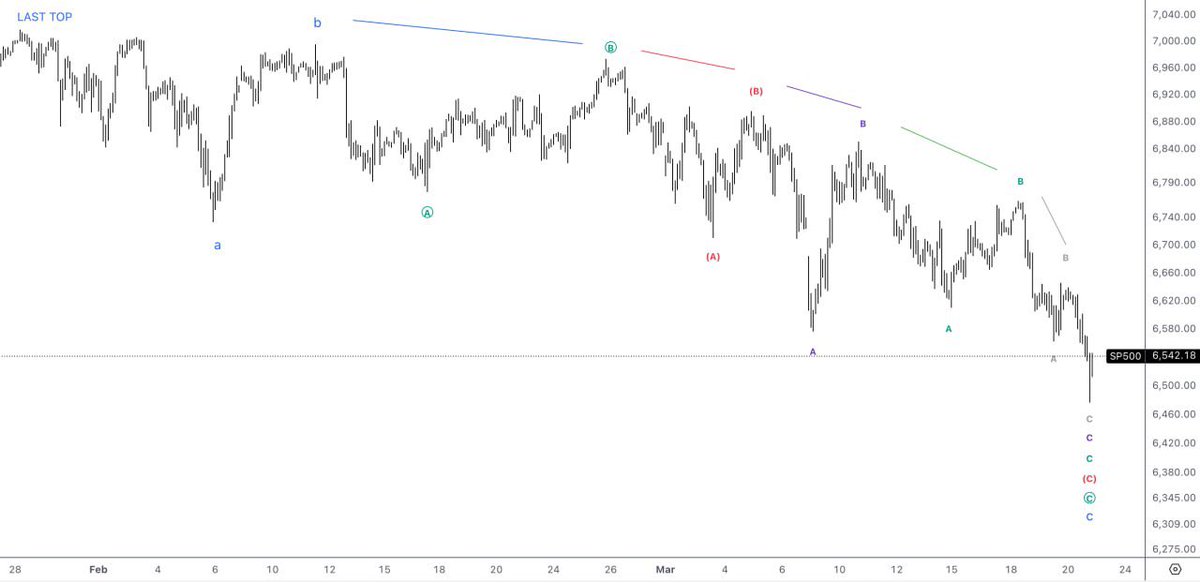
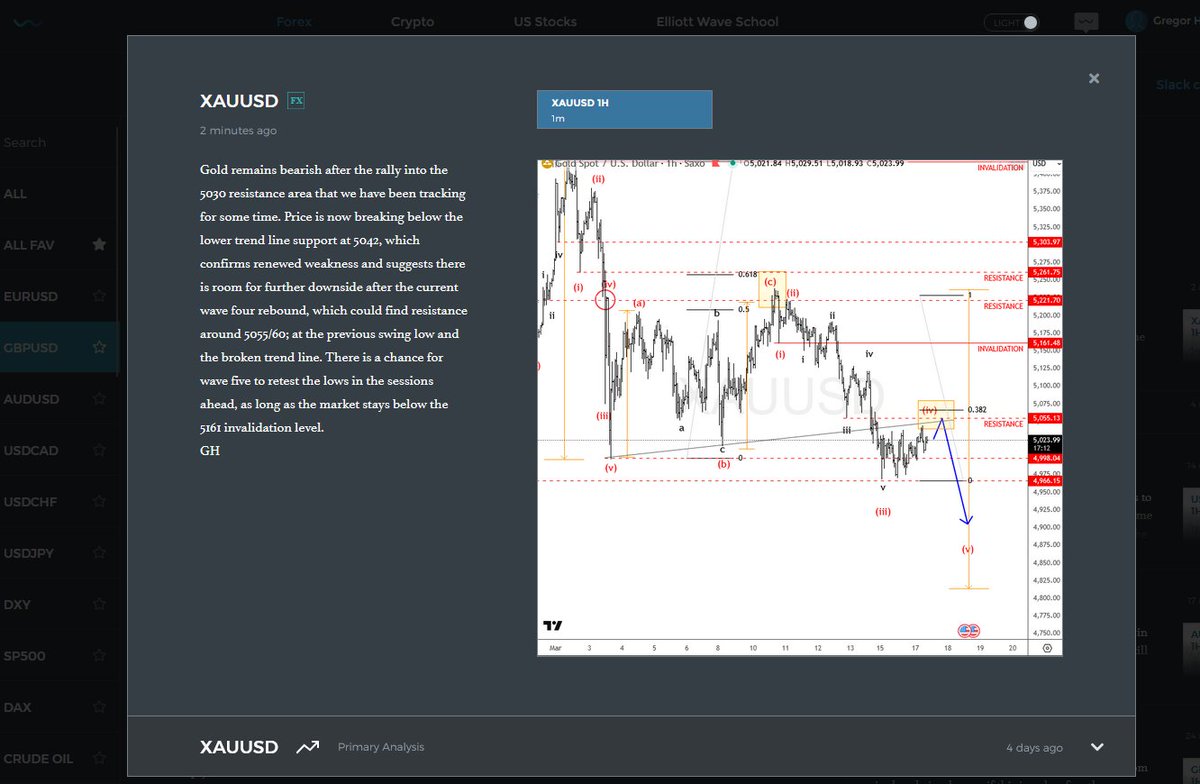
@GregaHorvatFX Adding to my prev comment, the first sharp decline down at the beginning of March is an ABC again with wave A as a zigzag and B as your (ii). What do you think?
English

English
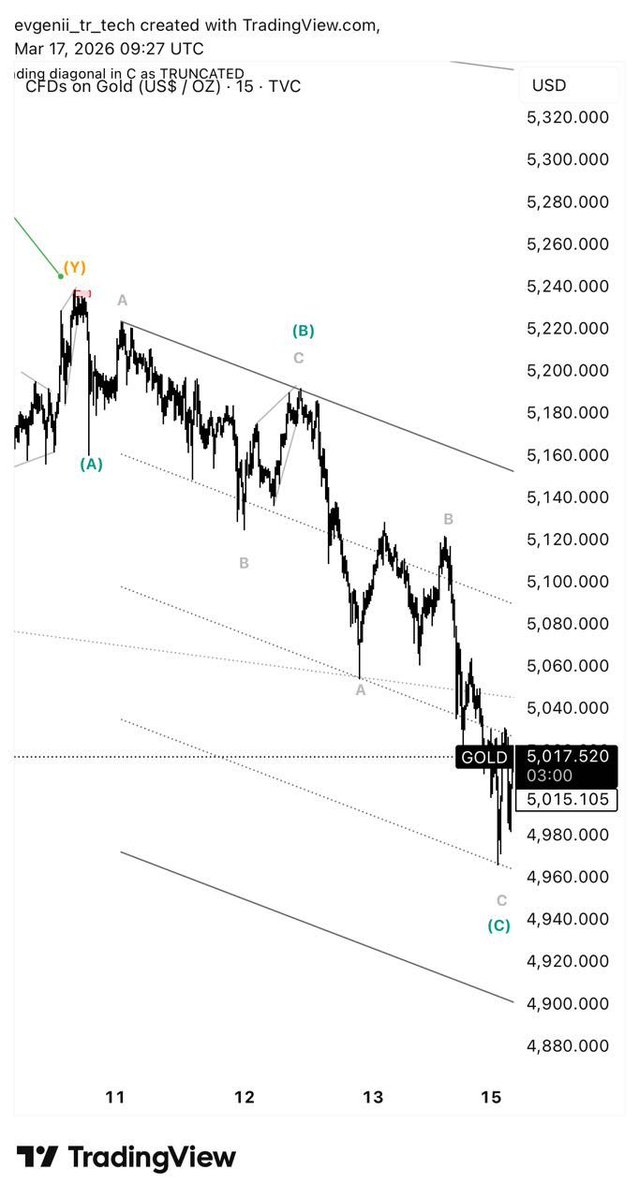
@GregaHorvatFX Sry for the quality, mobile interface - but just to have an alternative for your judgement
English
@GregaHorvatFX Hey have you looked using 30m and 15m just to ensure you’re dealing with an impulsive decline? I can see ABC development in place of where your (i)-(ii)-(iii) since March 11 are. What do you think?
English

@cantonmeow You can put the I - II before as we know the previous data before 2014 showed lower price action. It's missing on the plot in this chart but it's present on other historical data :)
English

It's been risk-off and a prolonged bear market for the stock market and cryptocurrency market against gold since Q4 2021.
These are facts.
Wealth is also built during bear markets.

English
@ElliottWavesHub @cdchester No possibility that it is not wave 5 since 2009?
English

@cdchester Multiple ways to interpret the impulse from 2009, Regardless of how we count, We cannot deny the fact that the entire bull from 2009 is a 5th wave and if it has ended or whenever it'll end there must begin the most devastating bear market of all times.
English
Armageddon Update:
S&P has tapped the generational trendline shared 4 years ago. The 150 year long bull run might have ended or is extremely near it's culmination. If that's the case then we can expect the most devastating and longer lasting bear market in the history of mankind.

Hamza@ElliottWavesHub
1/ Get Prepared for Financial Armageddon: EW analysis on 150 year old chart of S&P500. Wave 2 being a sharp correction caused by (The Great Depression), Wave 4 was a flat correction which includes both (The Dotcom bubble 2001 and the housing bubble 2008).
English
@Gyans04 @realroseceline Just because of higher fees FICO charges on the one hand and cost saving narrative that might appear across the industry due to inflation raising risks (sustainable oil elevated prices scenario) on the other hand
English

@realroseceline VantageScore has been around since 2006. It has been free for 20 years and has taken minimal share from FICO. It has been removed by FICO as the middle man with its DTC pricing so VantageScore went from free to $4.50. If it didn't win market share at $0 why would It win now?
English

Thoughts on $FICO
For a long time $FICO has been one of the toll booths of the financial system. Almost every consumer loan involves the $FICO score in some way. Banks rely on it, mortgage underwriting literally depends on it, and rating agencies use it when evaluating buying or selling securities. When something becomes embedded in the system, it stops being a product and starts being like permanent infrastructure.
Infrastructure businesses tend to be extremely profitable, and $FICO is a perfect example. Last year it generated roughly $2b in revenue and $769m in free cash flow (wow), with operating margins near 90% for its scores segment. Profitability like that usually exists only when competition is very limited or perhaps nonexistent.
For decades that was essentially the case. $FICO built the scoring model used across the credit system, but it does not actually own the data. The credit bureaus, Equifax, Experian and TransUnion collect the data and run the model inside their own databases. $FICO operates on top of that ecosystem, which worked smoothly for many years.
They had enormous pricing power. For almost 30 years lenders paid around $0.50 per credit score. Starting around 2018 the price began increasing quickly. Today a mortgage score costs $5, a 10 fold increase, and $FICO also introduced a secondary pricing model that charges a $33 fee per closed loan, a dramatic increase in a very short period of time. Just for the record, there are not a lot of businesses out there that can raise their prices 10 fold, that’s like See’s Candies on steroids.
When a company commands a dominant position it can raise prices for a long time without resistance. Eventually though, higher prices create incentives for alternatives to appear. In this case those alternatives are coming from the same companies data $FICO entire business actually depends, and it is creating quite the conundrum.
The credit bureaus jointly created VantageScore, which is positioned as a direct competitor. That creates an unusual dynamic where the companies distributing $FICO scores are also promoting a competing model. Oddly, sometimes they even bundle the two together.
The situation became more serious in 2025 when the Federal Housing Finance Agency approved VantageScore for mortgages backed by Fannie Mae and Freddie Mac. Because those agencies are at the center of the mortgage market, the decision immediately changed the conversation around the industry and $FICO stock began getting pressured.
None of this means $FICO disappears or is bad. Switching away from $FICO is difficult and unusual because humans are creatures of habit. Banks have decades of data and risk models are built around $FICO. Replacing the system would require recalibrating large parts of the entire credit ecosystem. That is a very wide moat, but that’s ultimately not where the money will be made or lost in the stock.
What matters more is the direction of travel. Some mortgage lenders are testing VantageScoremand regulators are encouraging more competition and transparency. It seems like Pulte has a personal vendetta against $FICO.
A subtle but important point is that $FICO does not control the most important asset in the system, the data. The credit bureaus own the raw credit information while $FICO provides the algorithm that interprets it. For decades that balance worked because the model was the industry standard. But when the owners of the data begin building their own models, the balance of power can shift. And, the competitive positioning can be more fragile.
There is also an irony here. $FICO became powerful because it became the standard in credit risk. Banks, regulators, and investors all learned to think in so called “FICO scores”. But once something becomes the language of an industry, people eventually start asking why one company controls the whole dictionary.
1/2 👇
English
@QualityInvest5 lol go check hated moats investor update and see risks he outlined and think again before screaming that some company is a buy; it feels to me that you do not go beyond simple multiplies and ratios or whatever you can dig up out of fiscal ai and do not work out risks properly
English

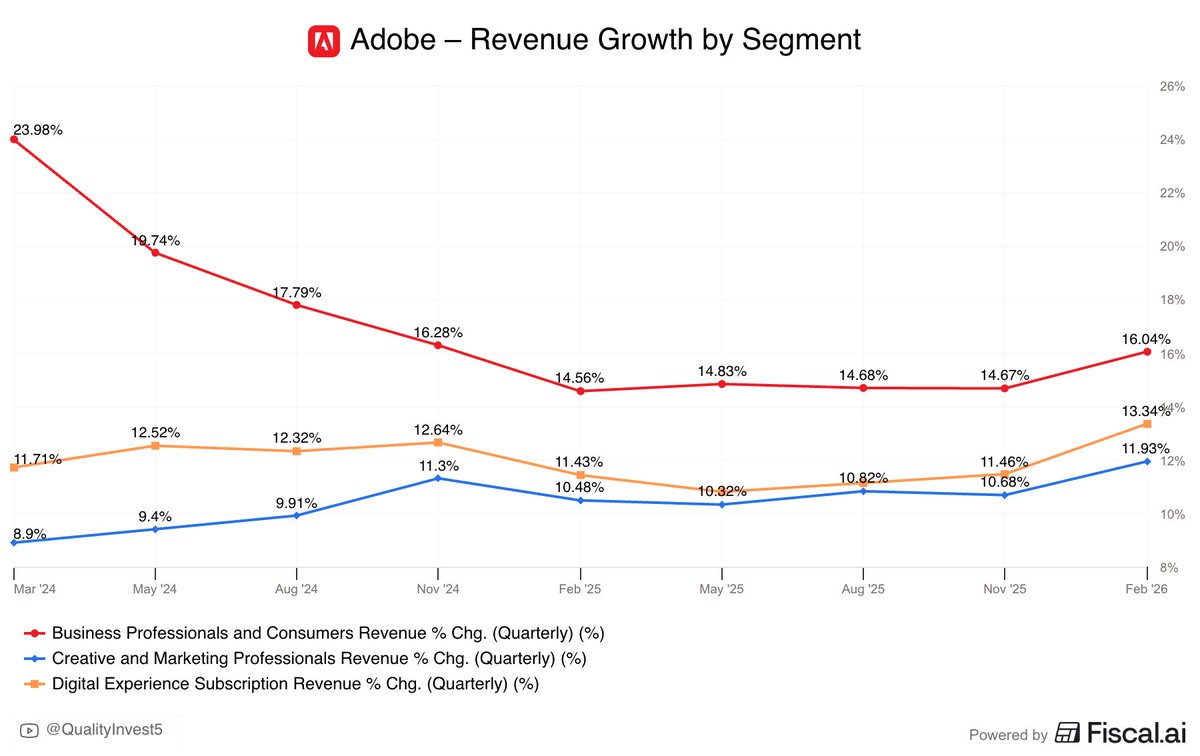
I actually don’t understand how anyone could possible be bearish on $ADBE at this point …
Today’s selloff is pure algo
Lee Roach@leevalueroach
The market dumped $ADBE 6% for beating on revenue, beating on EPS, and reaffirming guidance. Let me get this straight: 10.8x forward earnings. 12% FCF yield. AI ARR tripling. $22B in remaining performance obligations. Sell it because the CEO is retiring after 18 years? I'll take the other side of that trade all day.
English
@QualityInvest5 lol 1-2 quarters slightly up and you tell re-acceleration
English
PLEASE TELL ME, DO DYING COMPANIES RE-ACCELERATE REVENUE GROWTH??
$ADBE
English