Sabitlenmiş Tweet

Take a look at my work here: tabsoft.co/2I0vRQs
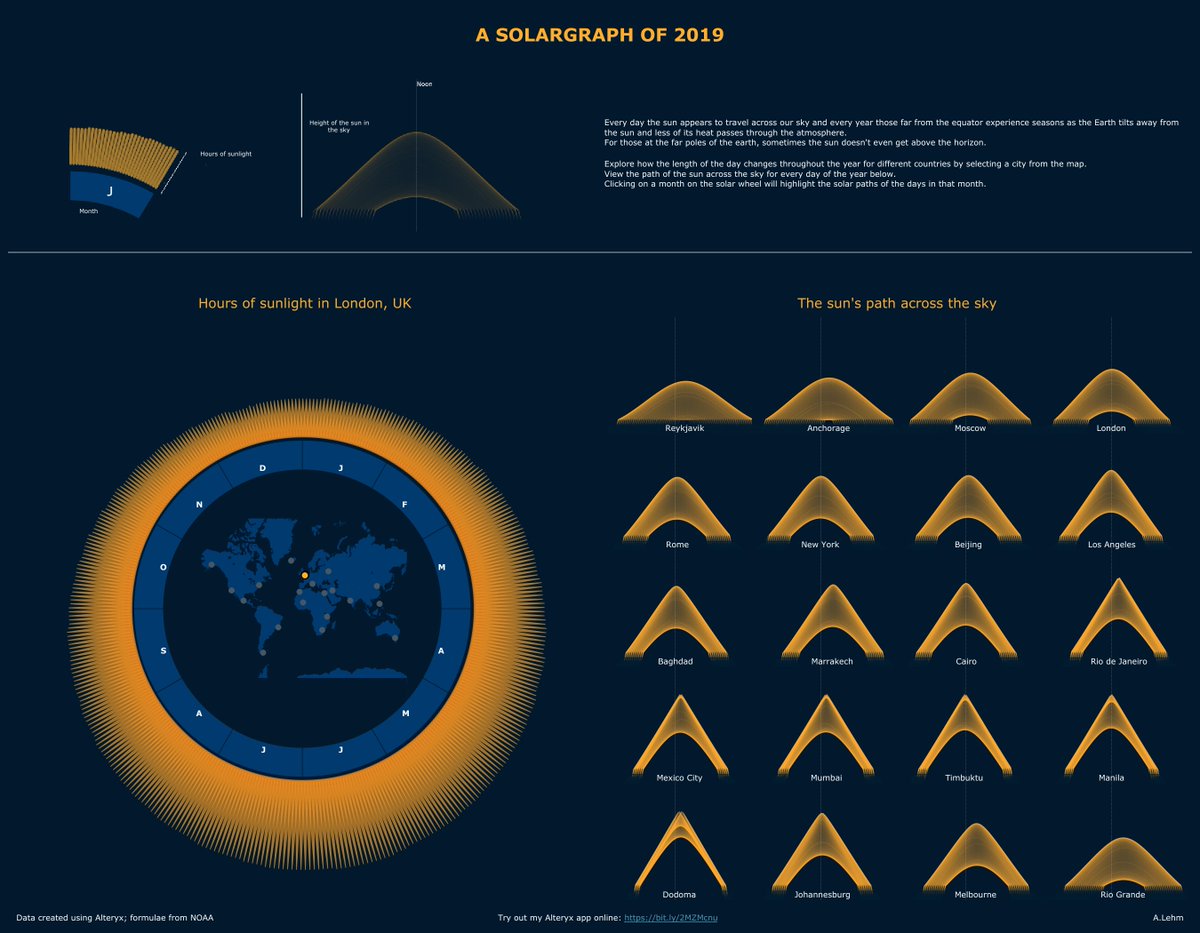
I turned the Alteryx workflow into an app that can be used to generate solar elevation, and sunrise and sunset times for a chosen location, which you can try here: bit.ly/2MZMcnu
@dataschooluk @VizWizBI @Datajedininja
English