The bacteria behind your bleeding gums was found in 9/10 Alzheimer’s brains.
P. gingivalis. Every time your gums BLEED, it enters your bloodstream. Then YOUR brain.
Researchers found its DNA in postmortem Alzheimer’s brains. They found its toxic enzymes destroying neurons.
Your dentist treats bleeding gums as a hygiene problem. It’s a brain problem.
Mastic gum KILLED P. gingivalis in published studies.
(PMID: 16822220)
A tree resin from Chios island. Chewed for 3,000 years. Kills the bacteria your toothpaste can’t reach.
→ killed P. gingivalis (Alzheimer’s-linked)
→ killed S. mutans (every cavity)
→ killed 90%+ of H. pylori strains
→ inhibited Candida
→ killed cancer cells in 6 lines
→ zero toxicity. zero resistance. ever.
Your gums bleed. Your breath comes back. Your brain pays the price 20 years later.
Mastic gum KILLED it.
I take Greco Gum’s Chios-certified mastic personally. Code ALFRED saves you 10%. Link below.
Everyone’s talking like Bitcoin is over.
I love it. We need more of this.
Tells us exactly where we are in the cycle. And no the cycle is not dead. The hope is dead. Which is what every cycle needs to reboot.
#Facts
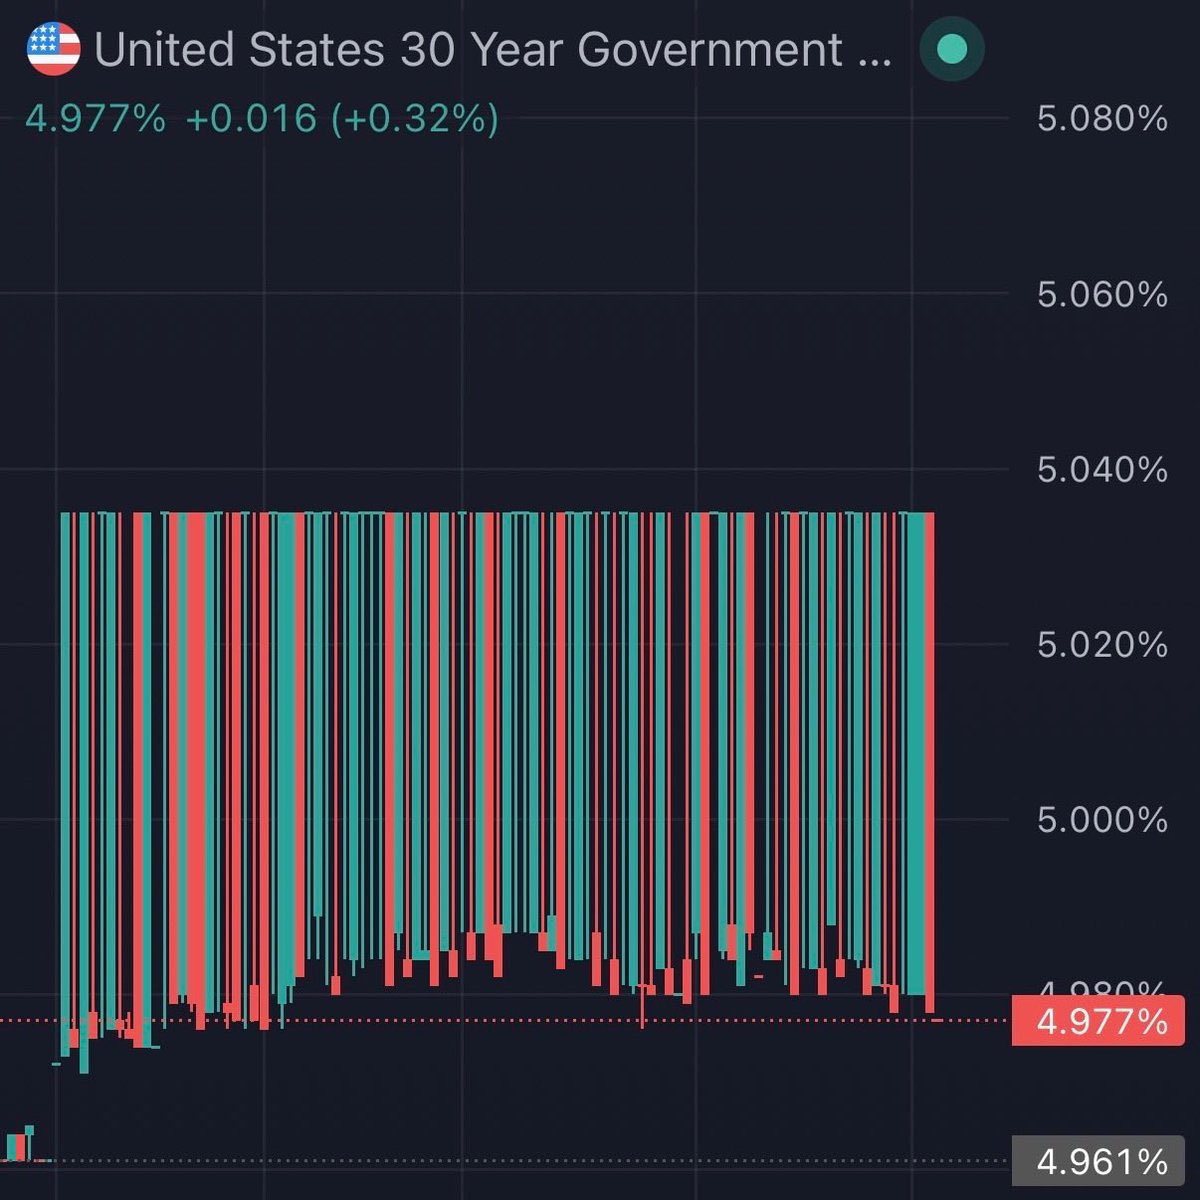
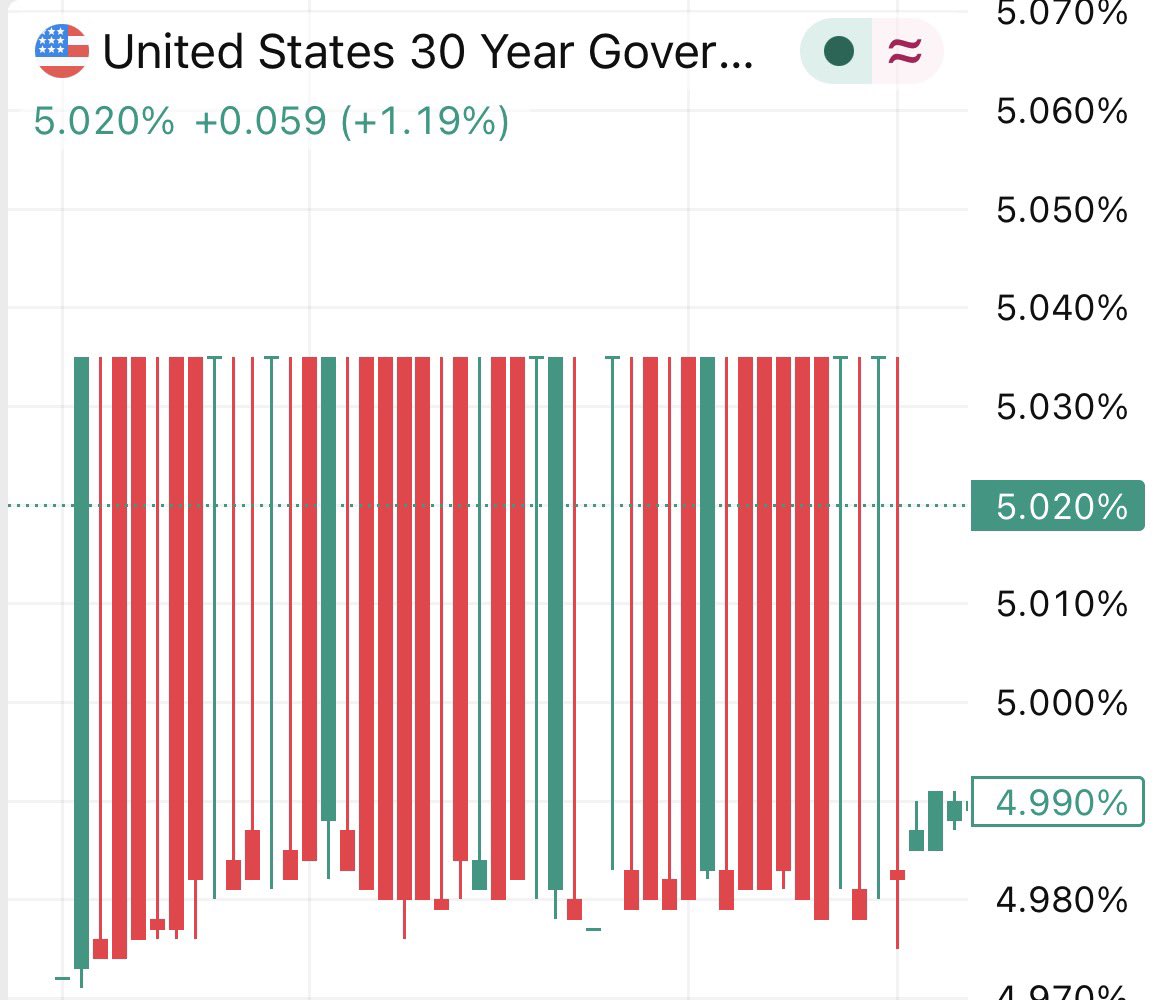
The 30yr US Treasury yield is doing something very strange right now and I think I know why.
Look at these candles.
This is not normal volatility.
Something is deeply wrong with the bond market right now.
Here's my honest take on what's happening:
I think China is dumping US Treasuries.
And the market doesn't have enough buyers to absorb it.
Here's why that matters:
When someone sells bonds normally, there are buyers on the other side ready to absorb the selling.
The price moves smoothly.
What you see in this chart is the opposite of smooth.
You see yields spiking and crashing violently within the same candle, over and over again.
That's what happens when a MASSIVE seller hits a market with no liquidity.
The order book is empty.
There aren't enough buyers.
So every sell order moves the price violently before someone steps in.
China holds nearly $700 billion in US Treasuries.
That's down from $1.3 trillion at its peak.
They've been quietly reducing for YEARS.
If they're now accelerating that exit, and they have every geopolitical reason to, this is exactly what it would look like on a chart.
Not a clean selloff, but a chaotic one.
The kind that breaks things.
I could be wrong about who the seller is.
But I'm not wrong that something very unusual is happening in the world's most important bond market.
And the stock market hasn't figured it out yet.
If you want to know where WE are deploying capital next, turn on post notifications this is VERY important.
Many people will wish they followed us sooner.
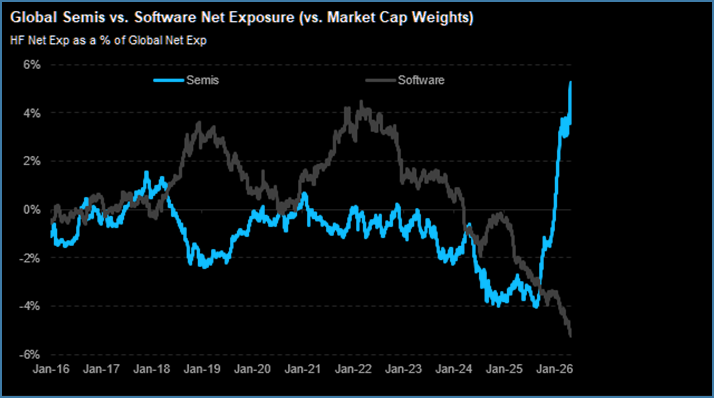
@realpristinecap So the ratio of semis to software is at the highest levels ever over the last ten years. Shouldn’t we expert mean reversion? Long software, short semis?
Or does strength beget strength?
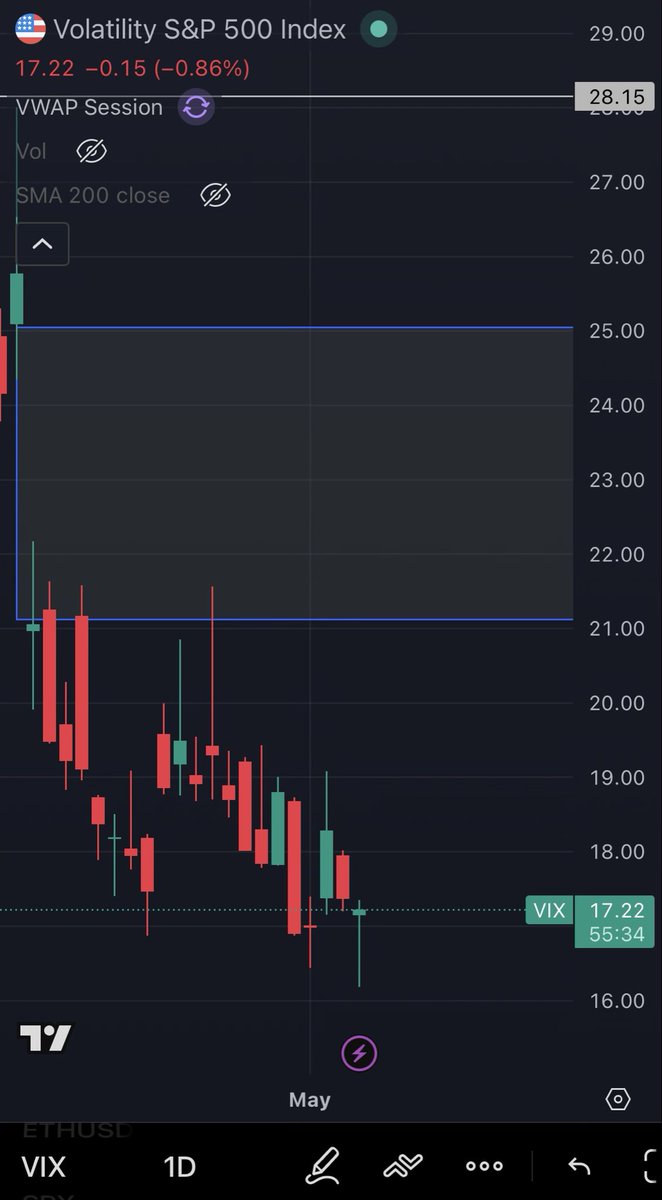
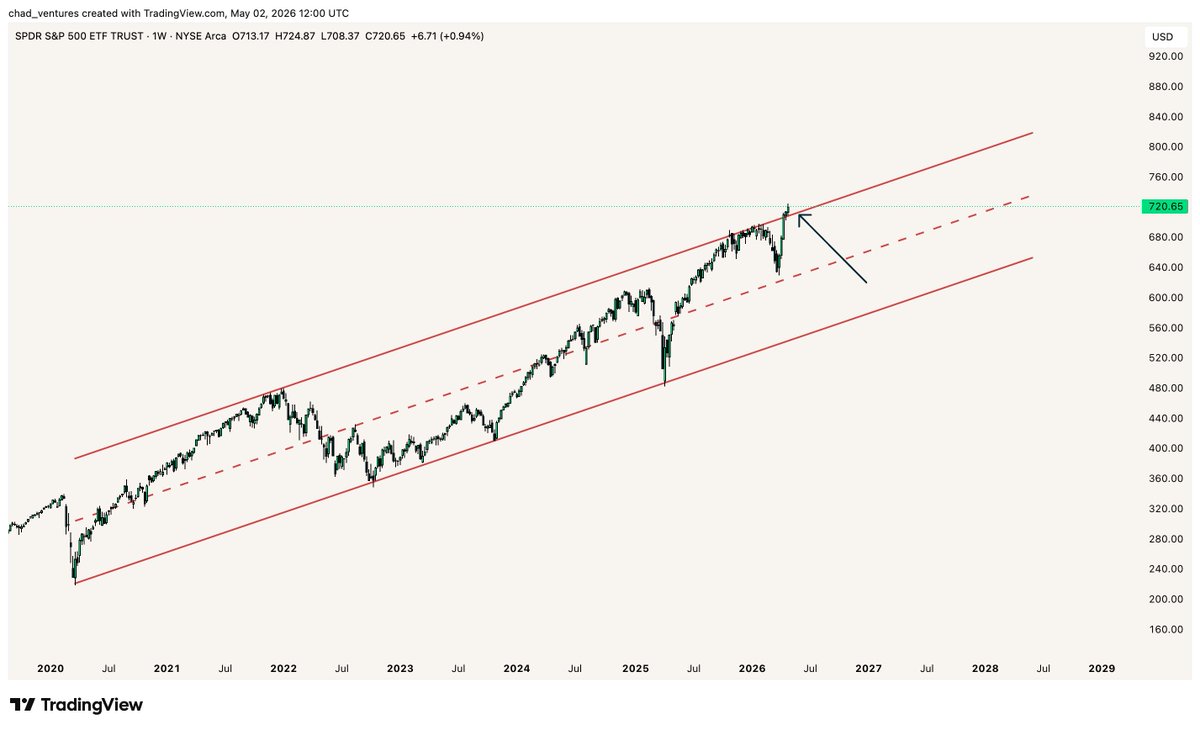
The S&P 500 triggered a rare technical event today, gapping above both its 50D and 200D moving averages simultaneously.
This looked weird to me, so I did some digging.
Since 1950, this specific signal has occurred only four times. In every instance, the index faced significant pullbacks shortly after. The average three month drawdown following the signal is -9.51%, with the worst three month drawdown reaching -12.92% during 2018.
Historically this has always been an exhaustion gap rather than a sustainable rally.
Maybe this time is different.
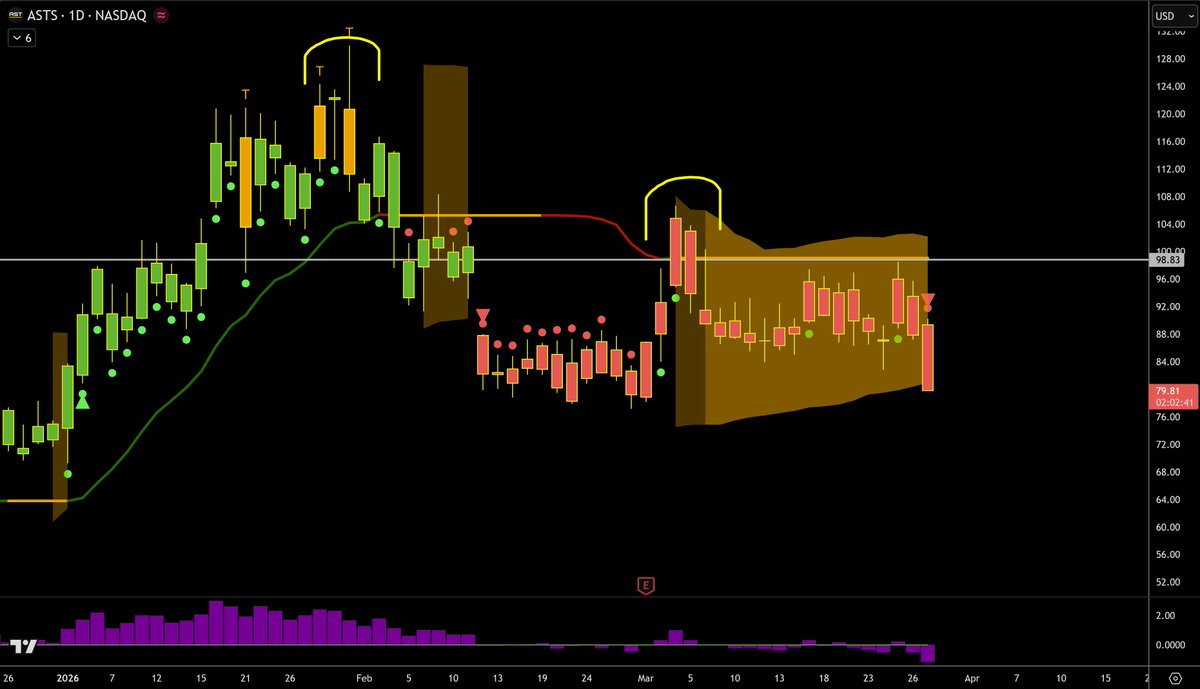
$ASTS
We have been short $ASTS since the topping signal.
Since then its made lower highs and now printing a red Breakdown arrow.
This is a high probability short setup. Anyone could have told that this was rolling over 💀
#NeverHoldStage4
@ChartingGuy I live in Trump country. Extremely devout supporters. I don’t know a single person who thinks Trump is doing a good job. Nor do I know anyone who likes high gas prices