Steve Miller@askslim
I was looking at this and did some research:
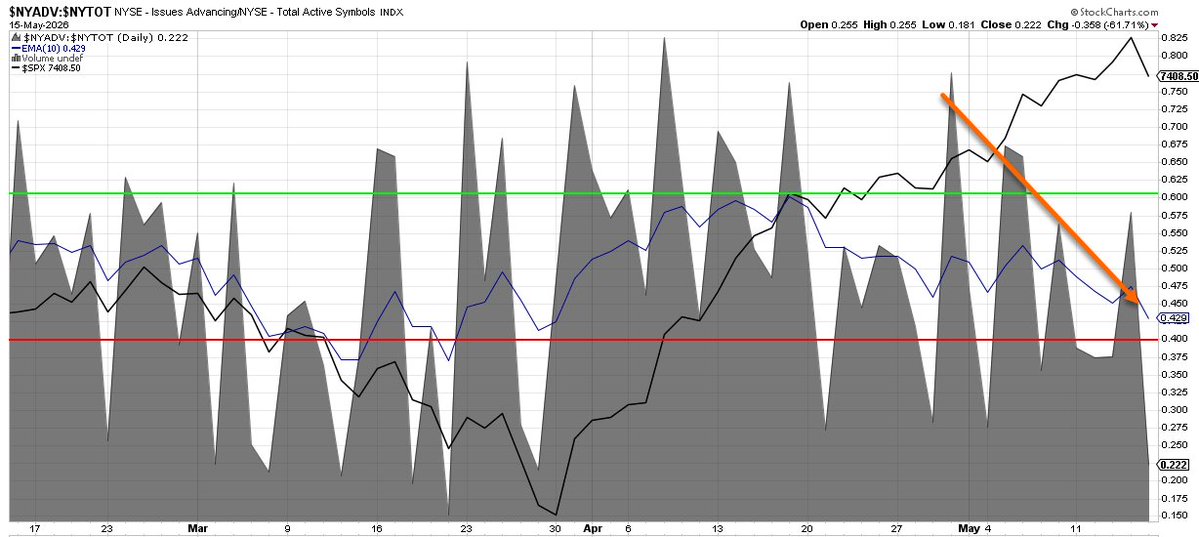
This highlights a severe, "split market" divergence where the S&P 500 hits all-time highs driven by mega-caps, while poor breadth (42.9% 10-day EMA) signals hidden weakness. This extreme setup suggests either a potential collapse due to lack of participation or the priming for a highly accurate bullish Zweig Breadth Thrust signal if buying returns to smaller stocks.
What Happened Historically? When this specific divergence occurs, history shows it almost always resolves in one of two ways:
1. The "Catch-Up" Rotation (Bullish Outcome)In this scenario, investors take profits from the few mega-cap stocks keeping the index at an ATH and rotate that capital into the beaten-down average stocks. This provides the necessary fuel to reset the indicator below 40% and then violently spark an actual, valid Zweig Breadth Thrust (ZBT) upward.Historical Examples: Early 2023 and Late 2024 saw periods where the S&P 500 hovered near highs primarily driven by a handful of tech stocks, while the rest of the market languished. Once the underlying stocks finally capitulated and bottomed out, a massive surge of liquidity rushed into the broader market. This triggered an official ZBT buy signal, which historically averages a massive +23% gain in the S&P 500 one year later.
2. The Mega-Caps Give Up (Bearish Outcome)In this scenario, the few massive stocks propping up the index can no longer carry the weight of the broader declining market. The index rapidly gives up its ATH and drops to chase the weak breadth downward.Historical Examples: 1972 (Nifty Fifty era) and the 2000 Dot-Com Bubble. In both cases, the headline S&P 500 or Nasdaq indices hit record highs supported entirely by a tiny cluster of heavily weighted elite stocks, while the average stock was already collapsing. Because the underlying market lacked liquidity and broad participation, the mega-caps eventually cracked, leading to sharp, broad-market liquidations.