
Ant
2.3K posts

Ant
@Cribba35
Dees Barca Rockets Hammers Former/Retire Flergs Premier 1st HOF member
Katılım Kasım 2012
107 Takip Edilen90 Takipçiler


@CryptoCrewU But is all we want for May is a 12D macd cross. Every cycle it tells us one thing.
I never forgot this as that buy made me so much money
English

@Cribba35 Hey Ant,
The 12D MACD is definitely one of the more interesting charts.
But as always, context & confirmation matter. One signal alone isn’t enough, especially in this market.
Appreciate the suggestion, stay tuned. 👊
English
Interesting charts from Scott.
BTC is approaching one of the most important levels on the chart right now.
The market is about to show its hand 🤔
₿📈CryptoBroAlerts📉₿@CryptoBroAlerts
@PeterLBrandt The levels 🤝
English
@CryptoCrewU Steve? Is all we want for Mzy is the sane as Christmas in 2023? Check the 12D chart and a video please
English
@CryptoCrewU Steve can you do a video on the 12D chart and the MACD what is happening and what this has signaled and marked EVERYTIME WITHOUT FAIL (Your words). Should we start all we want for End of May is a ???????
English
🚨BREAKING🚨 FIRST TIME IN BITCOIN HISTORY – THIS HAPPENS NEXT
Don't miss this drop!! 🔥
Click Here and watch now: youtu.be/GzyuEjBg8eU ⬅️✅

YouTube
English

#Bitcoin: These are the last days and if you are lucky the last few weeks above the 80k range, the area of 50k and below is calling and the big crash is a matter of time
English


So bears are you enjoying the pump on altcoins or not yet ?
English
@ArdiNSC @Sykodelic_ 💯 spot on here. I can call the bottom every day and eventually be right. That all this did. And we haven’t even made a HH or change structure. We’re still in a bear market. What’s he going to do when we dump to 50k
English

He called the top and got 95% of the move down.
Meanwhile, you said the bottom was in at $100K.. $90K.. $80K.. $70K.. and $60K.
So the fact you are saying "I was right, he was wrong" is pretty funny.
Easy to say you were "right" about the bottom when you call it on every dump so far!
English

Yes you were.
No one knows this, but Killa blocked me for engaging in a counter to this “MuCh LoWEr” constant thesis.
He jumped in my DMs and shared his PNL sheet and tried to clown me, then blocked me.
He also asked me how I got so much engagement by posting nonsense.
Now, it looks like he has gained a lot of followers and engagement for being wrong.
But I can’t revisit our little interaction cos he blocked me.
I was right, he was wrong.
He grew to over 200,000 followers by being wrong.
He had less than me when we first engaged.
Lesson is - fear sells.
No one wanted to hear about my thesis of higher and all I’ve been subjected to is hate and abuse from the bottom.
I respect him for admitting he’s wrong…
But that’s as far as it goes.

English
@_Crypflow_ 2W SRSI still only at 45 with plenty room to move to the upside.
English

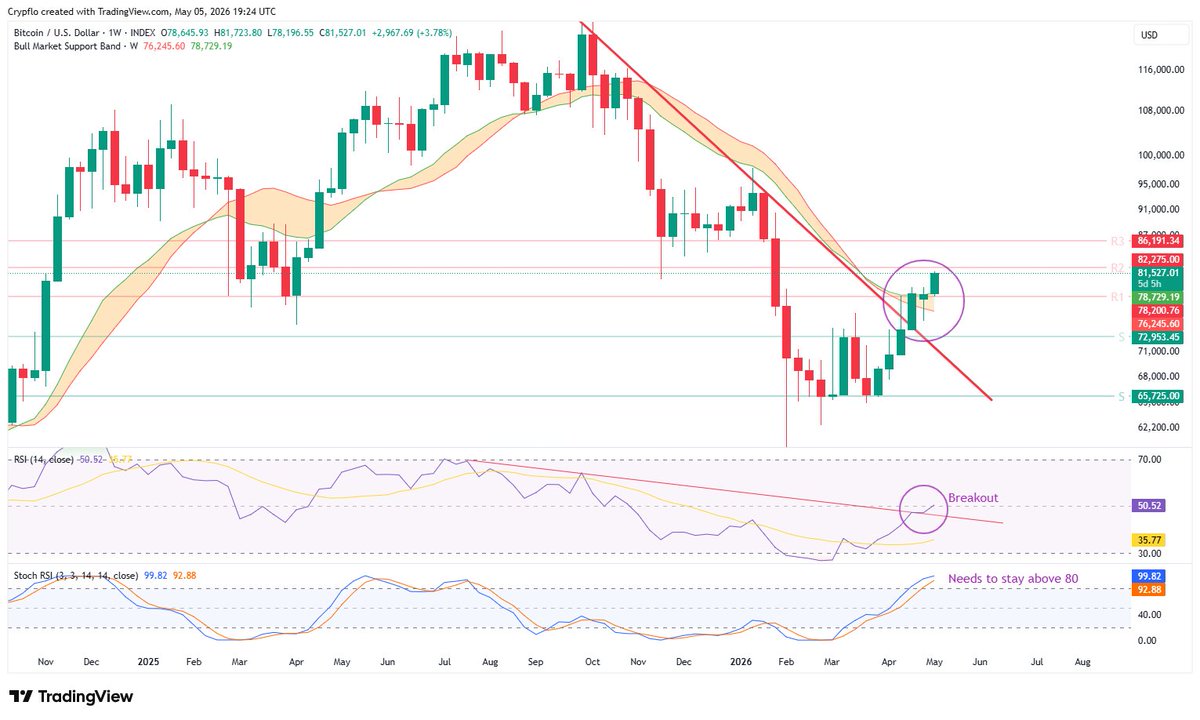
$BTC (1W) - Momentum is building
Bitcoin pushed back into the bull market support band but hasn’t fully reclaimed it yet.
At the same time, BTC closed above R1 for the second week in a row and is now pushing towards R2 (~82K).
Break that level → and 86K opens up quickly.
RSI is also breaking out of its multi-month downtrend.
So yes… a lot of bullish signs here.
But it needs to hold.
Stoch RSI sitting at 99+ and needs to stay above 80 to keep the fire going.
Very important weekly close ahead.
A close above R1 turns the level into new support.
The chart is setting up nicely… but confirmation still needed.
What’s your take? Breakout or fakeout?
CRYPFLOW@_Crypflow_
$BTC (1W) - Weekly structure is trying to flip bullish again. Last week Bitcoin closed back above the multi-month downtrend and is now pushing to reclaim the bull market support band. At the same time, price is pressing above weekly resistance (R1) at around 78K. Reclaim the band + break R1 → and the higher timeframe shift becomes real. Fail here → and this turns into another rejection within the trend. A few hours left on the candle… this close matters.
English
English

Most Game 7s in the first round in NBA history:
2014 playoffs - 5
2026 playoffs - 3
8 playoffs tied - 2
One Game 7 on Saturday.
Two Game 7s on Sunday.
English
@CryptoBroAlerts What is the difference between WNA and SMA or EMA? Never heard of WNA?
English

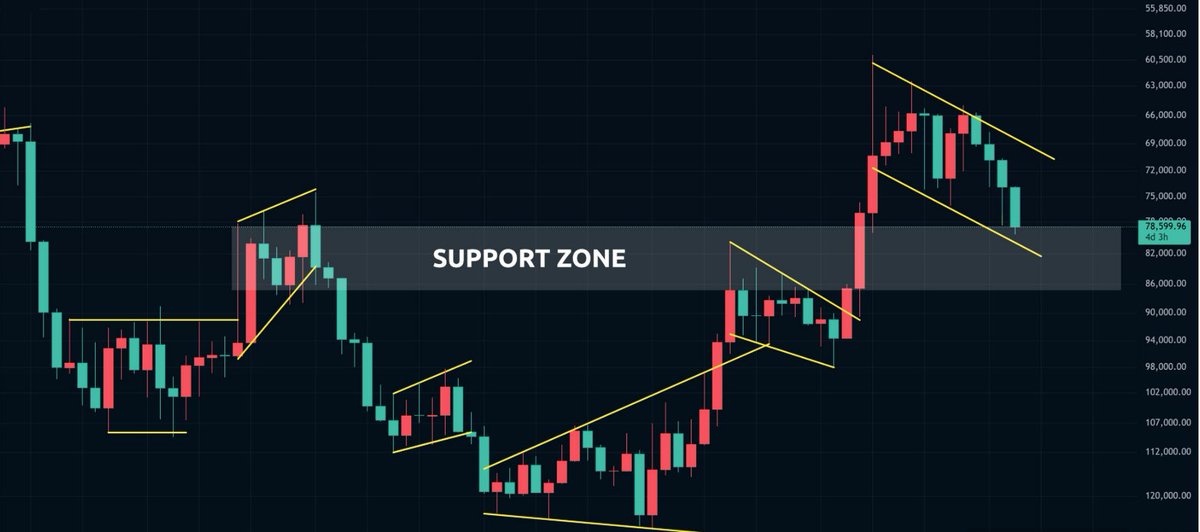
🚨 $BTC 1W TRADE UPDATE
🟢 BULLS pushed price directly into the short trigger entry
🔴 BEARS are now watching for one more sweep of the wick high into the NY open today
The short has triggered here…
But there’s ONE bullish sign bears cannot ignore:
👀 The 21WMA is attempting a RECLAIM
Below the 21WMA = bears stay in control.
Above the 21WMA = bulls may force shorts to defend UPSIDE
Level to level.
⚠️ NFA — Always manage risk.
#btc #signals #ta #trading #ffa

English
@Sykodelic_ Except it’s getting rejected from the 21 SMA which is massive you’re not even looking at this for some reason. Really right into the 21 SMA and rejected. Thats not bullish at all.
English
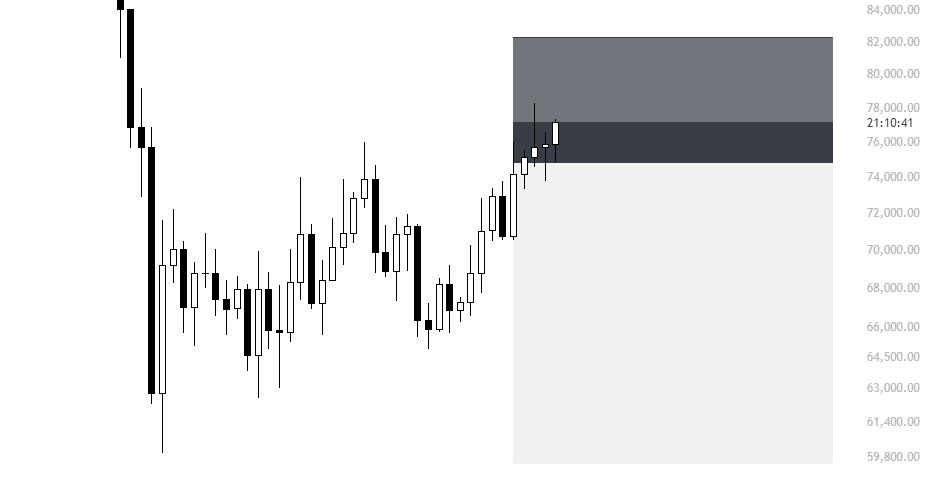
Really strong weekly close here.
Not only did it close above the 2025 yearly low wick of $74,400...
It also closed above the candle body of $78,330.
To me, with my system, this has now confirmed that the bottom is in with higher than 90%.
Bitcoin has fully reclaimed HTF Bullish structure and my thesis of an expanded flat has been confirmed.
Every single time it has done this, the bottom has been in.
All eyes on the $80k - $90k level for May.
New highs this year.

Sykodelic 🔪@Sykodelic_
This is a very important weekly close. And so far, its looking good for the bulls. But lets cover the 360 degree picture here. On the HTF Bitcoin has now: - Reclaimed HTF structure and the 2025 yearly low - Broken out on the 1W RSI - Ticked bullish on the 1W MACD - Broken above the 100D SMA On the bearish side we have: - Below the 1W 50EMA - Below the 200D EMA - Short term holders average cost & true market mean at $79,000 There are some very key levels for BTC to work through here before you could begin to confirm a new uptrend. However, every previous time Bitcoin has reclaimed HTF structure, it has marked the cycle low. In addition, with the RSI and MACD so strong, I am, every day that passes, expecting this to mark our low and move higher. On the LTF we have: - Price stabilising at this key level - Funding on its longest negative streak in years - Spot leading the rally - Coinbase premium consistently positive In short, there has been a strong bid for Bitcoin and its holding it. My thoughts as we head into next week/month are that a rejection here to a retest of the $74k level could be next, retest the HTF structure breakout... But then a move towards $86,000, breaking through STH cost basis and true market mean this time, to have a go at the 1W 50 and 1D 200 EMA's. They will bring another challenge. Overall though, I am of the view that we have very likely bottomed here and the breaking above $74,400 on the weekly confirms the expanded flat correction for me. Both the RSI, MACD and weekly structure show positive signs. If we lose this level again on a next weekly close, that would be bearish and I would then be looking for lower targets in the range again. Let's see how it goes!
English
@CryptoCrewU @5_0Trading get ready for that dump. Starts any day close your longs open the shorts.
English
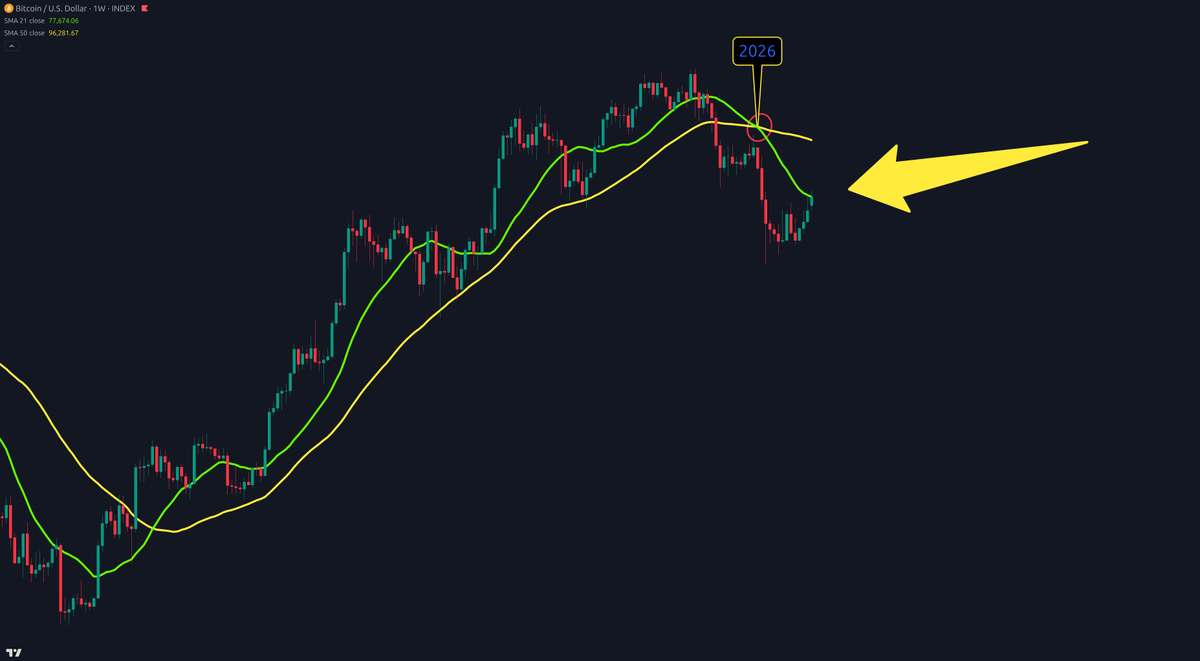
Bitcoin just hit the 21-week MA
30% rally into resistance 👀
No conviction.
No higher high.
Same setup as every bear market before it.
What happens next?
English
🚨 DON’T GET FOOLED 👀
#BTC is rallying but still below key weekly levels.
21 & 50 SMA = resistance.
In bear markets, this is where traps form.
Get the full Weekly Report 👇
cryptocrewuniversity.com/x

English


@KillaXBT @5_0Trading wil provide the liquidy for us and his followers longing 😂😂
English

$BTC
Adjusting my swing short SSL to 83K.
1 week closure above 83K as invalidation.
Killa@KillaXBT
$BTC I’m still in my swing short, nothing has changed. Every short I’ve taken has been called out publicly, with my entries, updates, and closures. I’ll reply with proof for anyone questioning it. The reality is simple... I’ve navigated this cycle well and captured the majority of the key swing moves. At some point I’ll be wrong, that’s part of the game. That doesn’t erase the consistency of the trades I’ve shared, every short since 123K. My current position remains swing short, with invalidation as a 1W close above 80K (SSL). If I get stopped, I’ll own it. Simple as that. My track record is out there, and I won’t hide from my losses. 🤟
English
@DaanCrypto @5_0Trading perfect place for a rejection. Close your longs open some shorts.
English

$BTC Attempting to break back above the bull market support band.
Eyes on the weekly close this weekend, as it will be an important one.
Bitcoin has not traded above its bull market support band since October 2025.

Daan Crypto Trades@DaanCrypto
$BTC There is the test of the bull market support band. Important weekly area we are trading at here. Above, the BMSP acting as resistance for now. Below, the Weekly 200EMA has been the primary support. Relatively large range in between, but we are talking weekly levels after all. Good to keep an eye on the candle closes around these levels.
English