ChurchOfTheCycle

5.2K posts

ChurchOfTheCycle banner
ChurchOfTheCycle

ChurchOfTheCycle

@CryptoCycleGod

TradFi shit is cracking. Crypto is an exit. One shot. One opportunity. Let's go!

Germany Katılım Temmuz 2024
187 Takip Edilen2K Takipçiler
Sabitlenmiş Tweet
ChurchOfTheCycle
ChurchOfTheCycle@CryptoCycleGod·
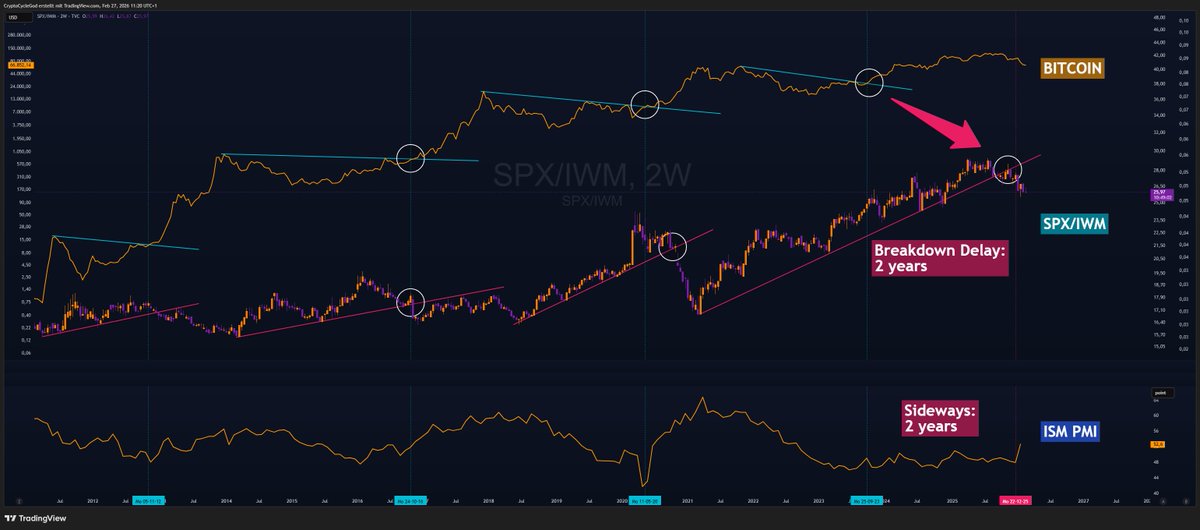
Why the 4-Year Cycle Is Dead (Lessons from My Mistakes!) Part 02: Business Cycle and Equities Another mistake I made: I sticked for too long to the 4 year cycle repetition. But from beginning of 2024 on, I could and should have seen, that the cycle was broken. As you can see, before we had a clear inverse correlation: $SPX / $IWM breaking down, $BTC breaking out. Within a few months. As you can see, this was about 4 years apart and is also clearly visible as "waves" in the ISM PMI metric. In September 2023 Bitcoin broke out. But SPX/IWM kept riping (just several trendline retests, but with a clear uptrend ongoing). On the ISM PMI was just a small, shortlived spike. Two(!) years later we got the breakdown on SPX/IWM. And ISM PMI starting to breakout to the upside (confirmation next week). We had two years of sideways for ISM PMI, which happens for the first time in the history of Bitcoin. This is another reason, why the 4 year cycle is broken. You can ignore that and stick to your cycle. Or act accordingly.
ChurchOfTheCycle tweet media
ChurchOfTheCycle@CryptoCycleGod

Why the 4-Year Cycle Is Dead (Lessons from My Mistakes!) Part 01: US Net Liquidity Another metric showing we are at the bottom and operating in a different environment than before is US Net Liquidity. One key reason why cycles (liquidity, debt, credit, economy – and therefore crypto) have become significantly longer: The yellow line below represents US Net Liquidity (FRED data): the ratio of US M2 money supply to US debt. We are in the endgame of the 100+ year overarching debt supercycle – and this is the longest downward phase without any interim spike since Bitcoin's inception. What does this mean? Since late Q3 2021, liquidity in the US market has been steadily declining. Remarkably: the entire Bitcoin bull run so far has occurred during strong and sustained falling liquidity. A situation never seen to this extent before. There was a moderate, gradual increase from late 2024 to mid-2025 (the period when I mistakenly called the start of Altseason). But it was never a sharp spike. The yellow bars mark historical phases of sharp, uninterrupted rises in US Net Liquidity. Pattern observed: Every such sharp rise occurred at the beginning of – or during – a parabolic move, right up to the cycle top. That’s exactly why I (wrongly) expected a parabolic phase starting late 2024 / early 2025: - US Net Liquidity (and other metrics) began rising, including globally - The timing seemed to fit perfectly into the 4-year cycle framework - Macro conditions started improving My main mistakes: - The liquidity increase was only moderate, not sharp - I relied too heavily on the 4-year cycle for timing - Macro conditions were not fully supportive The tricky part: Last year’s liquidity rise, followed by the subsequent drop, superficially fits the old pattern, making it easy to mistakenly believe the 4-year cycle is still intact. In previous cycles, when liquidity moved sideways and then dipped further, the bear market had typically already ended (or was very close to ending). Complicating matters further: since 2021/2022, the US government and FED have introduced various new facilities (BTFP, etc.) to provide banks with liquidity and collateral support – interventions that do not directly appear in the classic US Net Liquidity metric. Accept the fact, that the evironment has changed. Accept the fact, that Bitcoin rised, because the big boys are taking over, not because the 4-year-cycle will be there forever. Accept the fact, that this time is not different – Bitcoin behaves differently because the environment changed. The correlations are still the same.


English
1
2
32
4.7K
ChurchOfTheCycle
ChurchOfTheCycle@CryptoCycleGod·
@Sykodelic_ Hats off! And you are exactly right: Everything is worthless if you health is detoriating.
English
0
0
2
121
Sykodelic 🔪
Sykodelic 🔪@Sykodelic_·
Bullish on this. Smashed my 5k PB today. About to be 37 years old and fitter than I’ve ever been, 100% natural. You don’t need steroids, peptides, or anything else. Im 93kg and definitely don’t have a runners frame. 39 resting heart rate and VO2 max at 60. We aim to excel financially but physically, is even more important. It’s gonna be a good rest of the year!
Sykodelic 🔪 tweet media
English
50
1
257
11.6K
ChurchOfTheCycle
ChurchOfTheCycle@CryptoCycleGod·
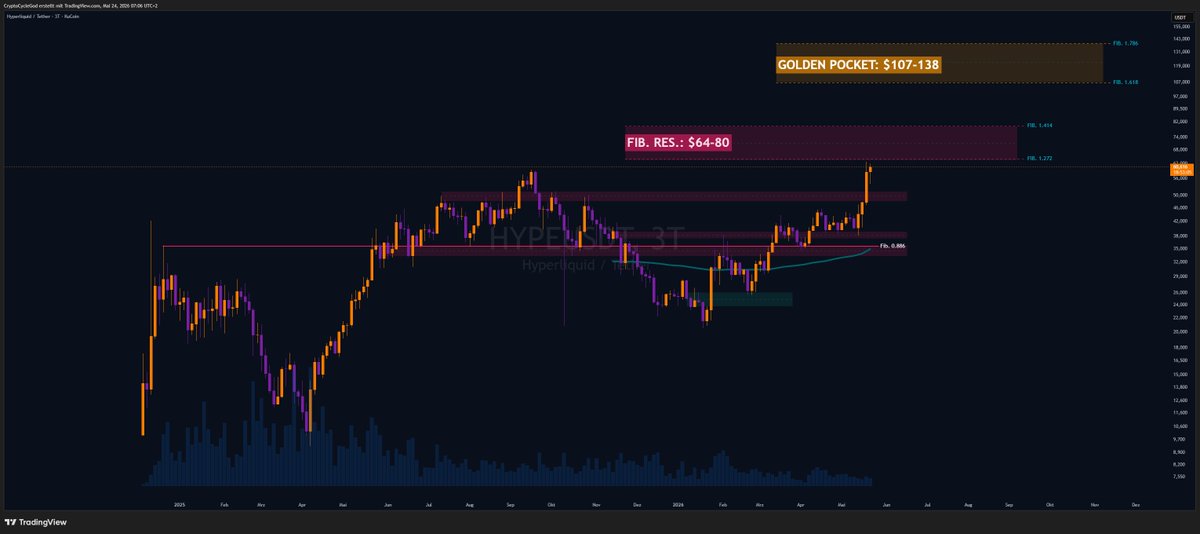
// $HYPE 3D Hyperliquid chart works like clockwork. We got the mentioned retest of 0.886, a bit of consolidation to fuel up and the move up to the No. 1 price discovery resistance area, which is between 1.272 and 1.414. Price can consolidate here and rip through for a dive into the Golden Pocket. Or it can go for a retest. We will see. Don't be surprised if we reach 2.618 in Full Bull. I know it sounds insane. But that is because people do not understand, in which times we are right now. It sounded insane for people to assume, that Gold will reach that Fib. Level on Log. Scale. Have a look at the Gold chart yourself. It tells you where good Altcoins are going.
ChurchOfTheCycle tweet media
ChurchOfTheCycle@CryptoCycleGod

// $HYPE 3D Hyperliquid broke through the OB like through the resistance and the 0.886 below. Definitely time for a retest. Even if it wants to go higher from here, I would like to see a successful retest of the 0.886 Fib. Level at some point for a healthy and strong continuation.

English
0
1
6
1K
ChurchOfTheCycle
ChurchOfTheCycle@CryptoCycleGod·
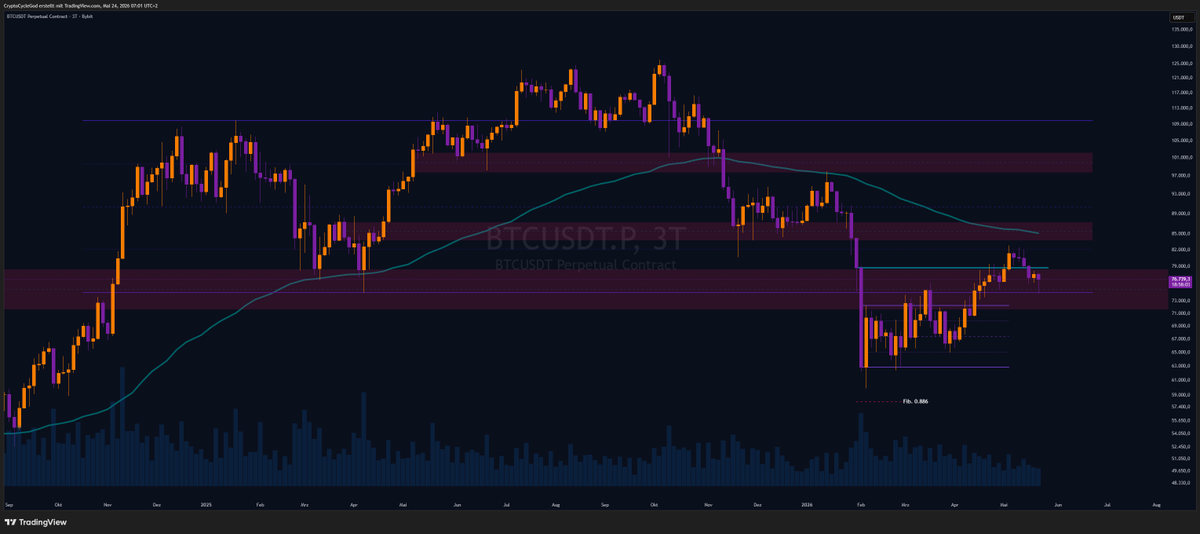
// $BTC 3D Looks like the perfect retest so far. But as long as we are not above $86k, we are not out of the mud. Don't get me wrong: Nothing changed for me since February, when I posted, that the low is in. But we still can fall back into the accumulation range or go for a deeper retest from here. But that is nothing to worry about. One of the signs, that this move lacks power is the Volume, that was dropping all of the move up. Either way: Bears are fckd <3
ChurchOfTheCycle tweet media
English
1
0
9
538
RESM Cycles
RESM Cycles@RESMcycles·
@KylieJerg @OVcrypto @CryptoCycleGod Thank you for the kind words. 🙏 Hopefully some interesting stuff! It will be on the higher timeframes like I said 420-years, 840-years, and higher. Until I get this thing published properly.
English
1
0
3
69
RESM Cycles
RESM Cycles@RESMcycles·
I want to announce that this account will be not be posting any more about the more actionable parts of RESM Theory until I have formerly published the Theory. This pertains to the 12-Year, 35-Year, 105-Year, and Technology Cycles. I have been seeing some posts on X that are hitting a little too close to home. This may be paranoia. But, I am not going to get railroaded because other accounts have way more followers on X than this account does. This is my life's work, not someone else's engagement bait. I will still post charts about daily and weekly cycles for major markets. And I will pivot to posting about the very high time frame cycles, as evidence for how powerful this theory is. The biggest cycle in the master hierarchy is 5040 years. We will look at things like epochs, ages, hegemony/fragmentation, and socio-economic paradigms. Let me know if you think this is an overreaction.
English
7
1
27
761
Ace
Ace@acethebulllly·
Gym at rush hour is a different kind of patience test. 🤦‍♂️
English
5
1
23
916
RESM Cycles
RESM Cycles@RESMcycles·
I want to thank @OVcrypto and @CryptoCycleGod for giving this account shoutouts, and in some cases a bigger champion of RESM Theory than even I have been.
English
2
0
7
348
ChurchOfTheCycle retweetledi
𝗟𝗶𝗾𝘂𝗶𝗱𝗶𝘁𝘆 𝗛𝘂𝗻𝘁𝗲𝗿 🦈
Gm guys! 🌅 As long as we hold this level, we’re completely fine! For now, we’re heading for a retest of the range low. Completely normal and clean price action. Don’t listen to the noise from CT. Zoom out and stay patient. We might have a little chop ahead of us.
𝗟𝗶𝗾𝘂𝗶𝗱𝗶𝘁𝘆 𝗛𝘂𝗻𝘁𝗲𝗿 🦈 tweet media
English
5
1
26
1.8K
ChurchOfTheCycle retweetledi
Reads with Ravi
Reads with Ravi@readswithravi·
A reminder from Carl Jung:
Reads with Ravi tweet media
English
14
136
1.2K
37.6K
ChurchOfTheCycle
ChurchOfTheCycle@CryptoCycleGod·
tHeRe WoN't bE qe... Call it what you want. But that is not QT.
ChurchOfTheCycle tweet media
English
2
3
22
2.1K
OVcrypto
OVcrypto@OVcrypto·
Inverted chart and indicator built combining the CURRCIR and the WCURCIR (because the CURRCIR has been discontinued since October 2025) but same idea as the first one presented by @CryptoCycleGod - check and bookmark his chart
ChurchOfTheCycle@CryptoCycleGod

[04/12] Let's put it in perspective with a big beautiful chart (Chart below. CURRCIR vs. SPX ratio. Google the tickers if you don't know them. Standard economic chart. You should know this if you're serious about markets.) Rising line = bearish vibes. Dropping line = bullish. It reveals massive cycles: - Big Debt Cycle ca. 105+ years - Divided into three 35-year sub-cycles (bottoms: 1929, 1964, 2000… next ca. 2035) Each 35-year block: Secular Bear → Secular Bull. Secular Bears pack multiple recessions/crashes (e.g., 2000–2009: Dot-com + GFC). Inside: 7-year Shmita cycles (shifted, not perfectly aligned). Every 7th year = potential bearish trigger. Also: Moon cycles / Total Lunar Eclipse phases correlate with bear markets (correlation, not causation!). Current eclipse phase bearish, ended two days ago. Next one kicks off 31st December 2028. Bullish until then. Markets often top months before the first eclipse in a new phase. Shmita points to September 2028. Beyond that? Unclear, but current trends scream direction. Current 35-year cycle ends ca. 2035. It is the third sub-cycle = end of the Big Debt Cycle. 2029 bear phase? Probably not the final crash. Too early. US decline is not advanced enough. I expect a massive melt-up into around 2035. Until then Roaring 20s like its 1926. Euphoria everywhere. Then, when everyone's drunk on hopium, markets tank hard. Nightmare mode within a sea of panic.

English
1
0
6
815
ChurchOfTheCycle retweetledi
𝗟𝗶𝗾𝘂𝗶𝗱𝗶𝘁𝘆 𝗛𝘂𝗻𝘁𝗲𝗿 🦈
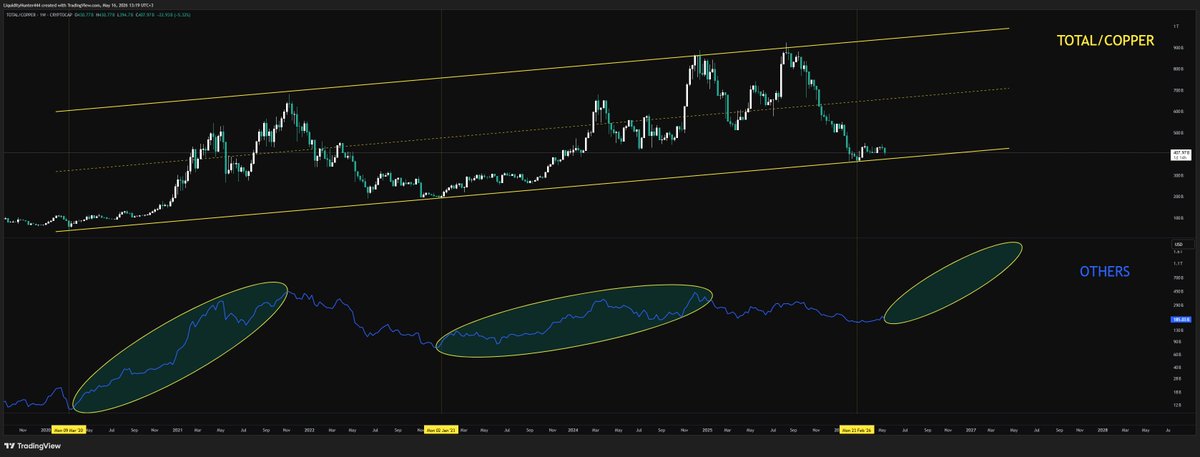
$TOTAL / $COPPER Total/Copper is inside a multiyear channel. Every time it has touched the lower line it has marked the bottom. We are exactly at this level right now, so a strong bounce here is very probable. At the same time, every time $Total / $Copper has made a bottom, $Others has started a very strong rally. I'm expecting exactly the same outcome for $Others this time as well. #Alts #Copper
𝗟𝗶𝗾𝘂𝗶𝗱𝗶𝘁𝘆 𝗛𝘂𝗻𝘁𝗲𝗿 🦈 tweet media
English
4
12
49
1.7K
ChurchOfTheCycle
ChurchOfTheCycle@CryptoCycleGod·
@chad_ventures It is entertaining and has some well written scenes. I think it is worth the time to watch it.
English
0
0
2
26
chad.
chad.@chad_ventures·
On a side note, I never watched The Big Short. Should I watch it on the weekend?
English
7
0
9
1.9K
chad.
chad.@chad_ventures·
Just remember, bears are wrong so often that the one time they get it right they had to make a movie about it.
English
6
4
57
3.6K
GeoMetric
GeoMetric@GeoMetric_9·
hey guys, I have some difficult circumstances unfolding with my family which will require my dedicated time and attention for an extended period. I may be out of action for almost a month or so. X Subs I will try to keep you'll posted during significant developments and on $BTC signals from the QuantMetric system as promised and will stay in touch with the Whop group during this time. Thank you and hope to see you'll soon once my family get's through this.
GeoMetric@GeoMetric_9

I'll be away from the 18th to the 25th of May (no public posts during this time).

English
36
1
179
7.9K
ChurchOfTheCycle retweetledi
Überrenditen
Überrenditen@Uberrenditen·
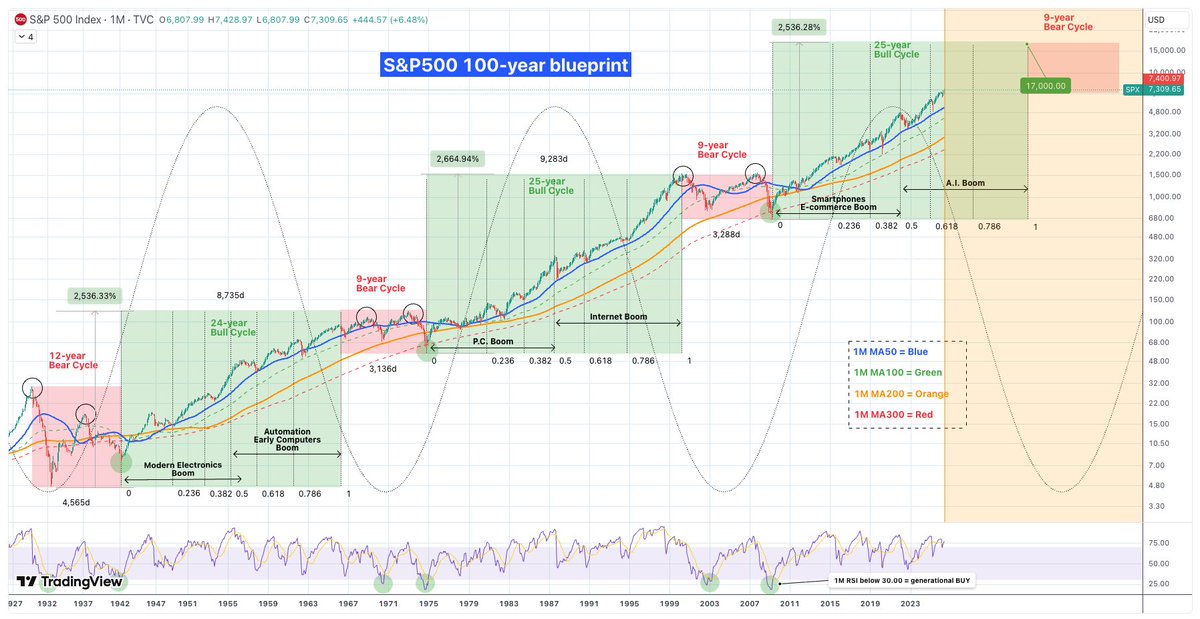
Der 100-Jahre-Plan für den Aktienmarkt Wenn du dir die letzten 100 Jahre anschaust, siehst du ein klares Muster: Der Markt wiederholt immer wieder die gleichen Zyklen. Seit der Großen Depression 1930 gab es drei große Abwärtsphasen und drei Aufwärtsphasen . Wir stecken gerade mitten im dritten großen Bullenmarkt. Die schlechten Zeiten (Bärenmärkte) Diese Phasen dauerten meistens etwa 9 Jahre (die Weltwirtschaftskrise von 1930 war mit 12 Jahren eine Ausnahme). Ein typisches Zeichen war, dass der Markt zweimal oben und zweimal unten „anklopfte“, bevor es wieder aufwärts ging. Oft krachte der Kurs bis zu einer bestimmten langfristigen Linie (dem 300er-Schnitt im Monatschart) und startete von dort aus neu durch. Die guten Zeiten (Bullenmärkte) Die ersten beiden großen Aufwärtsphasen dauerten jeweils 24 und 25 Jahre. Das Spannende: Sobald der Markt einmal Fahrt aufgenommen hatte, fiel er fast nie unter eine bestimmte grüne Linie (den 100er-Schnitt). Die blaue Linie (50er-Schnitt) war dabei immer die beste Chance, um günstig nachzukaufen, wenn es mal zwischendurch ruckelte. Warum steigt der Markt so extrem? Hinter jedem Bullenmarkt steckt eine neue Technologie: Früher waren es industrielle Durchbrüche. Dann kam der Internet-Boom. Heute erleben wir den E-Commerce- und Social-Media-Boom. Klar, irgendwann platzen diese Blasen immer, weil die Leute übertreiben. Aber die Technik bleibt! Das Internet ist nicht verschwunden, nur weil die Kurse im Jahr 2000 abgestürzt sind – es wurde zum Fundament für alles, was wir heute nutzen. Der KI-Boom Wir sind jetzt im zweiten Teil des aktuellen Aufschwungs, und der wird von der Künstlichen Intelligenz getrieben. Wahrscheinlich wird diese Blase um das Jahr 2034 platzen. Das wird wehtun, aber danach wird KI das feste Rückgrat unserer gesamten Wirtschaft sein. Im Grunde sind die letzten 100 Jahre eine Kette von Erfindungen, die die Kurse immer höher treiben. Die Abstürze zwischendurch sind nur dazu da, die heiße Luft rauszulassen und Platz für neues Geld und die nächste Technologie zu machen. Was bedeutet das für dich heute? Wenn dieser Zyklus so läuft wie die letzten beiden, könnte der S&P 500 bis auf 17.000 Punkte steigen. Es wird zwischendurch immer wieder Korrekturen geben. Der Zoll-Crash Anfang 2025 war so ein Moment, hat aber die wichtige blaue Linie nicht ganz berührt. Schau auf den RSI-Anzeiger. Wenn der unter 30 fällt, ist das eine Chance des Jahrzehnts. Das ist in 100 Jahren erst sechsmal passiert – und jedes Mal war es der perfekte Zeitpunkt zum Kaufen. Liken, Folgen, Speichern, Kommentieren, Teilen. Danke für den Support 🫶😊🫶
Überrenditen tweet media
Deutsch
170
1.2K
5.9K
1.2M
ChurchOfTheCycle retweetledi
Nic
Nic@nicrypto·
De-dollarisation is happening before our very eyes. With this move, up to €5trn in Chinese bonds could now back international transactions. US Treasuries have been the default collateral backbone of global finance for decades. That backbone is quietly being diversified...
zerohedge@zerohedge

*EUROCLEAR TO ACCEPT HK-TRADED CHINESE BONDS AS COLLATERAL: FT

English
2
9
65
4.8K