
Cryptorian Vision
7.4K posts

@CryptorianVsn
Professional analyst with short & long term vision • ₿itcoin • $DOG • Real Macro Economics • Follow for context, timing & conviction.


No banana zone. No capitulation. This cycle never entered a true banana zone. No parabolic expansion → no violent capitulation. Corrections match the move: slow expansion = slow, time-based correction. Thats why $27k–$32k makes little sense. The real support zone is much higher: • 200W SMA ~ $60k • Mining cost ~ $70k • Prior cycle top (69k → 60k) • 7-month consolidation (73k–50k) • 0.618 macro Fib ~ $58k Base case: bottom forms above $50k via consolidation, not panic. There is a lower-probability risk of a deeper move toward the 0.78 macro Fib around ~$40k, and Im prepared if price gets there Markets punish extremes, and this cycle never had one. (This is my base scenario if BTC actually goes down)

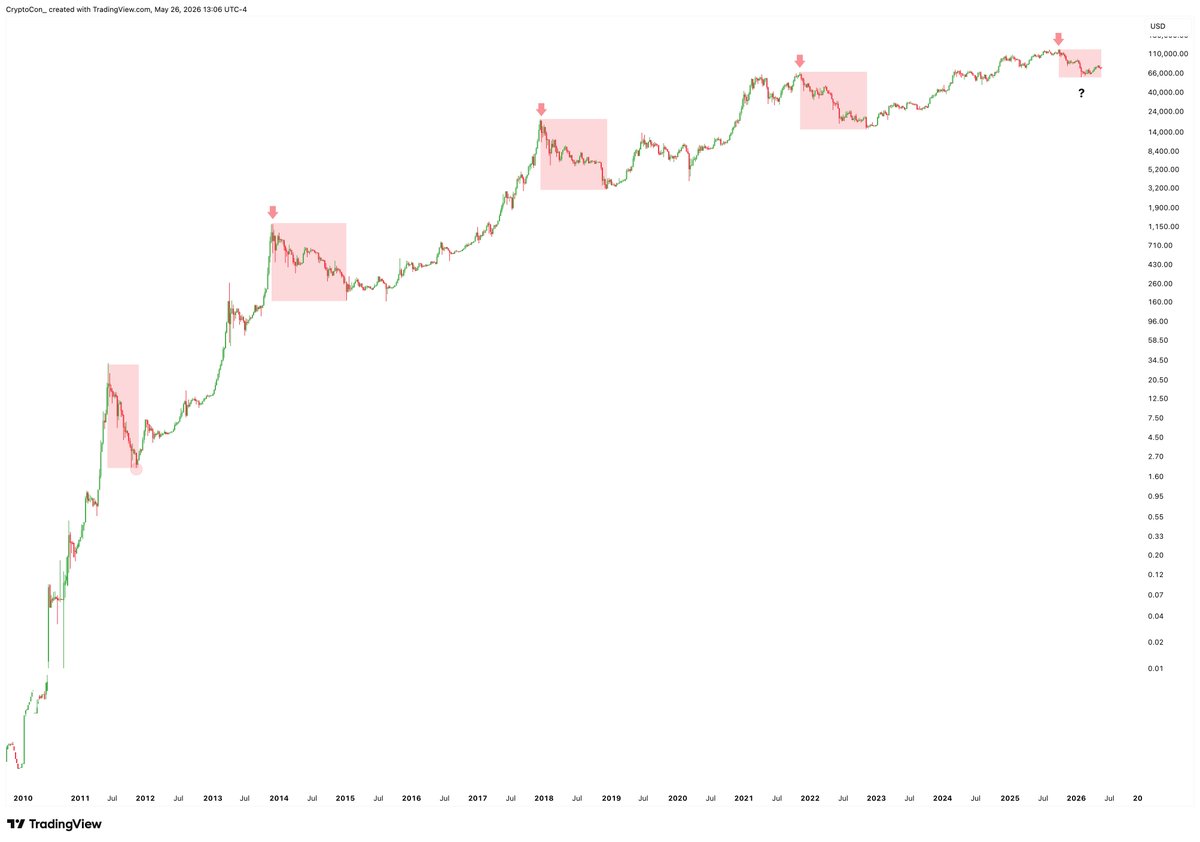
What if this is only the middle of the bear market? I don’t know what kind of event this model is forecasting. And maybe it never plays out that way. But I’ve seen too many confluences pointing toward the 25k-30k area to completely ignore it. Last cycle: • -52% first drop (A) • Relief rally into the 200 Day SMA (B) • -67% final capitulation (C) Now? • -52% first drop again (A) • Relief rally into the 200 Day SMA (B) • C wave starting to form Maybe it breaks the pattern. Maybe not. If history rhymes again, #Bitcoin could fall toward the 26k area before this bear market ends.


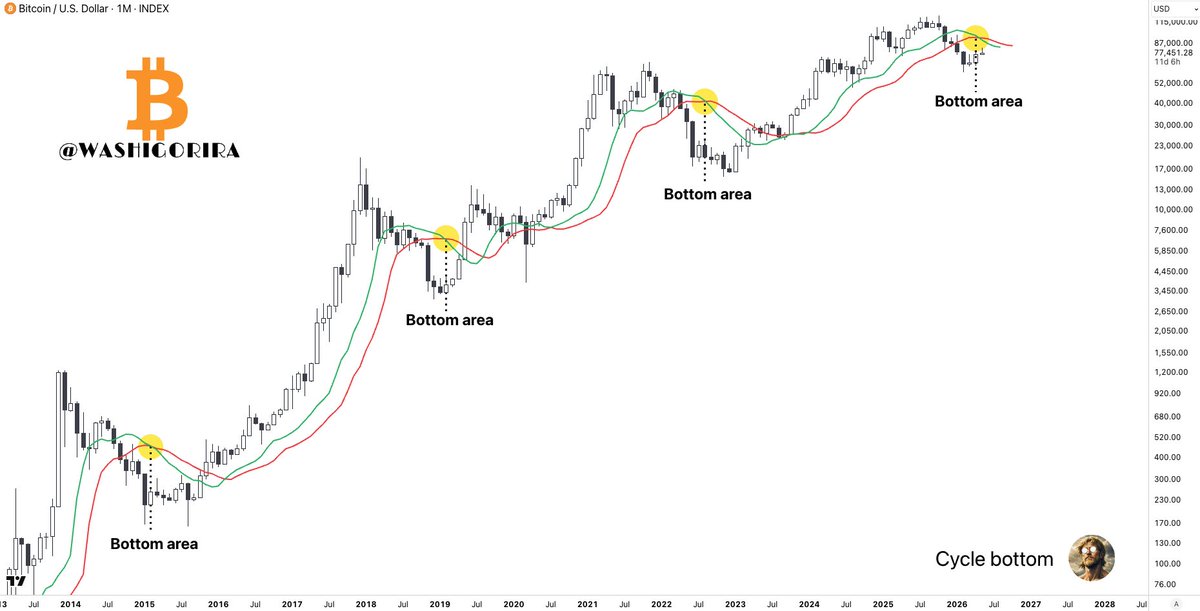
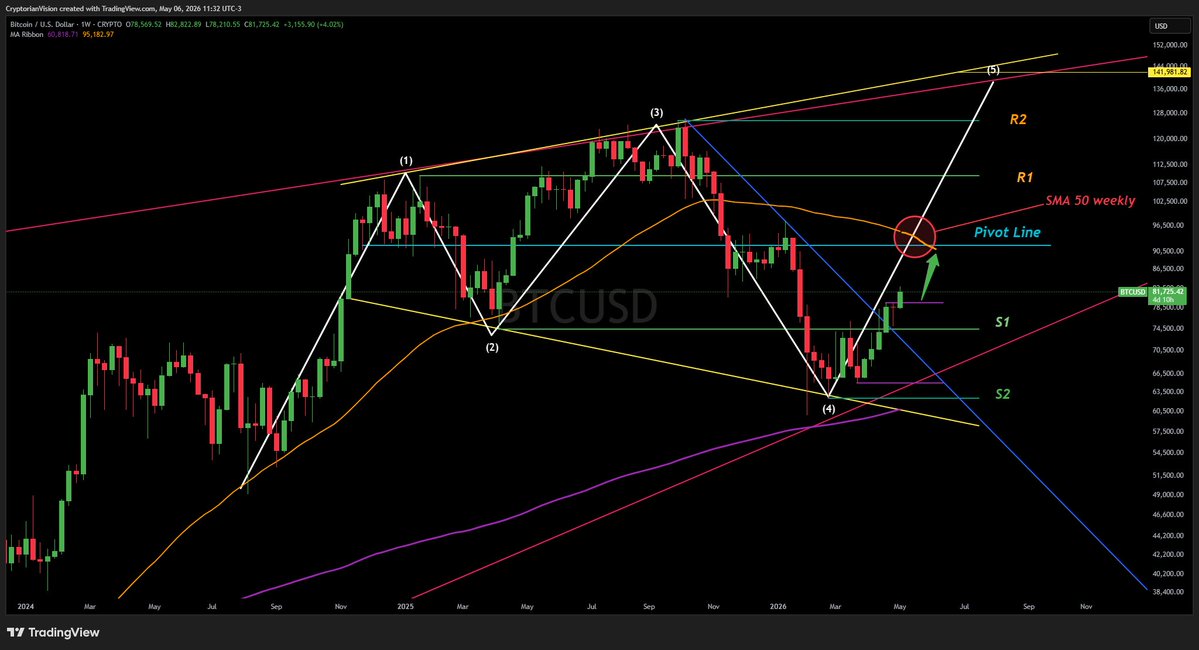
The moment of truth Imo, #BTC is heading towards the Pivot Line zone (~92k), and that will be the moment of truth to see if we'll see further gains or a complete rejection of the SMA 50 weekly If the Pivot line is broken easily, we'll see BTC around 140k.


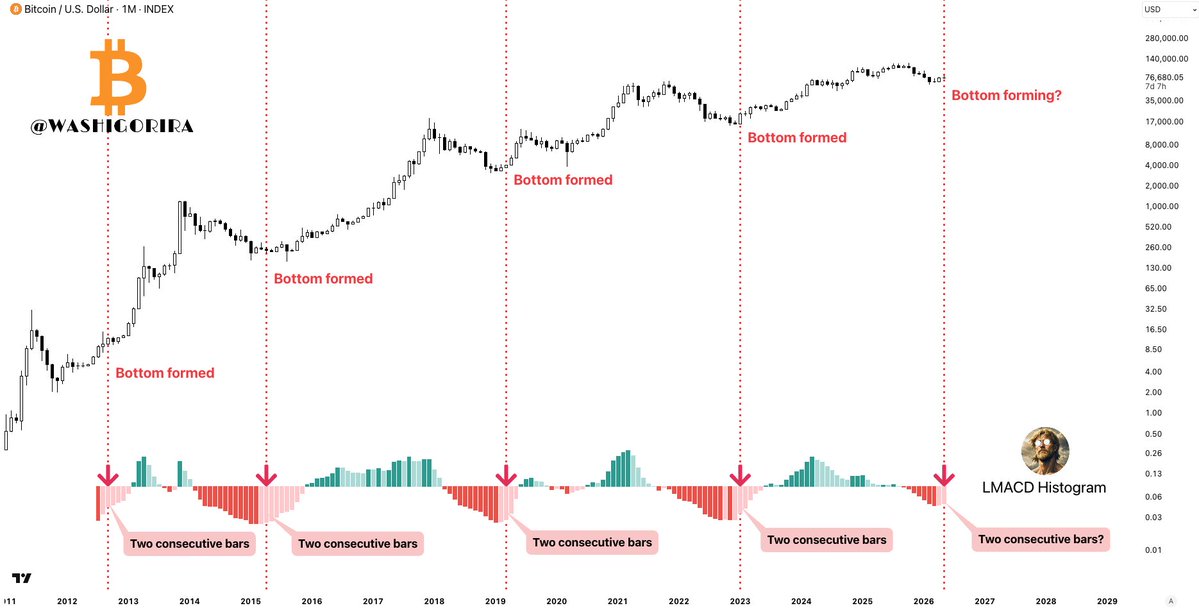
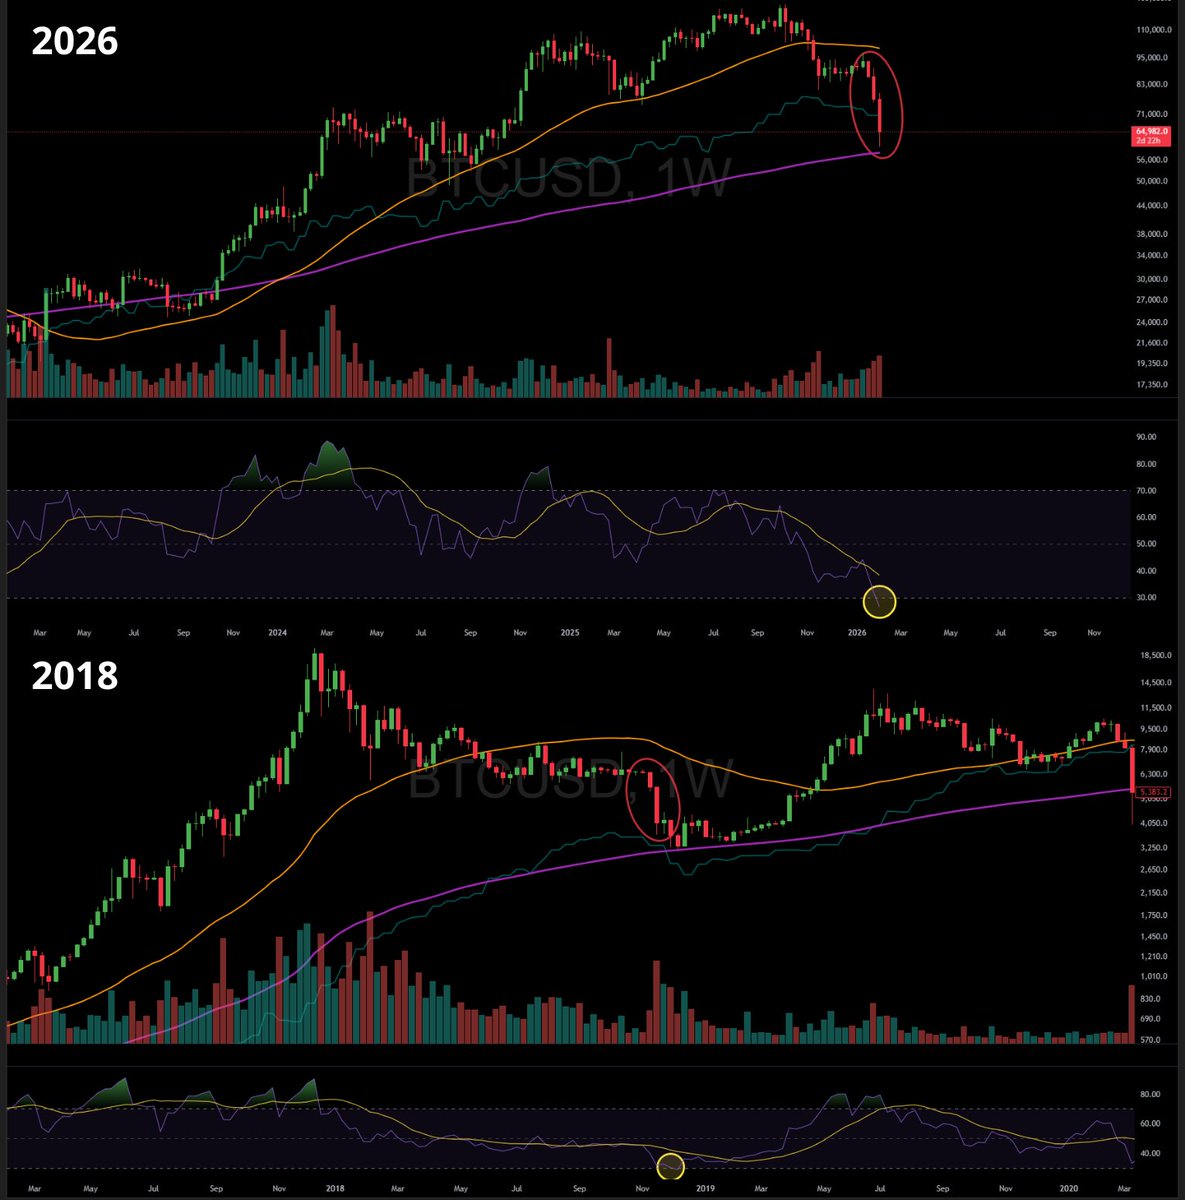
Three Black Crows on BTC weekly 🐦⬛ The Three Black Crows pattern just printed on the weekly Bitcoin chart, but context matters. This setup is usually bearish when it appears at the top. When it shows up after a prolonged drawdown, near major support, it often signals capitulation rather than continuation. What this can mean: Selling pressure is accelerating → panic phase Last weak hands are being flushed Market is approaching an exhaustion point Markets bottom in fear, not in confidence.

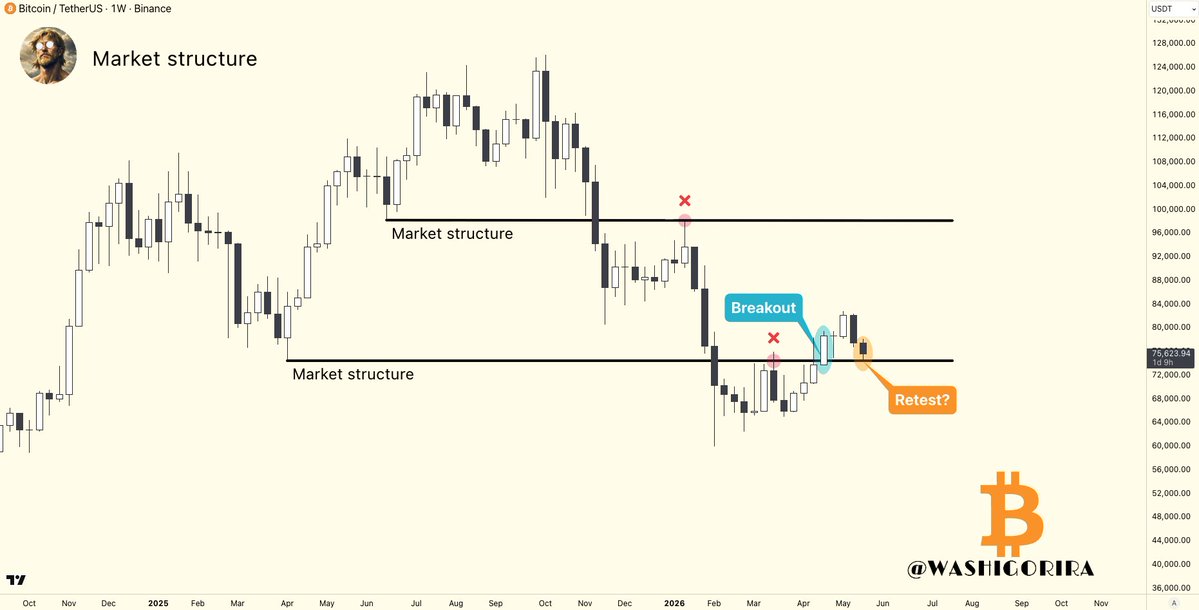
BTC Megaphone Pattern Not a perma bull. Just reading the chart. Heres the deal: Break S1 → momentum to Pivot (92k) Break 92–100k → 140k Fail → 50k 140k still in play


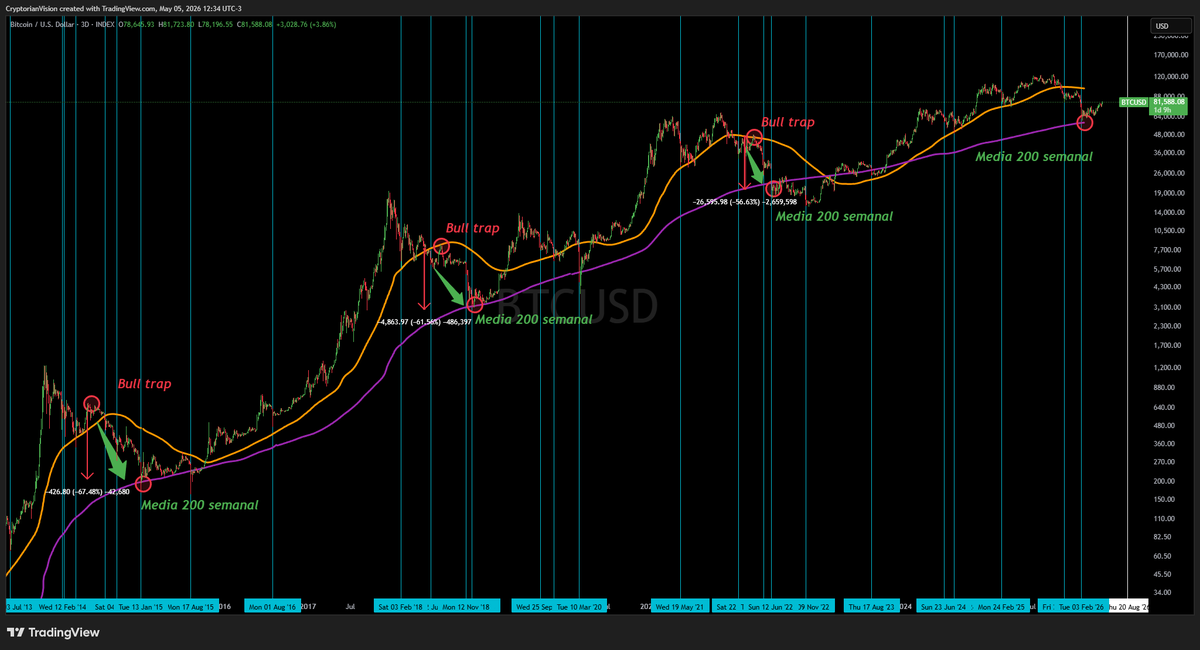
Estamos na alta mais prolongada do Bitcoin de todos os Bear Markets (considerando 2014, 2018, 2022 e 2026). Estou considerando pequenos períodos, também chamados de rallies de bear market, em que o BTC segue subindo fazendo topos mais altos e fundos mais altos até fazer uma trap e voltar a cair forte voltando a fazer novos fundos. Abaixo os rallies de bear market mais longos: 2014 -> Abril a Junho - 57 dias 2018 - > Fevereiro a Março - 30 dias 2022 - > Janeiro a Março - 66 dias 2026 - > Favereiro a Maio - 87 dias...e contando... Este ciclo realmente parece estar um pouco diferente. 😅 Apesar dessa recuperação recente, a volatilidade implícita (DVOL) caiu no período e está atualmente abaixo de 40. O BTC não costuma ficar muito tempo com DVOL abaixo de 40. A volatilidade do Bitcoin sobe com altas explosivas mas até agora nada, reforçando que essa pode ser mais uma bull trap. Maio pode ser o mês decisivo para fortes movimentos. Ou será que o Bitcoin ainda pode romper forte para cima e retomar a alta seguindo o S&P500 que está voando? De qualquer maneira é bom ficar de olho no DVOL. Ele sempre começa a subir quando começam movimentos fortes, tanto para cima quanto para baixo. *Anexos os gráficos na ordem (2014, 2018, 2022 e 2026).

This post will probably get a lot of hate, but... My portfolio is now 40% cash; 60% bitcoin:native. Highest cash holdings all bear market.


Repost if you still hold the fairest memecoin of all time $DOG


I REPEAT This chart doesnt need a legend