

RupeshKumarGuptha
324 posts

$MSFT and $META refuse to participate in this market rally.
… but why?

English

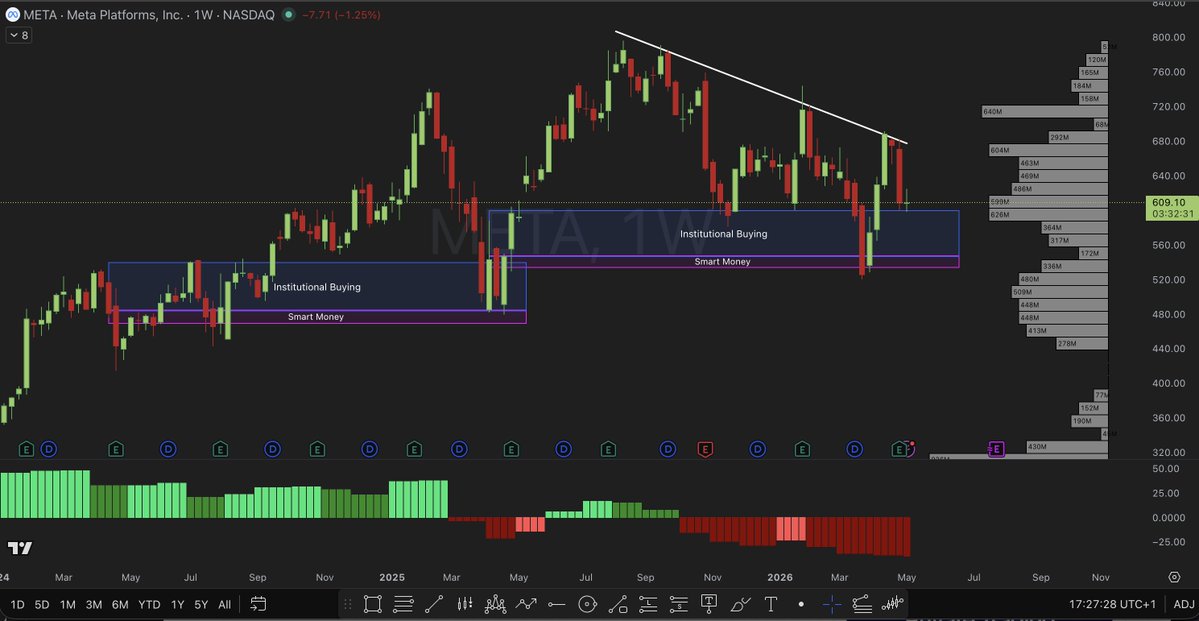
$META Monthly BX still showing selling pressure 🔻
Rejected right at resistance post earnings, so I'm sitting out for now.
Once Monthly BX confirms an increase and shows buying pressure, we can add it to the fund and trade the move back to all time highs.
English

$GOOG Google's Q1 FY26 visualized.
Let's break down the quarter:
🤖 $40B bet on Anthropic.
☁️ Cloud accelerates to +63% Y/Y.
💰 Backlog nearly doubles to $460B.
🛒 UCP welcomes Amazon, Meta & Stripe.
🔎 Search +19% Y/Y, queries at all-time high.
appeconomyinsights.com/p/google-the-a…
English

@ProblemSniper Ru still believe $META will reach 1300$ before DEC 2028??
English

I will post a video on it today!
I love $META anywhere near 600s. 1-2 year hold you can see 1300-1400 on it.
ATS90@factor_dbiotech
@ProblemSniper Bro, first a hug and thanks for all the value you provide I've learned a ton! Got any analysis or expectations for Meta's earnings? It's looking really strong. @ProblemSniper
English

Based on the latest data, Tesla deliveries this quarter are expected to come in between 360,000 and 390,000 units. I’ll tweet my final estimate on the last day of the quarter, as usual.
English


$GOOGL opens flattish tomorrow we are going to 314 and 318 above this week.
English
@MMatters22596 If we think like that it will be bag holder
English

$HIMS will hit $100.
And it could happen sooner than many expect.
I anticipate $HIMS to bottom between $17.76 and $10.73, with the lower edge being my preferred target.
After that, I expect a recovery to begin — potentially already in the first half of 2026.
Long term: $100+

English
@MrMikeInvesting This is dead from long time and not seeing any mojo from investors. It’s always using as a pump and dump.
English

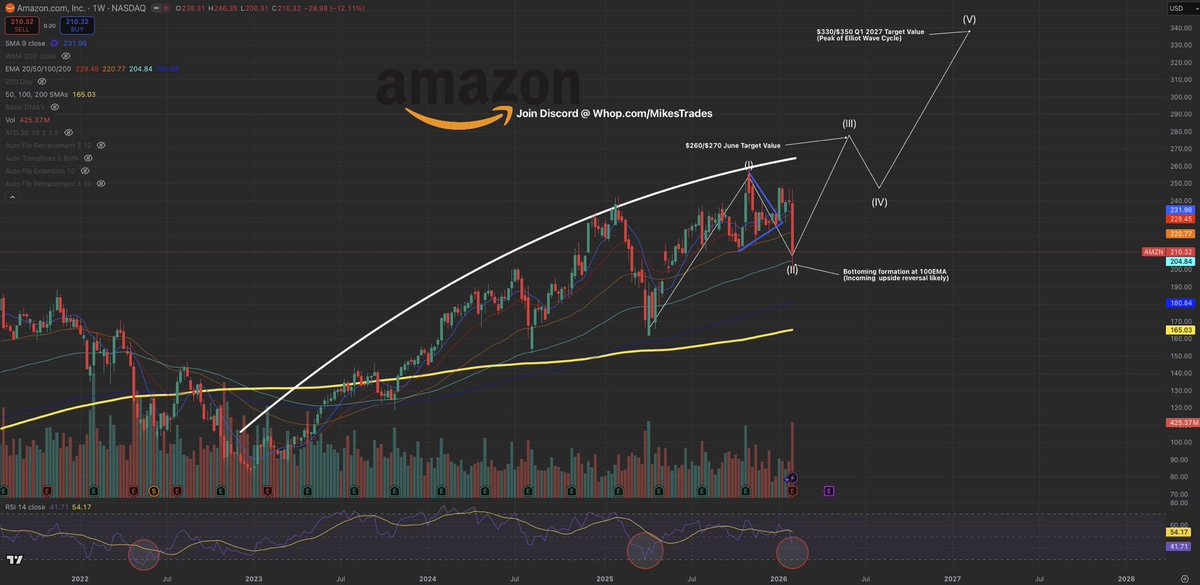
There is no better time to invest into $AMZN than now…
With AWS revenues up 24% YoY, $11.2B in 12 month free cash flow, & $200B in 2026 Capex, $AMZN remains a strong buy.
Insiders, & Congress members such as Nancy Pelosi continue to load $AMZN.
$300+ is your official 2026 PT.
Save this for later…
English
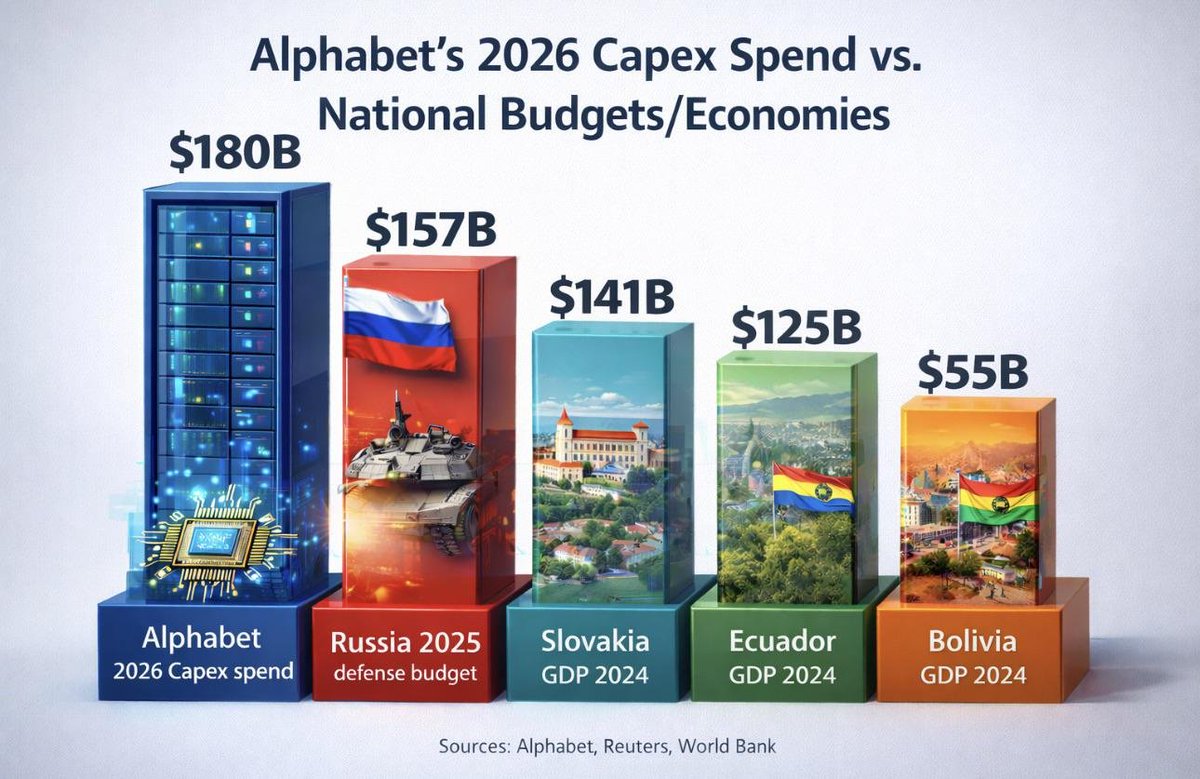
@CheddarFlow $AMZN 200$ billions which is 7% more than Google
English



@elonmusk Can I buy FSD buying with out car? Use FSD in future Tesla car??
English

I should also mention that the $99/month for supervised FSD will rise as FSD’s capabilities improve.
The massive value jump is when you can be on your phone or sleeping for the entire ride (unsupervised FSD).
Sawyer Merritt@SawyerMerritt
NEWS: Tesla has officially discontinued Autopilot in the U.S. and Canada. All new car purchases now come standard with Traffic-Aware Cruise Control. The online configurator has now been updated to allow buyers to choose the $99/month FSD subscription, while still offering the option to purchase FSD outright for $8,000 until February 14th. New Tesla vehicles purchases still come with a 30-day free trial of FSD (Supervised).
English

$NLY
NLY - daily chart analysis 💛
🎯$24 - $25
I’m targeting the measured move out of the ascending triangle breakout and retest and resumption
Ascending triangles like most patterns are consolidation patterns and usually the resume and breakout into the direction of the trend that had preceded that structure
In this case the original trend was upwards before the triangle developed, hence the resumed trend would be upward again
Not financial advice!

English

TRADE PLAN for LOTTO Friday 📈
$SPX up 300+ points since the lows from last Friday. SPX wants to test 6920 and squeeze to 7000 next. Price action has been much more bullish this week.
SPX Nov 28 6830C can work above 6800
$QQQ if it holds the Oct 10th high at 613 next week we can see another push towards 624 by next week.
QQQ Nov 28 615C can work above 613
$TSLA close to a bigger breakout to 440+ as long as the 419 support level holds
TSLA Nov 28 430C can work above 424 tomorrow.
Santa rally setting up for December, Exciting times ahead. Good luck tmrw everyone!! 🫡
English
@Banana3Stocks Non stop down and going back to 200$ range and there no Santa rally on AMZN META
English
$AMZN $SPY $QQQ
$AMZN Weekly chart analysis
My target 🎯$272
For those that remember in the month of September I talked about a cup & handle pattern on the Weekly and Monthly charts.
Amazon had broken out of those patterns which took years to form. The neckline on the Weekly chart pattern is approximately around $240. Often, after a breakout of the structure there is a retest of that neckline to see if prior resistance has become support.
It’s a compelling risk/reward at this juncture has the measured move is projected to be 🎯 $272 - 🎯 $300
I foresee this move happening within the next 4 to 6 weeks
Currently the MACD has the signal line rising above the zero line, and the 14 day RSI has cooled off from approximately 67 to 55 which is a good sweet spot as it has come down from overbought territory to a neutral level with no trend exhaustion
As a reminder the earnings report was well received on heavy volume and subsequently the news on the following Monday of Open AI investing $38B into AWS partnership was also on heavy volume signaling Institutional buying to which I believe they will defend their positions and are look for higher prices towards my measured move
Not financial advice!
Much love 💛🍌🍌🍌
Banana3@Banana3Stocks
$AMZN $SPY $QQQ $AMZN My forecast for the month of November: My target is 🎯 $258 I had mentioned in previous posts that AMZN would be at or near the 50 day moving average heading into earnings. I had also mentioned that this time there would be likely a significant gap above 50 SMA. This has occurred, and here is what I believe will happen next Technical Analysis 101 is that now former resistance has become support, $242 is the approximate new level of support. The 5 DMA (daily moving average) is around $246, recapturing $246 on a daily close would likely bring about a retest of new recent resistance at $250.50 The daily RSI (relative strength indicator) is around 65-67. Stocks with strong momentum usually go to 70 RSI which often starts the signal a short term overbought condition. In fact, the actual stock price will slightly overshoot RSI, often RSI will start to gently come down as price goes up a little more creating what’s called a negative divergence That divergence is usually the signal of forecoming consolidation I expect the stock price to be at 🎯 $255 (which is the after hours earnings report high) near or at the 70 daily RSI level mentioned above. I expect price to overshoot as RSI starts to make the divergence test discussed, that overshoot is my price target of 🎯 $258 by November 21st expiration. P.S. As an added bonus I forecast the end of the year Christmas rally to 🎯🎯 $272 - $276 Not financial advice! Much love 💛🍌🍌🍌
English


@SawyerMerritt @Tesla @theallinpod Why can’t hide the wheel so that if needed cyber can be driven. That helps unexpected situations to drive by using wheel.
English

NEWS: Elon Musk says @Tesla is NOT putting a steering wheel in the Cybercab.
“We’re not putting a steering wheel in them. People may think they want to drive their car, but the reality is they don’t.
via @theallinpod
English
@QuantData This is junk stock for some days and funds are moving out of TSLA for upcoming earnings from other stocks.
English

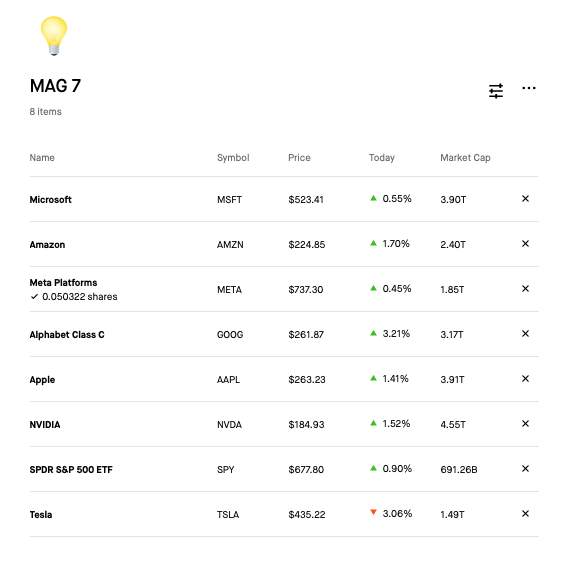
📈 All of the Mag 7 is green today except $TSLA, which is down over 3% intraday.
English