
Менделеев. Таблица и все такое.
4.2K posts
Менделеев. Таблица и все такое.
@DemandExpansion
Космос Katılım Ocak 2020
862 Takip Edilen92 Takipçiler

You can join here 👇🏻
iqs.selly.store/product/28f2c9…
Giving away five discount codes right now. First come, first serve! You can pay with BTC there or if you want any other crypto just DM me.
Joe Mitoshi 👨🏻🚀@CryptoSays
You don’t have to be lost in such market, or get into a parade of loses, one after the other. As a matter of fact, you can make GOOD money every day regardless of the conditions. You just need a good structured mindset, paired with a reliable, consistent, and accurate set of tools to help you do that! In weeks or even days, over 90% students recover the investment and start doing better. The Academy is in full force for spring, planting seeds, ready to conquer the future moves. Join us and let that past behind! 🔥
English
@CryptoSays Hey, Joe - would love to join, can you check your messages?
English
You think you know, but you have no idea... 👺
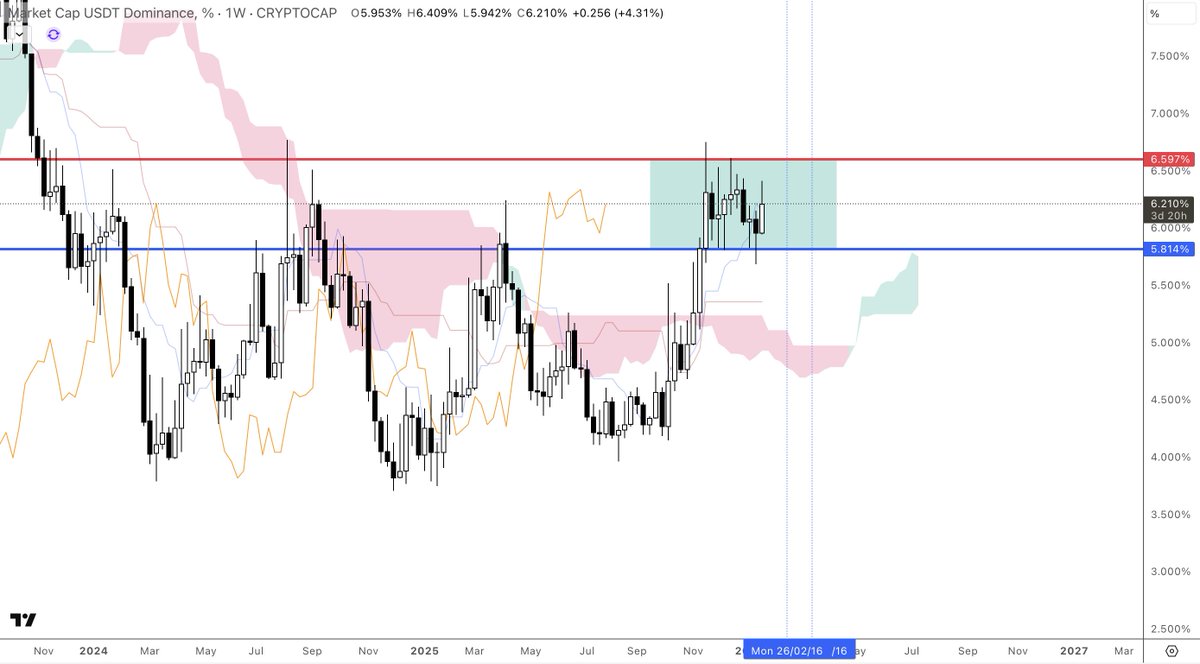
Trap them, when the right time comes, we will be more than READY. There are no doubts here, and the charts are as CLEAN as you can get them, don't let emotion cloud your judgement, just let things flow. $USDT.D
If you want to be a part of the winning team, join the Academy and get ready with us! 👇
theikagisystem.com
Joe Mitoshi 👨🏻🚀@CryptoSays
Main levels for USDT.D 👺🪐
English
Buy Reddit Business Plan to exploit communities and run successful business making $10-30K a month on @Gumroad expansionist7.gumroad.com/l/pqplh
English
@hubermanlab @StuartMcMillan1 I just finished the LA marathon. The guy next to me was skipping almost the entire way
English

The biggest addition to my core fitness regimen in 35 years (which is lift 3X a week, run 3X a week, slow, med, fast)= skipping & striding. Skipping?! Yep. Transformative for speed, power, longevity & mobility. Tomorrow’s HLP w/world class coach @StuartMcMillan1 shows you how.
English


@CryptoSays That red kumo was asking the price to come closer.
English
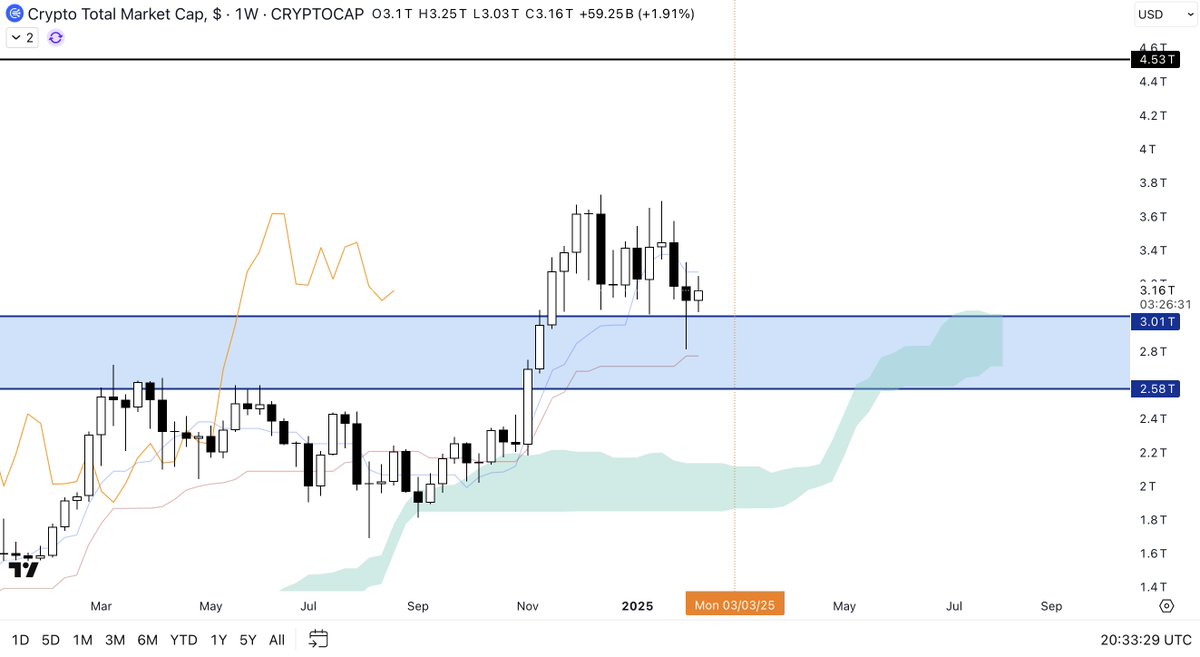
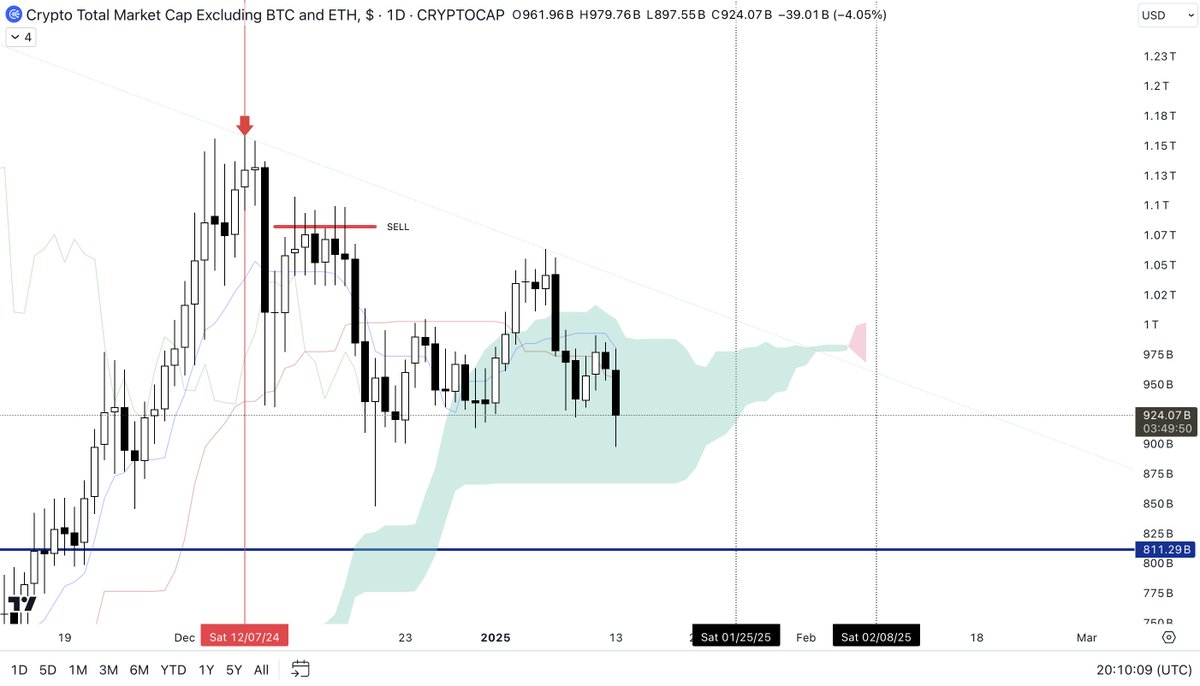
Last MAYOR date we had for TOTAL was August 5th 2024. A new cycle started then. We discussed that if you remember.
Now... I will tell you again, we don't get bearish at SUPPORT. Unless that gets broken, AND we start trending under, only then we can say the music stopped.
Meanwhile you just flow. Some people need to stop looking at the 5m, and start looking at the big picture. By the way this is an idea I've studying for some time, sharing it here so we are aware of the possibilities.
With WP you can plot structures and dates, not only weeks, but months, and years in advance. The accuracy actually increases on higher time frames.
If this happens... I can't imagine your favorite crypto "guru" calling 300K every week for two years... 🤣 Regardless we trade THE TREND. Nothing else matters, not your wishes, hopes, fears, FA, news, NOTHING!
LFG!
theikagisystem.com

Joe Mitoshi 👨🏻🚀@CryptoSays
Warned you then… Failure to breach the top of the WP Range was going to bring a deeper correction. That is still a problematic area for $TOTAL Two lines of defense for now, the Kijun and the Kumo. Next relevant 1W Pivot is August 5th. Don’t play the hero trying to catch bottoms with the price floating between key levels and key dates. Be patient, have a plan, and a strategy! #Cryptoikagi #Crypto $BTC
English
@CryptoSays I'm just waiting for Mar 3rd, that's it
English
Trust the box, eager to see the 1W Close this next Sunday. (This is a Gann/WP Hybrid). 🪐

Joe Mitoshi 👨🏻🚀@CryptoSays
Haven't done one of these in a few years. The most beautiful thing here is that the levels in this case were calculated using a mathematical formula used in traditional physics. Crazy right!? 🤐❤️ Feels good. It might give us some interesting data down the road. $BTC 👉 theikagisystem.com
English
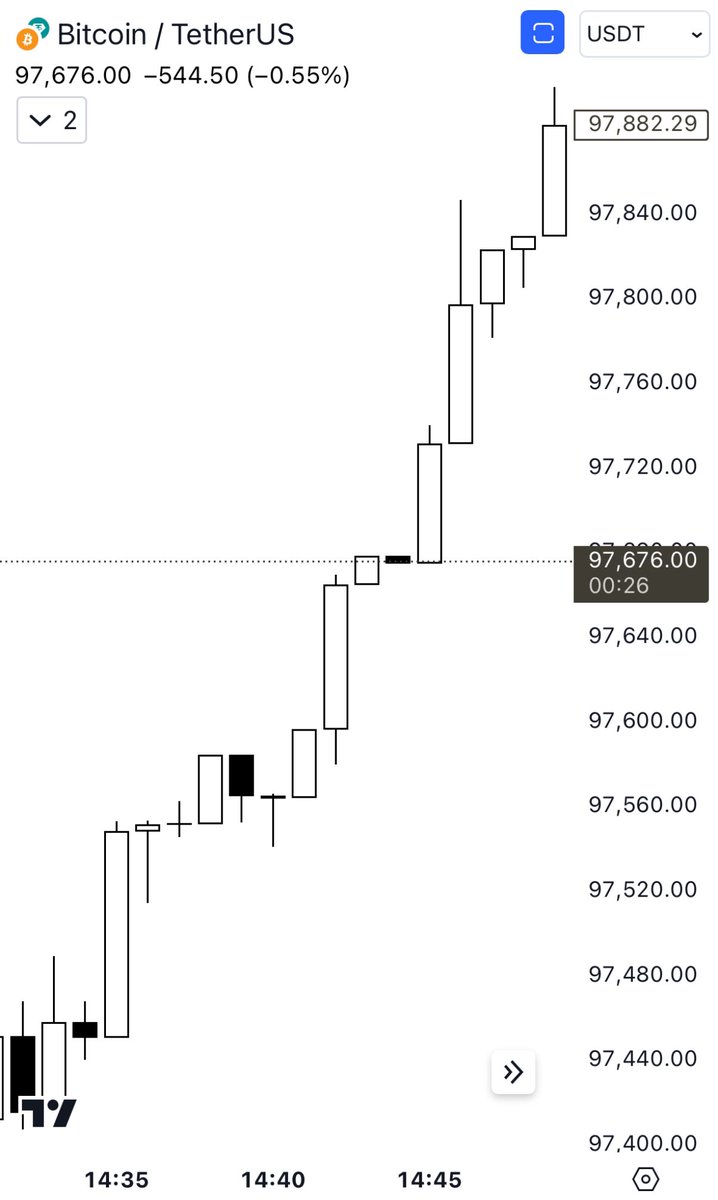
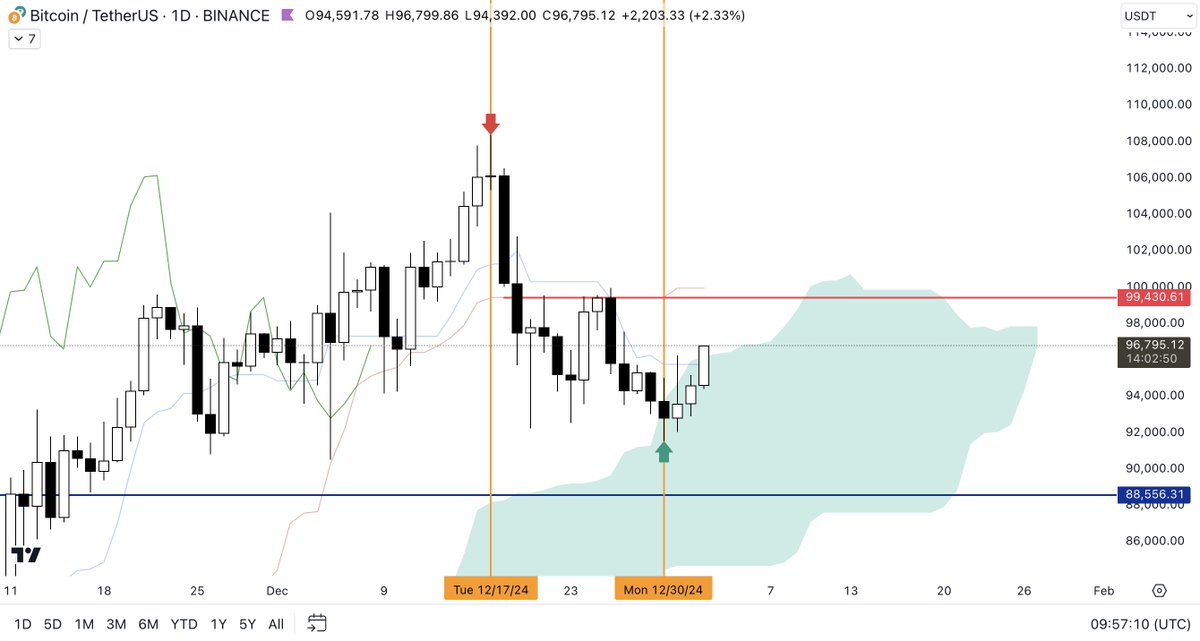
Following up on this. You can see that we got the expected pump to resistance, and of course a little rejection was expected too.
Also you can see how things can change under the right conditions. SSB curling up, as well as the Tenkan. Also the Chikou bounced right on time from the Kumo and now is sitting above it. All great signs for bulls.
What to expect? Simple there are three scenarios:
1. Price gets an unexpected catalyzer and breaches the Kumo right here (Bullish)
2. Price walks under the Kumo resistance until the next pivot and breaches the Cloud on the thin part (Discussed on the previous post - Bullish).
3. Price gets rejection on the next 1D WP Pivot and keeps the path down. (Bearish).
Remember the 1D bias is neutral to bearish, so in this case the "invalidation" would be the bull case. That's important from the mathematical probability POV.
As you can see just by following a simple set of rules and cues just from Ichimoku (This post is not addressing WP Levels or Pivots), then we know what to expect with consistency. And this is complicated because it is moving sideways, during bull/bear trends is even easier. $BTC
For more on Ichi and WP:👉 theikagisystem.com

Joe Mitoshi 👨🏻🚀@CryptoSays
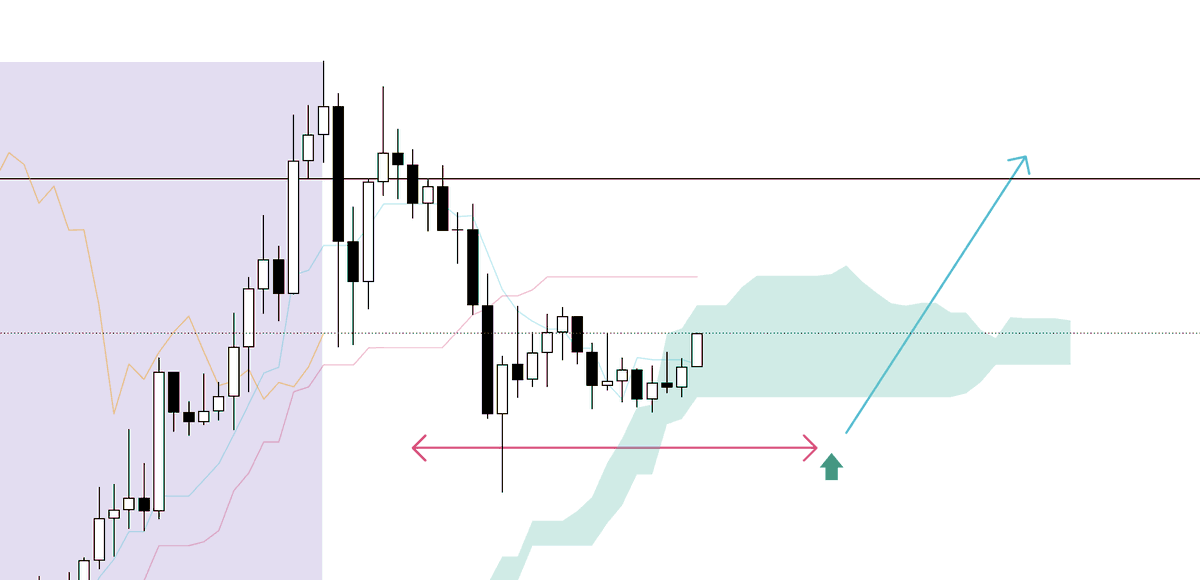
Let's do some Ichimoku 101 today, to those interested. The 5 lines represent "different" points in time towards the future. From short to long term. Simple structure. Any line, and the price under the cloud is bearish, above is bullish. Here we can see interesting points for example the Tenkan and the Kijun (Red and blue) are bearish and below the Kumo, price right now is actually contained there. Simply put, chop. The flat line (SSB) means that's a KEY level for now acting as a resistance, it also shows us there's a WEAK point at the cloud. That's the only bullish case here, break above the Kumo and that level, and we will likely start a NEW impulse. The Chikou or Lagging Span is inside the Kumo but once it gets under in a few days it won't have any support, so it will be free to move to lower levels. All of this paired with the fact that we are at a WP 1W Range as I told you early in December. Put it all together you get a dynamic, and VERY CONSISTENT mathematical read that tells you price is neutral with a bearish bias. These things are not against you, it is what it is, you either see it or you don't. Like I mentioned above there's a chance Bitcoin breaks the Kumo and invalidates this setup. But again, that would be an INVALIDATION, not the expected move. In math probability always favors the actual model, not the invalidation. So unless that happens, the expected action is the price to continue the trend down. For more information or questions I am happy to help!
English
@CryptoSays Ftx payouts will buy it all
English
Range continues, and our plan too. Exactly, candle by candle from the model we had on the Academy since December. 🪐
Ignore those who say "This was impossible to forecast". People get emotional, and desperate without reason, it is just the lack of understanding of a very clear, and needed process, to put motion to rest briefly, and find equilibrium in order to gather momentum again.
Basically, the same thing that happened last year. And the only goal for that is to flush down those who think this is an easy game. Thus the "transfer of money from the impatient to the patient".
So patiently waiting for now, the IMPORTANT confirmations from the system. We are not in the game of guessing an "ultimate pico bottom" I rather leave that to the gamblers, look were we are so far...
Threw there the next 1W WP Pivot, you're welcome! 👺
Joe Mitoshi 👨🏻🚀@CryptoSays
W&P Pivot Day! (1W + 1D). Closing the year with a strong Solar Storm... ... Because why not. 😅 $BTC $TOTAL ➡️ theikagisystem.com
English
I’m really serious about this one…👺
02/20/2025 is a date to pay close attention.
The energy for that day revolves around circulation, the circulation towards a specific direction, the completion of space and time.
👉🏻 theikagisystem.com
English
@CryptoSays That flat red lump top is a magnet, wants the price come closer
English
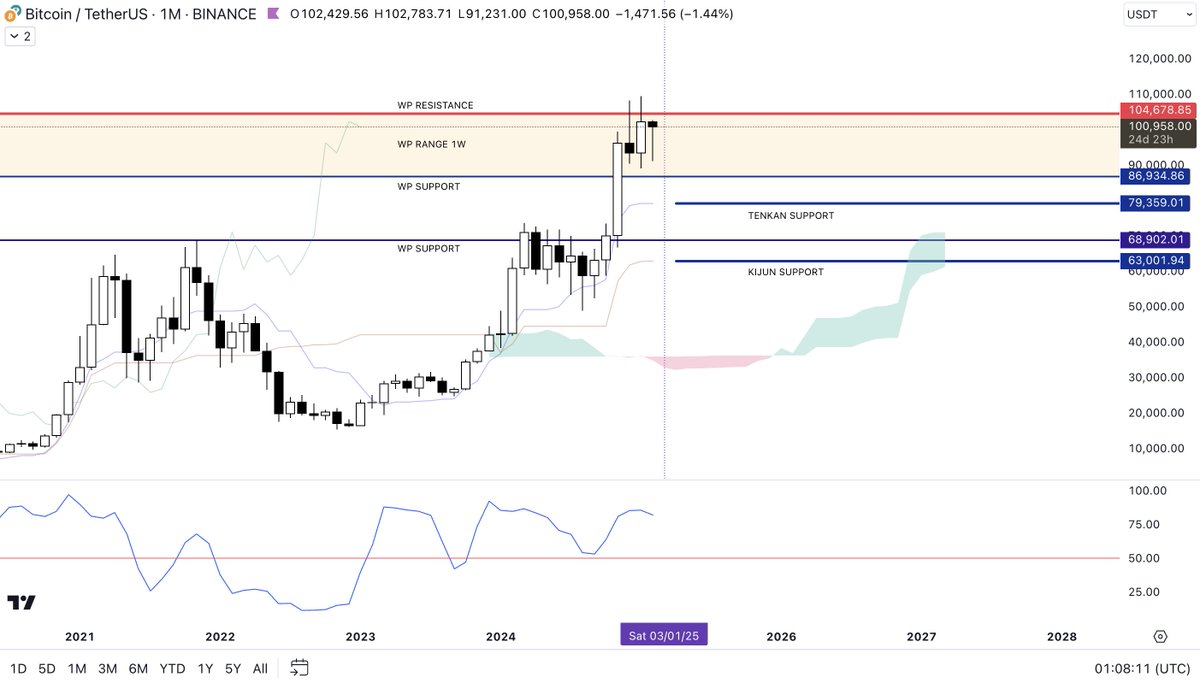
We pretty much have most of the year plotted, for both alts, and $BTC. However don't forget this: 1M reigns over the 1W, in the same way the 1W reigns over the 1D.
Keep it simple guys, simply flow like water.
Sharing this guide from IKAGI with ya'll! 👹🪐
Previous 1M Pivot: October.
Next 1M Pivot: March.
Resistances/Supports on the chart.
Ichimoku: Neutral. Slightly out of balance.
Ichimoku Kumo: Bullish.
If you want to know more about the system used for this check the website: theikagisystem.com
English
@CryptoSays Equal lows on monthly might not survive without a sweep
English
Line in the sand for $ETH. 1M Pivot April 2025.
Either it holds the Kumo support. Or it will simply start a painful path back to the local bottom. I don't think that's going to happen. But you always need to be prepared for any scenario.
This is certainly not a time to get bearish, again as long as we hold that level, things should be ok!

English
We might get our little Black Friday after all and good opportunity to buy euphoria.
Let alts fall or stall until then, everyone gathers on the table at Thanksgiving’s dinner discussing why crypto is the path to unlimited wealth, let them ALL IN….
When December comes a few days later, they will truly taste crypto! 😅
English
@CryptoSays But my alts, Joe! They didn't move, Joe!
English
OMG! This can't be! What is this? A clear prediction, price structure, price levels, and the EXACT date (Jan 13th) of the bottom, what? Two months before it happened? Probably we got lucky.
Yeah this was probably too cryptic, and complicated to understand, my apologies... While you are trying to understand the signals on the 1H chart, we are following a plan that we developed MONTHS ago. We are not the same! 🪐👹
All thanks to our system! And the community we have built over the years, it is the combined effort of amazing and bright minds working together, to plan, strategize, and execute without bias, or emotions.
Bring it, the future is bright.
👉 theikagisystem.com

Joe Mitoshi 👨🏻🚀@CryptoSays
If there IS a place for this thing to take a little break I'd say it would be around this area. Time to sit back, sleep a little, reload, and keep the party alive. Throwing a little 1W WP Pivot there, because why not! 🪐👹 $TOTAL #Crypto #Cryptoikagi
English
@PonjevicS @CryptoSays CT fam loves you back
English

@CryptoSays You are bullish on Alts in period od 25 JAN to 08 FEB?
Or?
English
Supporting the CT fam! That's the period in terms of time that you need to pay attention to in reference to alts. Remember: One day at a time! 🪐
Time is always the best judge. #TIMEMATTERS
$TOTAL3
Joe Mitoshi 👨🏻🚀@CryptoSays
Daily wants to find support at the Kijun, but sell pressure is strong, regardless that's a support. We have a WP 1D Pivot tomorrow, if we lose that then the next one is down there at the Kumo, and the structure starts to err on the bear side. $TOTAL3 #Cryptoikagi
English
@AstroCryptoGuru I agree with that premise and intensifying nature of disasters. That said, it takes one year to approve the debris cleaning for the victims of wildfires in California. It takes over a year for me to approve a fence in the south bay. For amount of taxes we pay, ppl expect better
English
Blame whoever you want yell and scream all you want but just like the catastrophic floods in Asheville ….
The fire in LA is mainly due to the climate crisis and climate scientists have been warning us for decades this would happen
Modern fire are fundamentally different now
But republicans will gaslight the apocalypse
English
@CryptoSays 1m charts are good for tape and reversals
English
I don’t why people here have to be like “xyz is mooning”… So I run to TV to see what did I miss, to realize they’re on the 1m chart… Like 🤷🏻♂️
English
Few... 👹
Learn WP! 🪐😎
➡️ theikagisystem.com
Joe Mitoshi 👨🏻🚀@CryptoSays
Did you know certain market formations, or movements have a very specific vibration in terms of a very specific time needed to "come to balance" or form a reversal. Making those periods where we need to be "patient" more tolerable. Yes they do! And some of them are VERY consistent, and very reliable. The more you know... Time matters! PS: Random chart for illustration purposes only. #Cryptoikagi
English
Haters that can't deal with the fact that they have no logical idea of how we do this will find a way to insult and say we were wrong. While we keep the head down working hard to get a bit better every day. 🪐👹
There's no magic. WP's math, simply works! 😁
$BTC
➡️ theikagisystem.com

Joe Mitoshi 👨🏻🚀@CryptoSays
As expected! 🪐 Waiting for alts more than anything to hit those KEY WP supports. $BTC #Crypto #Cryptoikagi
English