
ehe2202
176 posts


Every day it’s the same story. There is absolutely nothing bearish in the silver market.


Comex total #Silver inventories fall by over 2.9 Million ounces as ounces continue to head east 😳 Registered fell by 842,000 ounces!


I don’t care what the paper price of silver is. I need physical silver. And I need it NOW! This is exactly what the market is saying when you look at the 1-year silver swap minus US interest rates. In a normal market, this line is above zero. That’s called contango. Why? Because owning silver has a cost of carry. If you buy physical silver today and hold it for a year, your money is tied up (you lose interest), and you pay for storage and insurance. Those costs are reflected in the forward price. Signal: There is plenty of physical silver available. No stress. No urgency. When the line drops below zero, the market is in backwardation. That is abnormal for a storable commodity like silver. It means buyers are willing to pay a premium to get the metal NOW rather than later. In silver, this usually happens when lease rates (the rate you earn by lending out silver) are higher than cash interest rates. Signal: There is a shortage of physical silver in the spot market. Fabricators, mints and industrial users need metal immediately and can’t wait. The market is basically saying: “We need your silver so badly that we’ll pay you to sell it now and buy it back later.” Right now, we are not in backwardation. We are in EXTREME backwardation. What this usually means: • Vaults are being drained (LBMA, COMEX, etc.) • Short squeeze dynamics: shorts are being forced to buy back contracts or deliver metal that isn’t there • Decoupling risk: the “paper price” and the real price of a bar in your hand start to separate That negative swap rate is the premium the market is paying for real, physical ownership. This is one of the key reasons why I think the silver rally is far from over. And if you want the other 11 reasons, read the post below. 😉


If earlier this week your favorite guru told you gold and silver could only go higher bc physical markets were now in charge and then today they told you that gold and silver were only falling bc paper markets were back in charge…you need a new guru.


Silver is now trading in triple digits in the West: $103.11. Not just an intraday spike, but a daily close above $100. And not just a daily close, but a weekly close above $100. To celebrate, here are 12 reasons why the silver rally is far from over 🧵


Three charts explain why the silver rally is not over. 
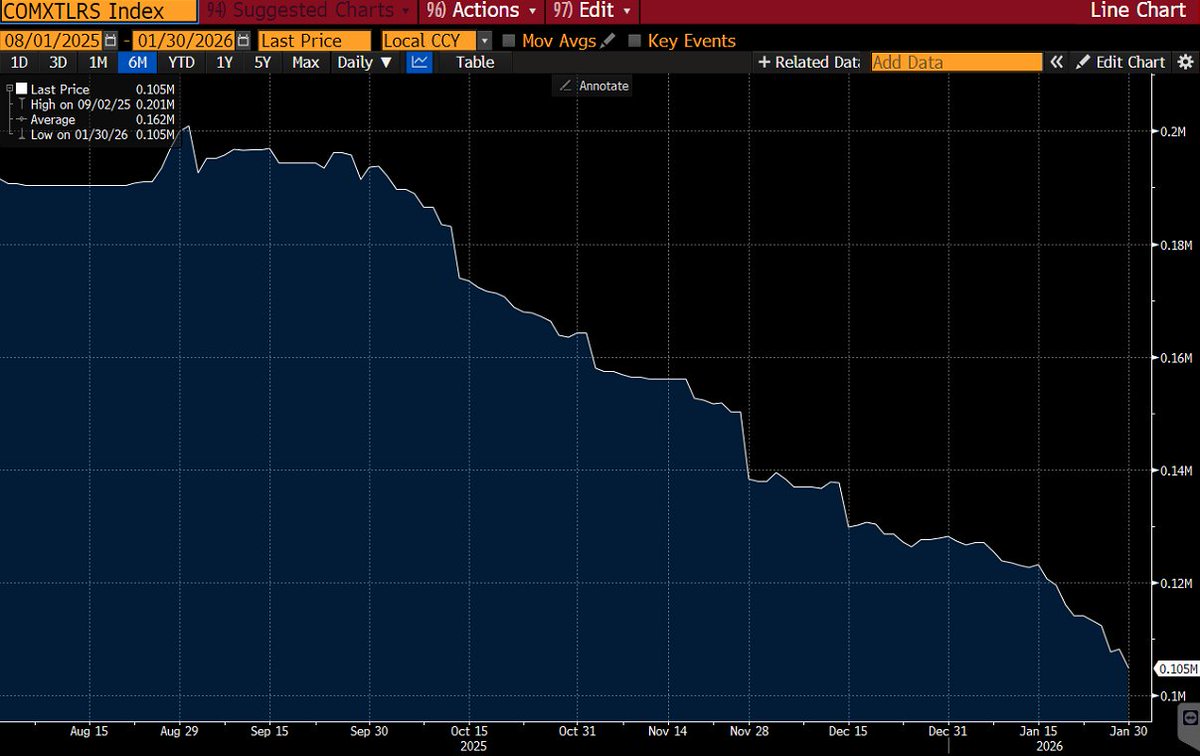
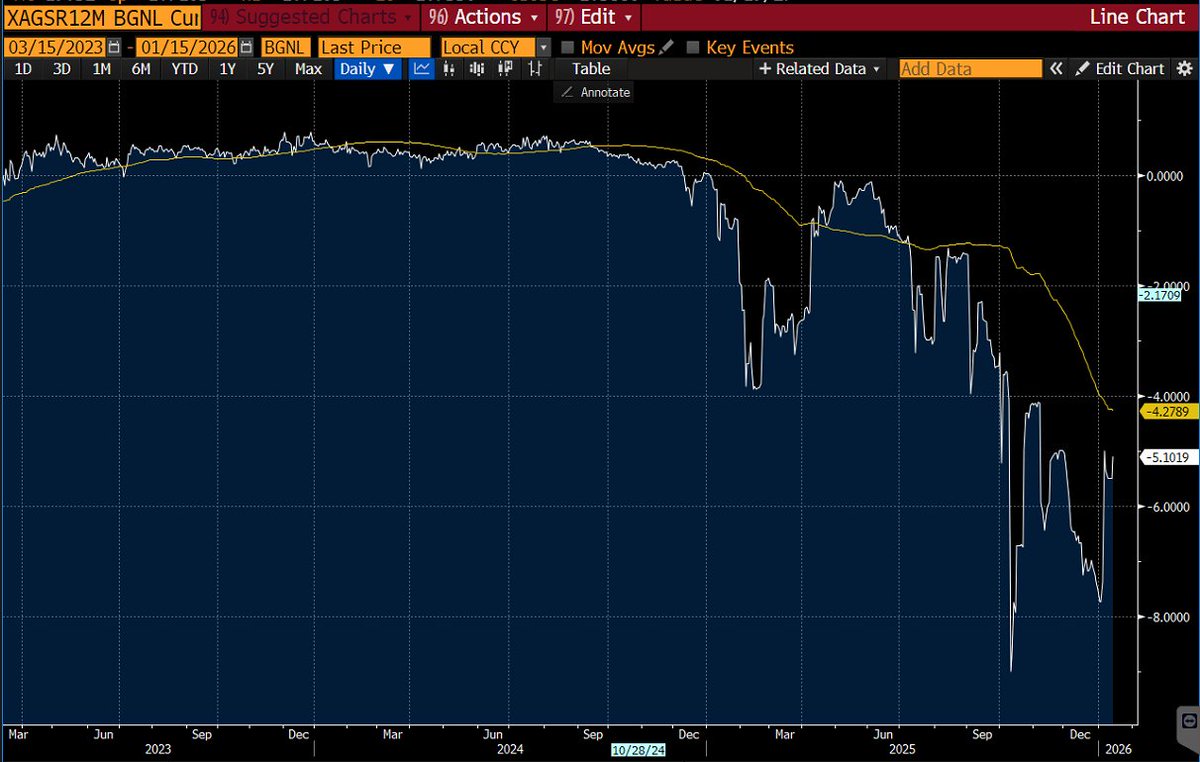
All three charts use a 100-day moving average. The goal is simple: remove noise and focus on the signal. 
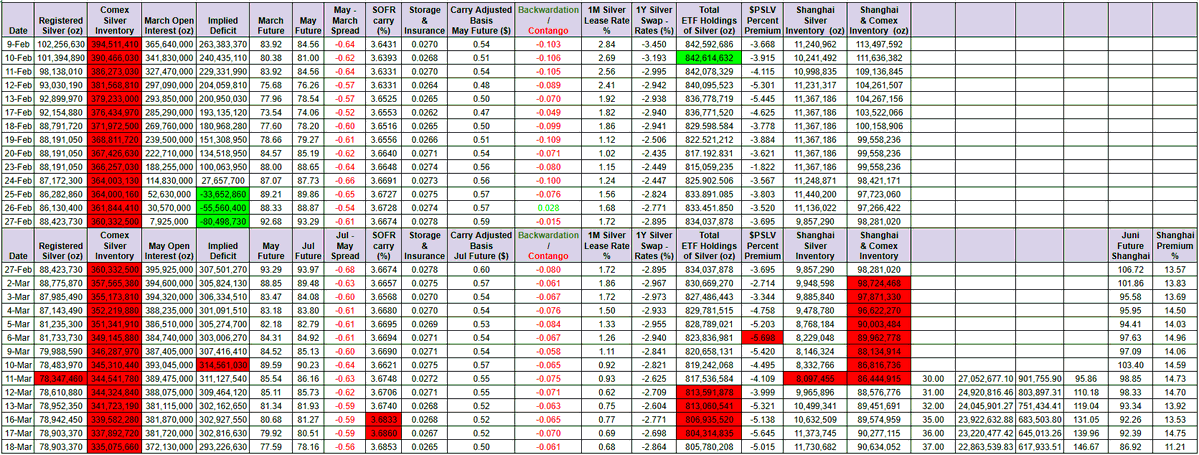
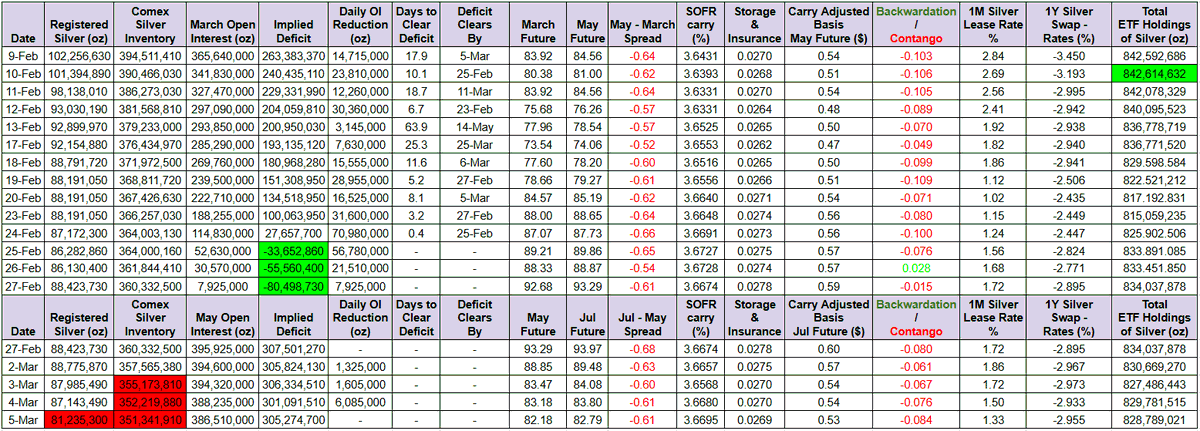
The first chart shows the 1-month silver lease rate. In a balanced market, this should sit around 0%, which is marked by the red line. Instead, the 100-day average is currently 6.28%, already an extreme level. Even more telling, the latest reading is 8.53%, which means the average itself is still rising. This reflects how limited the availability of physical silver has become. High and rising lease rates are a classic signal of physical market stress. The second chart shows the 1-year silver swap, adjusted for the US interest rate. This adjustment matters because cash is paid today while silver is delivered one year later, allowing the seller to earn interest in the meantime. After adjusting for that, this number should be positive for two reasons. Silver must be stored and insured for a year, which is not free, and if the swap were negative, arbitrage would normally eliminate it by buying physical silver today and selling it forward. The fact that the 100-day average is roughly 4 percentage points below zero, and that the latest reading was about −7.9%, shows how severe the shortage of physical silver really is. The downtrend in the 100-day average confirms that stress is increasing. 
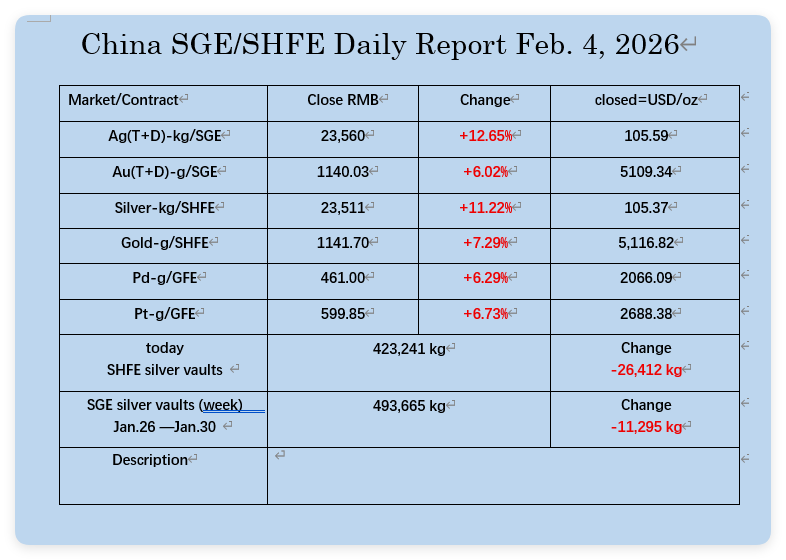
The third chart shows the Shanghai silver premium. In normal conditions, this should hover around 0%. Since 2023 it has been structurally higher, with a peak reached in 2024. The sharp rally in Western silver prices temporarily compressed the premium to just over 1%, but it has since started rising again. Just before Christmas, the premium briefly reached 12%, the highest level on record. While the spot premium has not exceeded that peak since, the 100-day moving average has continued to rise. This highlights persistent physical demand in the East. If we zoom out, all three indicators are now above their 100-day moving averages. Taken together, they tell the same story. The silver market still requires meaningfully higher prices to bring supply and demand back into balance.


